The AlwaysOn Health Model Part 1 -- Health Model Architecture
After successfully deploying a high availability solution using SQL Server 2012 AlwaysOn, monitoring and maintaining its health is critical. In this post, we’ll give an overview of the health model used by the AlwaysOn Dashboard and PowerShell cmdlets to support these monitoring scenarios. This is part 1 of a multipart series looking at the AlwaysOn health model.
Part 1: AlwaysOn Health Model Overview
The AlwaysOn health model is built on top of the Policy Based Management (PBM) feature of SQL Server. If you are unfamiliar with this technology, read up on it here.
The core feature of PBM is, unsurprisingly, policies. A policy consists of, in part, the following:
- A target: An object or set of objects that the policy runs against.
- A condition: A Boolean expression specifying the expected state of the target. If this condition evaluates to false, then the policy has been violated.
- A category: A simple mechanism for organizing policies.
Once you define a policy, PBM provides an engine for executing the policy and obtaining the result (true or false – the target is within policy or is in violation of policy). At the core of our health model is a collection of PBM policies defined against AlwaysOn objects. You can find these policies in the following location under Object Explorer: Management > Policy Management > Policies > System Policies. The conditions used by these policies can be viewed under Management > Policy Management > Conditions > System Conditions. The policies are granular enough to clearly indicate intent (i.e. “The Availabilbility Group is ready to failover”).
A central concept in our health model is that all policies are not equal – some policy violations are more serious than others. To support this, we use the category mechanism provided by PBM. Critical policies are placed into an “Error” category, while less critical policies are placed into a “Warning” category.
We now know enough to look at the basic algorithm used by our health model to compute the health of an object:
- Execute all policies defined against the object (we’ll see later how we discover these policies).
- If any policies in an “Error” category are violated, then report that the target is in an “Error” state.
- Otherwise, if any policies in a “Warning” category are violated, then report that the object is in a “Warning” state.
- Otherwise, report that the object is “Healthy”.
In the case of AlwaysOn, computing the health of an availability group involves repeating this algorithm for all relevant objects–all availability replicas, all database replicas, the availability group itself, and the server on which the group is hosted. This is more or less what the AlwaysOn dashboard does: runs policies against all these objects then organizes the results. Similarly, the AlwaysOn PowerShell cmdlets – Test-SqlAvailabilityGroup, Test-SqlAvailabilityReplica, and Test-SqlDatabaseReplicaState – give you access to the health model computations for the three object types mentioned, though in this case you are responsible for running the individual cmdlets and organizing the results. Note that you can evaluate these policies independently as well (How to: Evaluate a Policy-Based Management Policy). You might do this if you want to investigate an error in the dashboard more closely.
Where Does the Health Model Run?
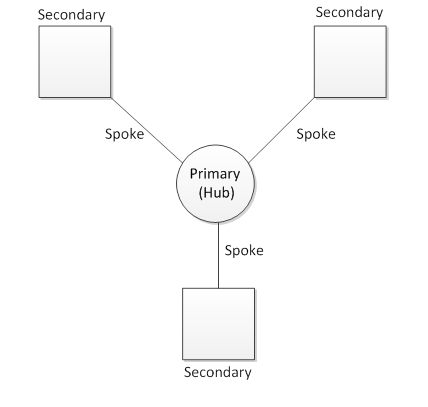
AlwaysOn is a multi-server system, so a fair question is: on which server should I run these policies? The answer is: it typically only makes sense to run the policies on the current primary replica of the availability group. The reason for this is that the primary replica has all of the information necessary to compute an accurate health result for the entire availability group. It can gather data from all the replicas in the system. Secondary Replicas, on the other hand, only know about themselves and the primary. This is known as a hub and spoke model.
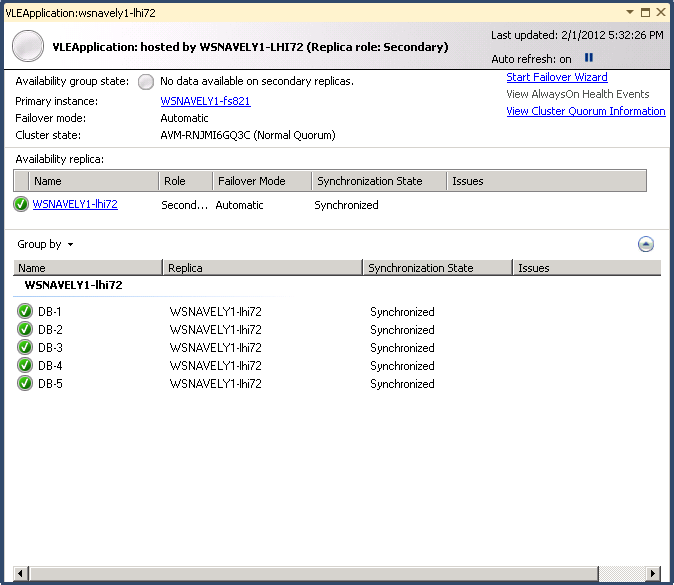
You can still evaluate the health model on a secondary replica, and policies will run against local objects (for example, local databases), but the overall result of the evaluation is likely to be “Unknown.” That is, the health model reports that it cannot accurately determine the health of the availability group since it lacks enough information. We’ll see more details about this in the next section regarding categories. Here is an example of what the dashboard looks like in this case (launched from a secondary replica):
A Closer Look At AlwaysOn Health Model Categories
We’ve mentioned that we use the category mechanism of PBM to assign a severity to a policy, but there is somewhat more to the story than that. We also use categories to organize policies based on their target type. Moreover, we use these categories as a discovery mechanism. That is, the health model explicitly looks for policies in these categories when determining which polices to run against a given object. Overall, we define 8 categories in this release – a warning and error category for four different target types. Here is the full list:
- Availability database errors\Availability database warnings
- Policies in these categories run against availability databases (also referred to as database replicas in other parts of the system). The corresponding facet is "Database Replica State".
- Availability group errors (any replica role)\ Availability group warnings (any replica role)
- Policies in these categories run against availability groups. The “any replica role” qualifier indicates that these policies can be run on any replica within the availability group. For example, if I launch the dashboard from a secondary replica, policies in this category will be evaluated. Note that some policies in this category target the underlying Server object. This is necessary to verify properties of the WSFC cluster that are exposed on the Server facet. The corresponding facets are "Availability Group State" and "Server".
- Availability group errors (primary replica only)\ Availability group warnings (primary replica only)
- Policies in these categories also run against availability groups. However the “primary replica only” qualifier indicates that these policies will not be executed on a secondary replica. For example, if I launch the dashboard from a secondary replica, these policies will not be executed. The corresponding facets are "Availability Group State" and "Server".
- Availability replica errors\ Availability replica warnings
- Policies in these categories run against availability replicas. The corresponding facet is "Availability Replica".
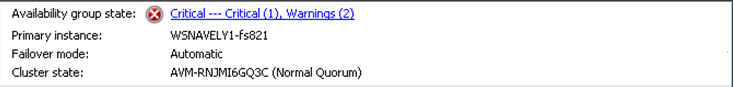
Let’s go through the dashboard piece by piece and see how these categories come into play. First, the “Availability Group” section of the dashboard:
This section is computed by running policies in these four categories:
- Availability group errors (any replica role)
- Availability group warnings (any replica role)
- Availability group errors (primary replica only)
- Availability group warnings (primary replica only)
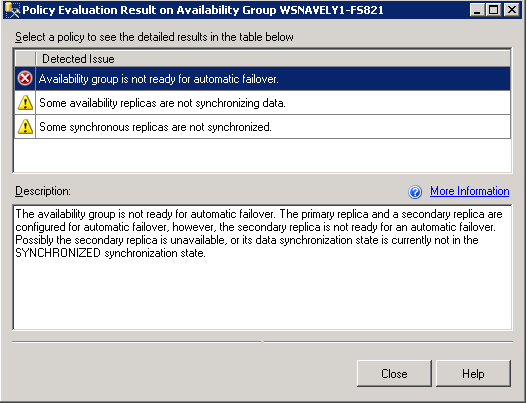
Note that if you launch the dashboard from a secondary, only the first two categories are considered. The hyperlinked text tells me that I have 1 critical error and 2 warnings – this means 1 policy in an error category failed, and 2 policies in a warning category failed. If I click on this hyperlink, I get more information about the policies that failed.
Next, the “Availability Replicas” section of the dashboard:
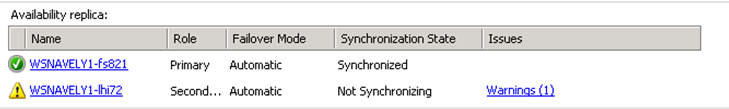
Health states here are computed by running policies in the Availability replica errors\ Availability replica warnings categories. When the dashboard is run from a secondary, you will only see the local availability replica here. As above, you can click on the “Warning” hyperlink to learn more about the policies that failed. Lastly, the database replica section of the dashboard:
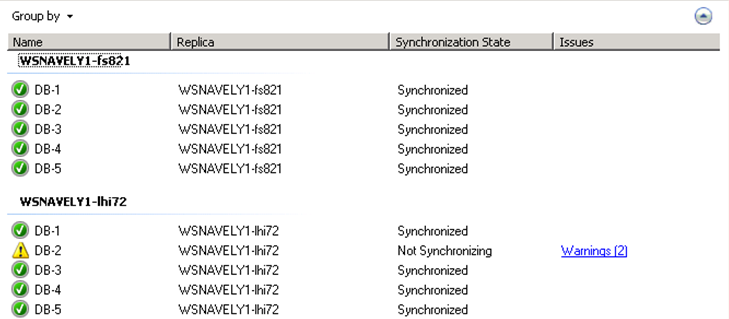
Health states here are computed by running policies in the Availability database errors\Availability database warnings categories. When the dashboard is run from a secondary replica, you will only see local databases here.
We’ve now covered the basic architecture of the AlwaysOn Health model, and showed how the dashboard reflects this architecture. In the next post we’ll show how you can extend this health model to meet your business needs.