Заметка
Доступ к этой странице требует авторизации. Вы можете попробовать войти в систему или изменить каталог.
Доступ к этой странице требует авторизации. Вы можете попробовать сменить директорию.
Reviewed By: Dimitri Furman
DBCC CHECKDB is a common database maintenance task. It can take up significant amount of system resources, and can impact the performance of the production workload. There are some very good articles on the web on optimizing performance of DBCC CHECKDB and minimizing performance impact. SQL Server 2016 (and now backported to SQL Server 2014 SP2) provides another lever to manage resources consumed by DBCC CHECKDB. Now you can apply a MAXDOP option to the DBCC CHECKDB command (and to DBCC CHECKTABLE and DBCC CHECKFILEGROUP commands as well).
When MAXDOP is not specified with DBCC CHECKDB, the command uses the instance level “max degree of parallelism” configuration option. If the instance level configuration is 0 (default), DBCC CHECKDB could employ all the processors on the server and consume lots of resources, leaving very little room for the application workload. When a lower MAXDOP is used, less resources are used, but CHECKDB would take longer to finish.
The syntax of specifying MAXDOP to DBCC CHECKDB is pretty simple:
DBCC CHECKDB WITH MAXDOP = 4
Note that this command respects the MAX_DOP value that may be specified for the Resource Governor workload group used for the session running the command. If the MAXDOP value specified in the DBCC CHECKDB command is greater than the one in the Resource Governor configuration, then the latter will be used.
Figure 1 shows the elapsed time and CPU percentage for a DBCC CHECKDB test with and without MAXDOP.
[caption id="attachment_3995" align="alignnone" width="1073"]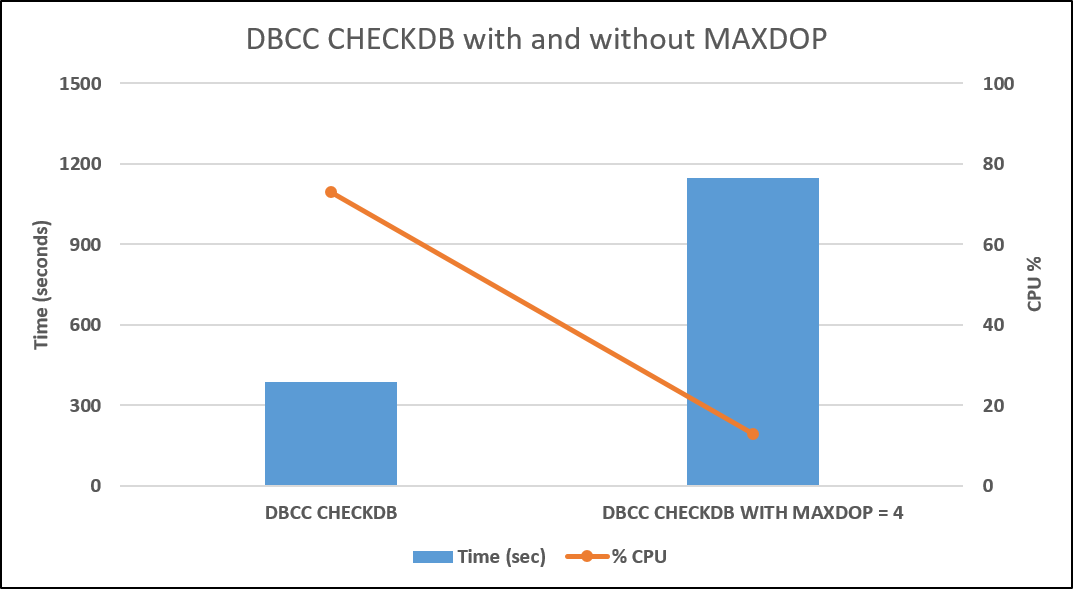 Figure 1: DBCC CHECKDB with and without MAXDOP[/caption]
In the above test, the server has default MAXDOP setting of 0. The server is 24-cores and the database size is about 190 GB. This shows that as the MAXDOP for the DBCC CHECKDB command is lowered from 0 (meaning all 24 cores) to 4, the time it takes to run increased from about 400 seconds to about 1100 seconds, while average CPU utilization is reduced from about 70% to about 10%, making the impact of DBCC CHECKDB on the application workload nearly negligible. Your mileage will vary, depending upon your hardware configuration.
Comments
- Anonymous
August 25, 2016
The X-Axis legend is incorrect.- Anonymous
August 25, 2016
Thanks for your comments. The legends are correct. can you please elaborate why you think it is incorrect.
- Anonymous
- Anonymous
May 02, 2017
Hi, It is hard to understand for me that, when you compare dbcc checkdb with MAXDOP, in that case CPU (i.e right vertical) increased to 70 % and time (i.e left vertical) increased to 1100 secs. Please explain why both increased or I might be thinming wrongs axis allocation in above graph.- Anonymous
May 17, 2017
The comment has been removed
- Anonymous
- Anonymous
July 13, 2017
I am running SQL Server 2016 Ent on VMware, memory 96gb, cpu - 12, running DBCC on database (size 86gb), keeps failing , looks like it finishes but with error - "There is insufficient memory available in the buffer pool., tried everything, ticket open with MSFT support, they have gone through the logs and nothing so for, weird thing same database in my SQL Server 2012 environment DBCC runs in 4 minutes. Need help...- Anonymous
July 13, 2017
For a problem like this, it is best to continue to work with support. Troubleshooting via blog comments is much less effective.That said, have you tried reducing MAXDOP for the DBCC CHECKDB command as described in this blog? Also check your Resource Governor configuration on the problem server to see if anything looks unusual there. Does the error message mention "buffer pool" or "resource pool"?
- Anonymous