Collect and analyze resource logs from an Azure resource
Resource logs provide insight into the detailed operation of an Azure resource and are useful for monitoring their health and availability. Azure resources generate resource logs automatically, but you must create a diagnostic setting to collect them. This tutorial takes you through the process of creating a diagnostic setting to send resource logs to a Log Analytics workspace where you can analyze them with log queries.
In this tutorial, you learn how to:
- Create a Log Analytics workspace in Azure Monitor.
- Create a diagnostic setting to collect resource logs.
- Create a simple log query to analyze logs.
Prerequisites
To complete the steps in this tutorial, you need an Azure resource to monitor.
You can use any resource in your Azure subscription that supports diagnostic settings. To determine whether a resource supports diagnostic settings, go to its menu in the Azure portal and verify that there's a Diagnostic settings option in the Monitoring section of the menu.
Note
This procedure doesn't apply to Azure virtual machines. Their Diagnostic settings menu is used to configure the diagnostic extension.
Create a Log Analytics workspace
Azure Monitor stores log data in a Log Analytics workspace. If you already created a workspace in your subscription, you can use that one. You can also choose to use the default workspace in each Azure subscription.
If you want to create a new Log Analytics workspace, use the following procedure. If you're going to use an existing workspace, move to the next section.
In the Azure portal, under All services, select Log Analytics workspaces.
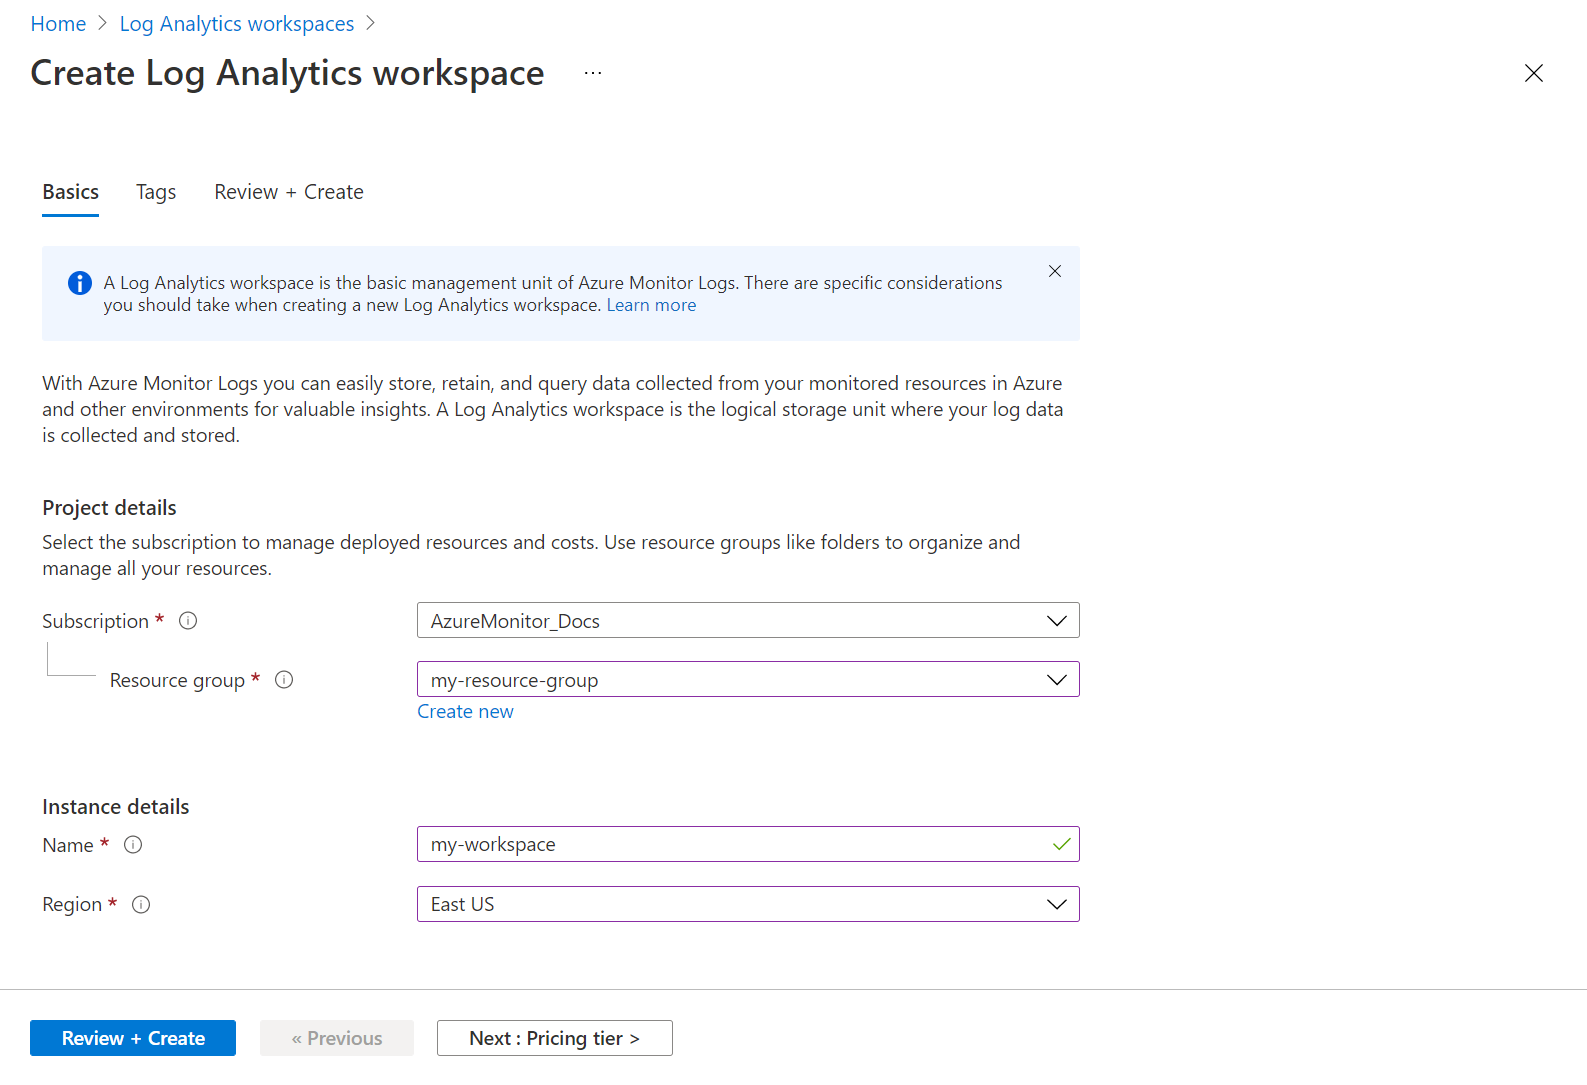
Select Create to create a new workspace.
On the Basics tab, select a subscription, resource group, and region for the workspace. These values don't need to be the same as the resource being monitored. Provide a name that must be globally unique across all Azure Monitor subscriptions.
Select Review + Create to create the workspace.
Create a diagnostic setting
Diagnostic settings define where to send resource logs for a particular resource. A single diagnostic setting can have multiple destinations, but we only use a Log Analytics workspace in this tutorial.
Under the Monitoring section of your resource's menu, select Diagnostic settings. Then select Add diagnostic setting.
Note
Some resources might require other selections. For example, a storage account requires you to select a resource before the Add diagnostic setting option is displayed. You might also notice a Preview label for some resources because their diagnostic settings are currently in preview.
Each diagnostic setting has three basic parts:
- Name: The name has no significant effect and should be descriptive to you.
- Categories: Categories of logs to send to each of the destinations. The set of categories varies for each Azure service.
- Destinations: One or more destinations to send the logs. All Azure services share the same set of possible destinations. Each diagnostic setting can define one or more destinations but no more than one destination of a particular type.
Enter a name for the diagnostic setting and select the categories that you want to collect. See the documentation for each service for a definition of its available categories. AllMetrics sends the same platform metrics available in Azure Monitor Metrics for the resource to the workspace. As a result, you can analyze this data with log queries along with other monitoring data. Select Send to Log Analytics workspace and then select the workspace that you created.
Select Save to save the diagnostic settings.
Use a log query to retrieve logs
Data is retrieved from a Log Analytics workspace by using a log query written in Kusto Query Language (KQL). A set of pre-created queries is available for many Azure services, so you don't require knowledge of KQL to get started.
Select Logs from your resource's menu. Log Analytics opens with the Queries window that includes prebuilt queries for your resource type.
Note
If the Queries window doesn't open, select Queries in the upper-right corner.
Browse through the available queries. Identify one to run and select Run. The query is added to the query window and the results are returned.
Next steps
Once you're collecting monitoring data for your Azure resources, see your different options for creating alert rules to be proactively notified when Azure Monitor identifies interesting information.


