Изучение панели мониторинга .NET.NET Aspire
В предстоящих разделах вы узнаете, как создать проект .NET.NET Aspire и приступить к следующим задачам:
Изучите возможности панели мониторинга с помощью приложения, созданного из шаблона проекта, как описано в кратком руководстве по . Создание первого проекта .NET.NET Aspire.
Углубиться в функции приложения панели мониторинга .NET.NET Aspire.
Снимки экрана, показанные в этой статье, демонстрируют темную тему. Дополнительные сведения о выборе темы см. в выбора темы.
Проверка подлинности панели мониторинга
При запуске узла приложения .NET.NET Aspire оркестратор запускает все зависимые ресурсы приложения, а затем открывает окно браузера на панели мониторинга. Панель мониторинга .NET.NET Aspire требует проверки подлинности на основе маркеров для своих пользователей, так как она отображает переменные среды и другие конфиденциальные сведения.
При запуске панели мониторинга с Visual Studio или Visual Studio Code (с расширением C# Dev Kit), браузер автоматически вошел в систему, а панель мониторинга открывается непосредственно. Это типичный интерфейс разработчика F5, а поток входа для проверки подлинности автоматизирован с помощью инструментов .NET.NET Aspire.
Однако при запуске узла приложения из командной строки вы получите страницу входа. В окне консоли отображается URL-адрес, который можно выбрать, чтобы открыть панель мониторинга в браузере.

URL-адрес содержит строку запроса маркера (со значением маркера, сопоставленным с частью имени t), которая используется для входа в панели мониторинга. Если консоль поддерживает ее, вы можете сохранить клавишу CTRL
страница входа на панель мониторинга 
Страница входа принимает маркер и предоставляет полезные инструкции по получению маркера, как показано на следующем снимке экрана:

После копирования маркера из консоли и вставки его на страницу входа нажмите кнопку Войти в систему.

Панель мониторинга сохраняет маркер в виде постоянного cookieбраузера, который остается действительным в течение трех дней. Постоянные файлы cookie имеют дату окончания срока действия и остаются действительными даже после закрытия браузера. Это означает, что пользователям не нужно снова входить в систему, если они закрывают и повторно открывают браузер. Дополнительные сведения см. в рекомендациях по обеспечению безопасности для запуска .NET.NET Aspire информационной панели документации.
Страница ресурсов
Страница ресурсов
- apiservice: внутренний проект API, созданный с помощью минимальных API.
- веб-интерфейс: проект интерфейсного пользовательского интерфейса, созданный с помощью Blazor.
Панель мониторинга также предоставляет основные сведения о каждом ресурсе:
- тип: отображает, является ли ресурс проектом, контейнером или исполняемым файлом.
- Имя: имя ресурса.
-
состояние: отображает, запущен ли ресурс в данный момент.
ошибки : в столбце состоянияошибки отображаются в виде значка с числом ошибок. Полезно быстро понять, какие ресурсы сообщают об ошибках. При выборе значка вы перейдете в семантические журналы для этого ресурса с фильтром на уровне ошибок.
- время начала: когда ресурс запущен.
- источник: расположение ресурса на устройстве.
- конечных точек: один или несколько URL-адресов для прямого доступа к работающему ресурсу.
- журналы: ссылка на страницу журналов ресурсов.
-
Действия: набор действий, которые можно выполнить на ресурсе:
- остановить или запустить: остановить (или запустить) ресурс в зависимости от текущего состояния.
- журналы консоли: перейдите к журналам консоли ресурса.
-
многоточие: подменю с дополнительными действиями, определенными ресурсами:
- просмотр сведений. Просмотр сведений о ресурсе.
- журнал консоли: перейдите к журналам консоли ресурса.
- структурированные журналы: перейдите к структурированным журналам ресурса.
- трассировки: перейдите к трассировкам ресурса.
- метрик: перейдите к метрикам ресурса.
- перезапуск: остановите и запустите ресурс.
Рассмотрим следующий снимок экрана страницы ресурсов:

Действия с ресурсами
Каждый ресурс имеет набор доступных действий, которые условно включены на основе текущего состояния ресурса. Например, если ресурс запущен, включено действие остановки
Остановка или запуск ресурса
Панель мониторинга .NET.NET Aspire позволяет остановить или запустить ресурс, нажав кнопку Остановить или Запустить в столбце Действия. Рассмотрим следующий снимок экрана: страница ресурсов с выбранной кнопкой "Остановить"

При выборе остановитьресурс перестает работать, а столбец состояние обновляется, чтобы отразить изменение.
Заметка
Для ресурсов проекта, когда отладчик подключен, он повторно подключен при перезапуске.
Затем включена кнопка запуска

Если ресурс находится в состоянии, не выполняющемся, кнопка запуска

Кончик
Ресурсы, зависящие от других ресурсов, которые остановлены или перезапущены, могут возникать временные ошибки. Это ожидаемое поведение и обычно разрешается, когда зависимые ресурсы находятся в состоянии запуска еще раз.
Действия подменю ресурсов
При выборе значка горизонтального многоточия в столбце Действия откроется подменю с дополнительными действиями, зависящими от ресурса. Помимо встроенных действий подменю ресурсов, можно также определить пользовательские действия ресурсов, определив пользовательские команды. Дополнительные сведения см. в разделе Пользовательские команды ресурсов в .NET.NET Aspire. Для встроенных действий подменю ресурсов рассмотрим следующий снимок экрана:

Доступны следующие действия подменю:
- просмотр сведений. Просмотр сведений о ресурсе.
- журнал консоли: перейдите к журналам консоли ресурса.
- структурированные журналы: перейдите к структурированным журналам ресурса.
- трассировки: перейдите к трассировкам ресурса.
- метрик: перейдите к метрикам ресурса.
- перезапуск: остановите и запустите ресурс.
Важный
Могут быть ресурсы с отключенными действиями подменю. Они серые, когда они отключены. Например, на следующем снимок экрана показан отключенные действия подменю:

Копирование или открытие в визуализаторе текста
Чтобы просмотреть визуализатор текста определенных столбцов, наведите указатель мыши на значок вертикального многоточия. Выберите значок, чтобы отобразить доступные параметры:
- Копирование в буфер обмена
- Открыть визуализатор текста
Рассмотрим следующий снимок экрана: параметры меню с многоточием:

При выборе параметра Открыть в текстовом визуализаторе откроется модальное диалоговое окно с текстом, отображаемым в большом формате. Рассмотрим следующий снимок экрана модального диалогового окна визуализатора текста:

Некоторые значения форматируются как JSON или XML. В этих случаях визуализатор текста позволяет раскрывающемся списку выбрать формат
Сведения о ресурсе
Полные сведения о каждом ресурсе можно получить, нажав кнопку с многоточием в столбце действий

Панель поиска в правом верхнем углу панели мониторинга также предоставляет возможность отфильтровать список, который полезен для .NET.NET Aspire проектов с большим количеством ресурсов. Чтобы выбрать отображаемые типы ресурсов, щелкните стрелку слева от текстового поля фильтра:
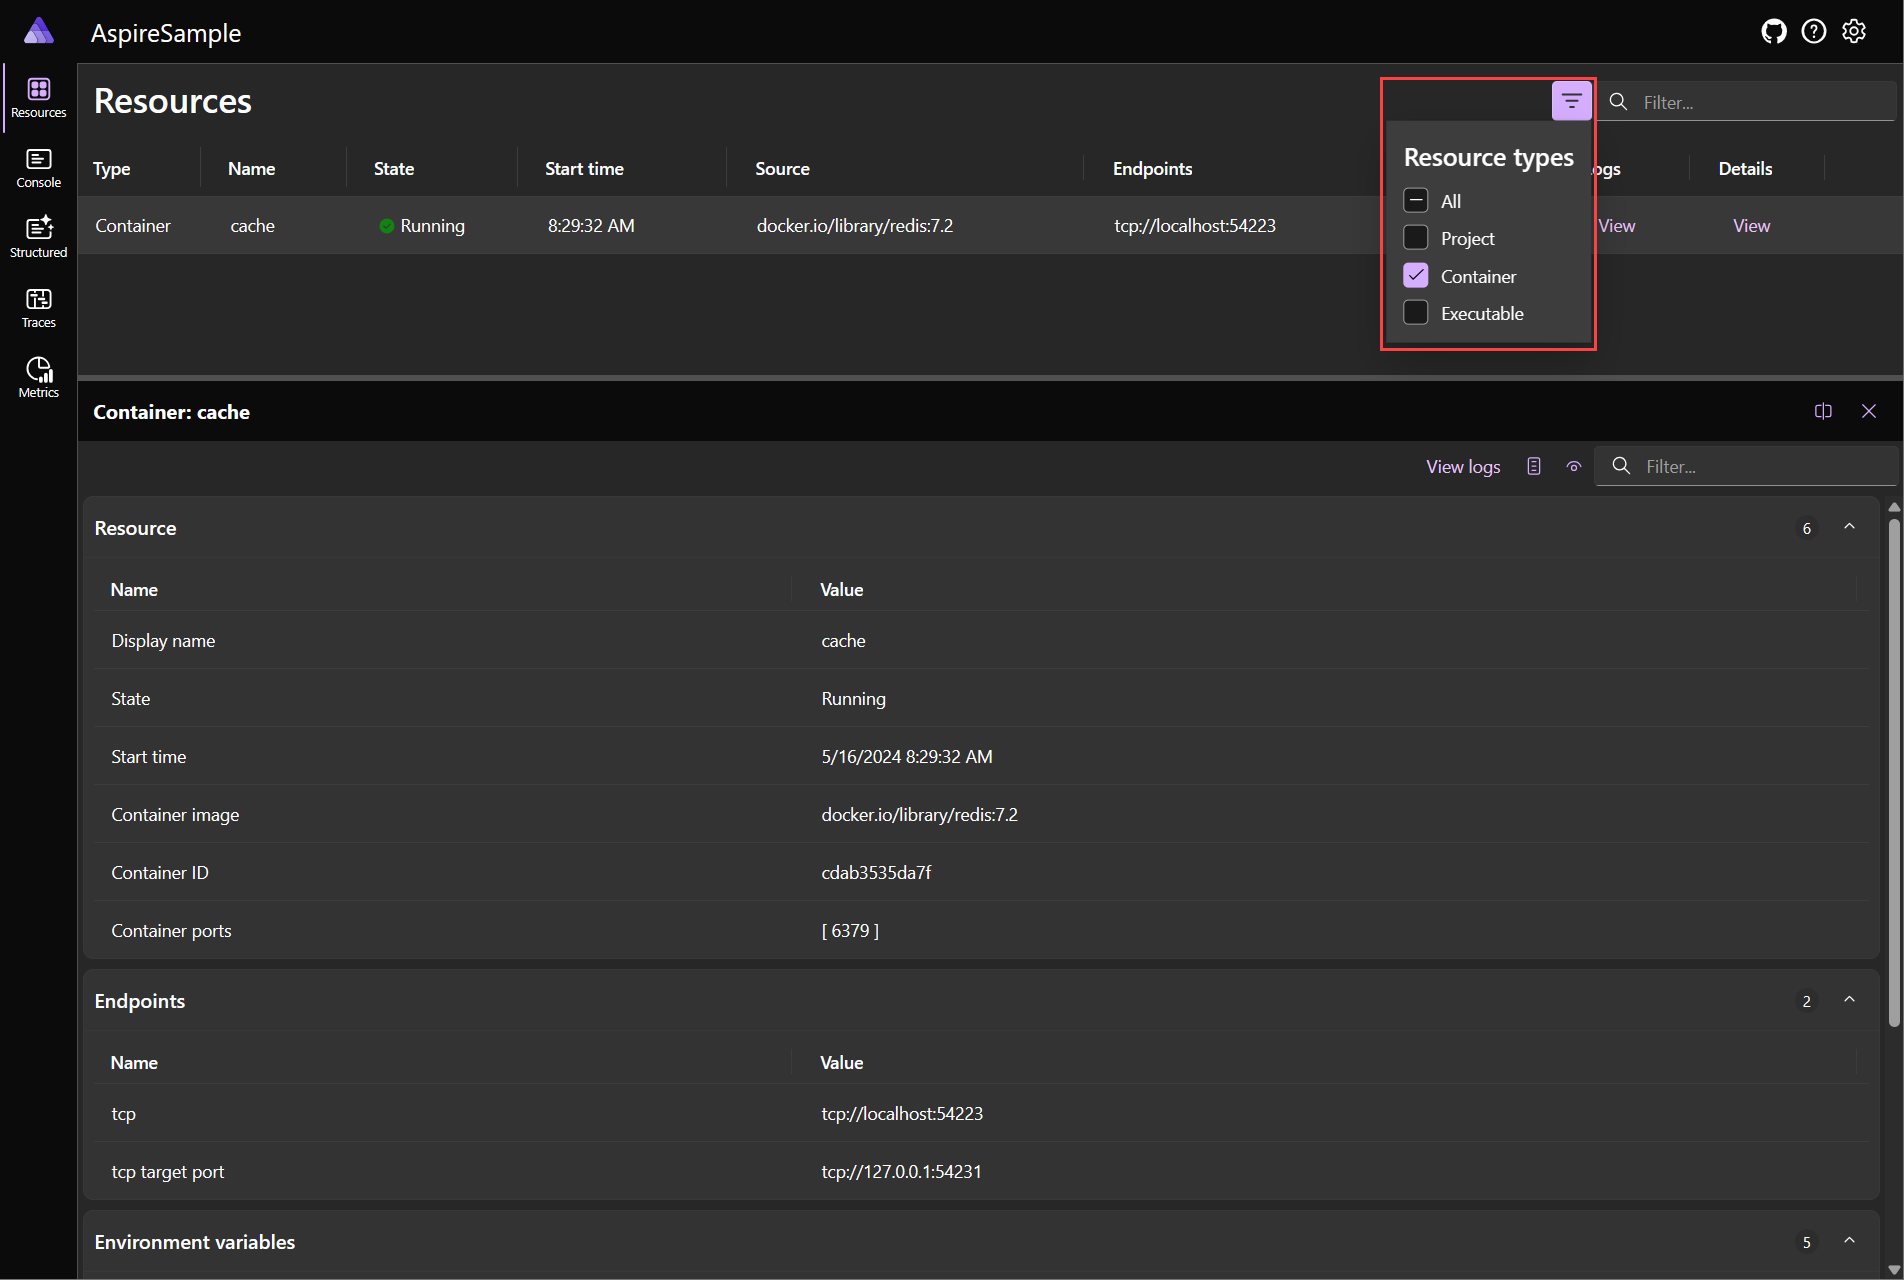
В этом примере в списке отображаются только контейнеры. Например, если включить использовать Redis для кэширования при создании проекта .NET Aspire, появится список контейнеров Redis:

Исполняемые файлы являются автономными процессами. Вы можете настроить проект .NET.NET Aspire для запуска автономного исполняемого файла во время запуска, хотя начальные шаблоны по умолчанию не включают исполняемые файлы по умолчанию.
На следующем снимках экрана показан пример проекта с ошибками:

При выборе значка счетчика ошибок перейдите на страницу структурированных журналов

Чтобы просмотреть запись журнала подробно для ошибки, нажмите кнопку Просмотреть, чтобы открыть окно под списком со сведениями о структурированной записи журнала:

Дополнительные сведения и примеры структурированных журналов см. на странице структурированных журналов.
Заметка
Страница ресурсов недоступна, если панель мониторинга запущена без настроенной службы ресурсов. Панель мониторинга запускается на странице структурированных журналов. Это интерфейс по умолчанию при запуске панели мониторинга в автономном режиме без дополнительной настройки.
Дополнительные сведения о настройке службы ресурсов см. в конфигурации панели мониторинга.
Страницы мониторинга
Панель мониторинга .NET.NET Aspire предоставляет различные способы просмотра журналов, трассировок и метрик для приложения. Эта информация позволяет отслеживать поведение и производительность приложения и диагностировать возникающие проблемы.
Страница журналов консоли
На странице консоли отображается текст, который каждый ресурс в приложении отправил в стандартные выходные данные. Журналы — это полезный способ мониторинга работоспособности приложения и диагностики проблем. Журналы отображаются по-разному в зависимости от источника, например проекта, контейнера или исполняемого файла.
При открытии страницы журналов консоли необходимо выбрать источник в раскрывающемся списке Выбрать ресурс.
При выборе проекта динамические журналы отрисовываются с стилизованным набором цветов, которые соответствуют серьезности журнала; зеленый цвет для сведений в качестве примера. Рассмотрим следующий пример снимка экрана журналов проекта с выбранным проектом apiservice:

При возникновении ошибок они стильируются в журналах, так что их легко определить. Рассмотрим следующий пример снимка экрана журналов проекта с ошибками:

Если выбрать контейнер или исполняемый файл, форматирование отличается от проекта, но подробные сведения о поведении по-прежнему доступны. Рассмотрим следующий пример снимка экрана журнала контейнеров с выбранным контейнером cache:

Реплики ресурсов
При репликации ресурсов проекта с помощью API WithReplicas они представлены в селекторе ресурсов под записью с именем верхнего уровня с значком для индикатора. Каждый реплицированный ресурс указан в записи ресурса верхнего уровня с соответствующим уникальным именем. Рассмотрим следующий пример снимка экрана с реплицированным ресурсом проекта:
панель мониторинга 
На предыдущем снимках экрана показан проект catalogservice (application) с двумя репликами, catalogservice-2bpj2qdq6k и catalogservice-6ljdin0hc0. Каждая реплика имеет собственный набор журналов, которые можно просмотреть, выбрав имя реплики.
Страница структурированных журналов
.NET Aspire автоматически настраивает проекты с ведением журнала с помощью OpenTelemetry. Перейдите на страницу структурированных журналов, чтобы просмотреть семантические журналы проекта .NET.NET Aspire. семантическое или структурированное ведение журнала упрощает хранение и запрос событий журнала, так как сохраняются сообщения журнала и параметры сообщения, а не просто преобразуются в форматированное сообщение. Вы заметили чистую структуру для различных журналов, отображаемых на странице с помощью столбцов:
- ресурс: ресурс, из которого был создан журнал.
- уровень: уровень журнала записи, например сведения, предупреждение или ошибка.
- метка времени: время возникновения журнала.
- сообщение: сведения о журнале.
- трассировки: ссылка на соответствующую трассировку для журнала, если применимо.
- сведения: дополнительные сведения или метаданные о записи журнала.
Рассмотрим следующий пример снимка экрана семантических журналов:

Фильтрация структурированных журналов
Страница структурированных журналов также предоставляет панель поиска для фильтрации журналов по уровню или сообщению. Раскрывающийся список уровня
Рассмотрим следующие снимки экрана со структурированными журналами, отфильтрованные для отображения элементов с надписью "Размещение" в тексте сообщения:

Страница трассировки
Перейдите на страницу трассировки
- метка времени: после завершения трассировки.
- имя: имя трассировки, префикс с именем проекта.
- охватывает: ресурсы, участвующие в запросе.
- длительность: время выполнения запроса. Этот столбец содержит радиальный значок, иллюстрирующий длительность запроса по сравнению с другими в списке.

Фильтрация трассировок
Страница трассировки также предоставляет панель поиска для фильтрации трассировок по имени или диапазону. Примените фильтр и обратите внимание, что результаты трассировки обновляются немедленно. Рассмотрим следующий снимок экрана трассировки с фильтром, примененным к weather, и обратите внимание на то, как в результатах выделен термин поиска:

При фильтрации трассировок в диалоговом окне http.route:

Объединение данных телеметрии из нескольких ресурсов
Если ресурс содержит несколько реплик, можно отфильтровать данные телеметрии для просмотра данных из всех экземпляров одновременно. Выберите родительский ресурс, помеченный (application), как показано на следующем снимке экрана:
 ресурса
После выбора родительского ресурса страница трассировки отображает данные телеметрии из всех экземпляров ресурса.
Сведения о трассировки
Страница сведений о трассировки содержит различные сведения, относящиеся к запросу, в том числе:
- сведения о трассировки: при запуске трассировки.
- длительность: время выполнения запроса.
- ресурсы: количество ресурсов, участвующих в запросе.
- глубины: количество слоев, участвующих в запросе.
- общее количество диапазонов: общее количество диапазонов, участвующих в запросе.
Каждый диапазон представлен в виде строки в таблице и содержит имя. Диапазоны также отображают значок ошибки, если произошла ошибка в определенном диапазоне трассировки. Диапазоны с типом клиента или потребителя, но не имеют диапазона на сервере, отображают значок со стрелкой и целевой адрес. Это представляет вызов клиента к системе за пределами проекта .NET.NET Aspire. Например, HTTP-запрос внешнего веб-API или вызов базы данных.
На странице сведений о трассировки есть кнопка Просмотреть журналы, которая отправляет вас на страницу структурированных журналов с фильтром, примененным для отображения только журналов, относящихся к запросу. Рассмотрим пример снимка экрана со страницей структурированных журналов с фильтром, примененным для отображения только журналов, относящихся к трассировки:

Страница структурированных журналов подробно рассматривается на странице структурированных журналов.
Примеры трассировки
Каждая трассировка имеет цвет, который создается для различения диапазонов — по одному цвету для каждого ресурса. Цвета отражаются как на странице трассировки
Вы также можете выбрать кнопку Просмотреть, чтобы перейти к подробному представлению запроса и продолжительности времени, затраченного на перемещение по каждому уровню приложений. Рассмотрим пример выбора трассировки для просмотра сведений о ней:

Для каждого диапазона трассировки выберите Просмотреть, чтобы просмотреть дополнительные сведения:

Прокрутите вниз в сведениях о диапазоне, чтобы увидеть полную информацию. В нижней части области сведений о диапазоне некоторые типы диапазонов, например этот вызов кэша, отображают время события диапазона:

При наличии ошибок страница отображает значок ошибки рядом с именем трассировки. Рассмотрим пример снимка экрана трассировок с ошибками:

И соответствующее подробное представление трассировки с ошибками:

Страница метрик
Перейдите на страницу метрик
Каждый проект публикации метрик в приложении имеет собственные метрики. На странице метрик отображается область выбора для каждого счетчика верхнего уровня и соответствующие инструменты, которые можно выбрать для просмотра метрики.
Рассмотрим следующий пример снимка экрана страницы метрик с выбранным проектом webfrontendSystem.Net.Http и выбранной метрикой http.client.request.duration счетчика http.client.request.duration:

Помимо диаграммы метрик, страница метрик включает параметр для просмотра данных в виде таблицы. Рассмотрим следующий снимок экрана страницы метрик с выбранным представлением таблицы:

На диаграмме есть список фильтров, которые можно применить, чтобы сосредоточиться на интересующих вас данных. Например, на следующем снимке экрана поле

Вы также можете выбрать количество отображаемой метрики на вертикальном доступе вместо значений:

Дополнительные сведения о метриках см. в встроенных метрик в .NET.
Экземпляров
Панель мониторинга .NET Aspire поддерживает и отображает OpenTelemetryпримеры. Пример связывает точку данных метрик с операцией, которая записала ее, выступая в качестве моста между метриками и трассировками.
Примеры полезны, так как они предоставляют дополнительный контекст о том, почему было записано определенное значение метрик. Например, если вы заметили всплеск задержки в метрике http.client.request.duration, пример может указывать на определенную трассировку или диапазон, который вызвал пик, помогая понять первопричину.
Примеры отображаются на диаграмме метрик как небольшая круглая точка рядом с точкой данных. При наведении указателя на индикатор подсказка отображает примерные сведения, как показано на следующем снимке экрана:
панель мониторинга 
На предыдущем снимку экрана показаны примеры сведений о метриках http.client.request.duration. Примеры включают следующие сведения:
- Имя ресурса.
- Операция выполнена, в этом случае HTTP GET в
/catalog/images/{id}. - Соответствующее значение и метка времени.
При выборе примера индикатора откроется страница сведений о трассировки, где можно просмотреть связанную трассировку, например на следующем снимок экрана:

Дополнительные сведения см. в OpenTelemetry документации: примеры.
Выбор темы
По умолчанию для темы задана системная тема. Это означает, что панель мониторинга использует ту же тему, что и операционная система. Вы также можете выбрать Свет или темную тему, чтобы переопределить системную тему. Выбор темы сохраняется.
На следующем снимка экрана показан диалоговое окно выбора темы с выбранной по умолчанию системной темой:

Если вы предпочитаете тему Light, ее можно выбрать в диалоговом окне выбора темы:

Сочетания клавиш панели мониторинга
Панель мониторинга

Доступны следующие сочетания клавиш:
панели
- +: увеличьте размер панели.
- -: уменьшение размера панели.
- Shift + r: Rразмер панели eset.
- Shift + t: ориентация панелиoggle.
- Shift + x: закрыть панель.
навигациястраницы
- r: перейдите к R.
- c: перейдите к Console Logs.
- : перейдите к Sусеченным журналам.
- t: перейдите к Tгонкам.
- м: перейдите к M.
навигации на уровне сайта:
- ?: справку.
shift : перейдите к S
Дальнейшие действия
.NET Aspire