Tutorial: Format a report (Reporting Services)
After you add the table to your report, you use SQL Server Data Tools (SSDT) to format the date field, currency field, and the column headers in the Sales Orders report.
In this tutorial, you:
- Format the date field to display only the date.
- Format the currency field to display as currency.
- Change text style and adjust column widths.
Prerequisites
- Completion of Step 1: Create a report server project.
- Completion of Step 2: Specify connection information.
- Completion of Step 3: Define a dataset for the table report.
- Completion of Step 4: Add a table to the report.
Format the date
The [Date] field expression displays date and time information by default. You can format it to display only the date.
Open your Sales Order report definition file (.rdl) in Visual Studio.
On the Design tab, right-click the cell with the
[Date]field expression and then select Text Box Properties.Select Number, and then choose Date from the Category box.
In the Type box, select January 31, 2000.
Select OK.
Preview the report to see the change to the
[Date]field formatting, and then go back to the Design tab.
Format the currency
The [LineTotal] field expression displays a general number. You can format the field to display the number as currency.
Right-click the cell with the
[LineTotal]expression, and select Text Box Properties.Select Number, and then choose Currency from the Category list box.
If your regional setting is English (United States), the defaults in the Type list box are:
- Decimal places: 2
- Negative numbers: ($12345.00)
- Symbol: $ English (United States)
Select Use 1000 separator (,). If the sample text displays $12,345.00, then your settings are correct.
Select OK.
Preview the report to see the change to the
[LineTotal]expression column and then go back to the Design tab.
Change text style and column widths
You can add other formatting to your report by highlighting the header, and then adjusting the widths of the data columns.
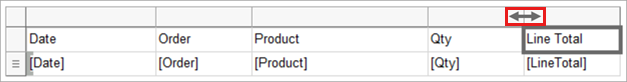
Select the table so that column and row handles appear on the top and side of the table. The gray bars along the top and side of the table are the column and row handles.
Hover over the line between column handles so that the cursor changes into a double arrow. Drag the columns to the size you want.
Highlight the row containing column header labels and then select Format > Font > Bold.
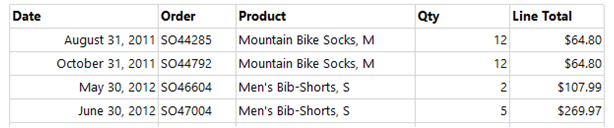
Preview the report on the Preview tab.
Select File > Save All to save the report.
Next step
Обратная связь
Ожидается в ближайшее время: в течение 2024 года мы постепенно откажемся от GitHub Issues как механизма обратной связи для контента и заменим его новой системой обратной связи. Дополнительные сведения см. в разделе https://aka.ms/ContentUserFeedback.
Отправить и просмотреть отзыв по