.NET Aspire metrics sample app
This is a simple .NET app that shows off collecting metrics with OpenTelemetry and exporting them to Prometheus and Grafana for reporting.
Demonstrates
- How to configure a .NET Aspire app to export metrics to Prometheus
- How to add Prometheus and Grafana containers to a .NET Aspire app
- How to configure Prometheus and Grafana to collect and display metrics in the .NET Grafana dashboard
Sample prerequisites
This sample is written in C# and targets .NET 8.0. It requires the .NET 8.0 SDK or later.
Building the sample
To download and run the sample, follow these steps:
- Clone the
dotnet/aspire-samplesrepository. - In Visual Studio (2022 or later):
- On the menu bar, choose File > Open > Project/Solution.
- Navigate to the folder that holds the sample code, and open the solution (.sln) file.
- Right click the MetricsApp.AppHost project in the solution explore and choose it as the startup project.
- Choose the F5 key to run with debugging, or Ctrl+F5 keys to run the project without debugging.
- From the command line:
- Navigate to the folder that holds the sample code.
- At the command line, type
dotnet run.
To run the game, run the .NET Aspire app by executing the following at the command prompt (opened to the base directory of the sample):
dotnet run --project MetricsApp.AppHost
- On the Resources page, click on one of the endpoints for the listed project. This launches the simple .NET app.
- In the .NET app:
- Visit the Weather and Auth Required pages to generate metrics. Values will be captured for
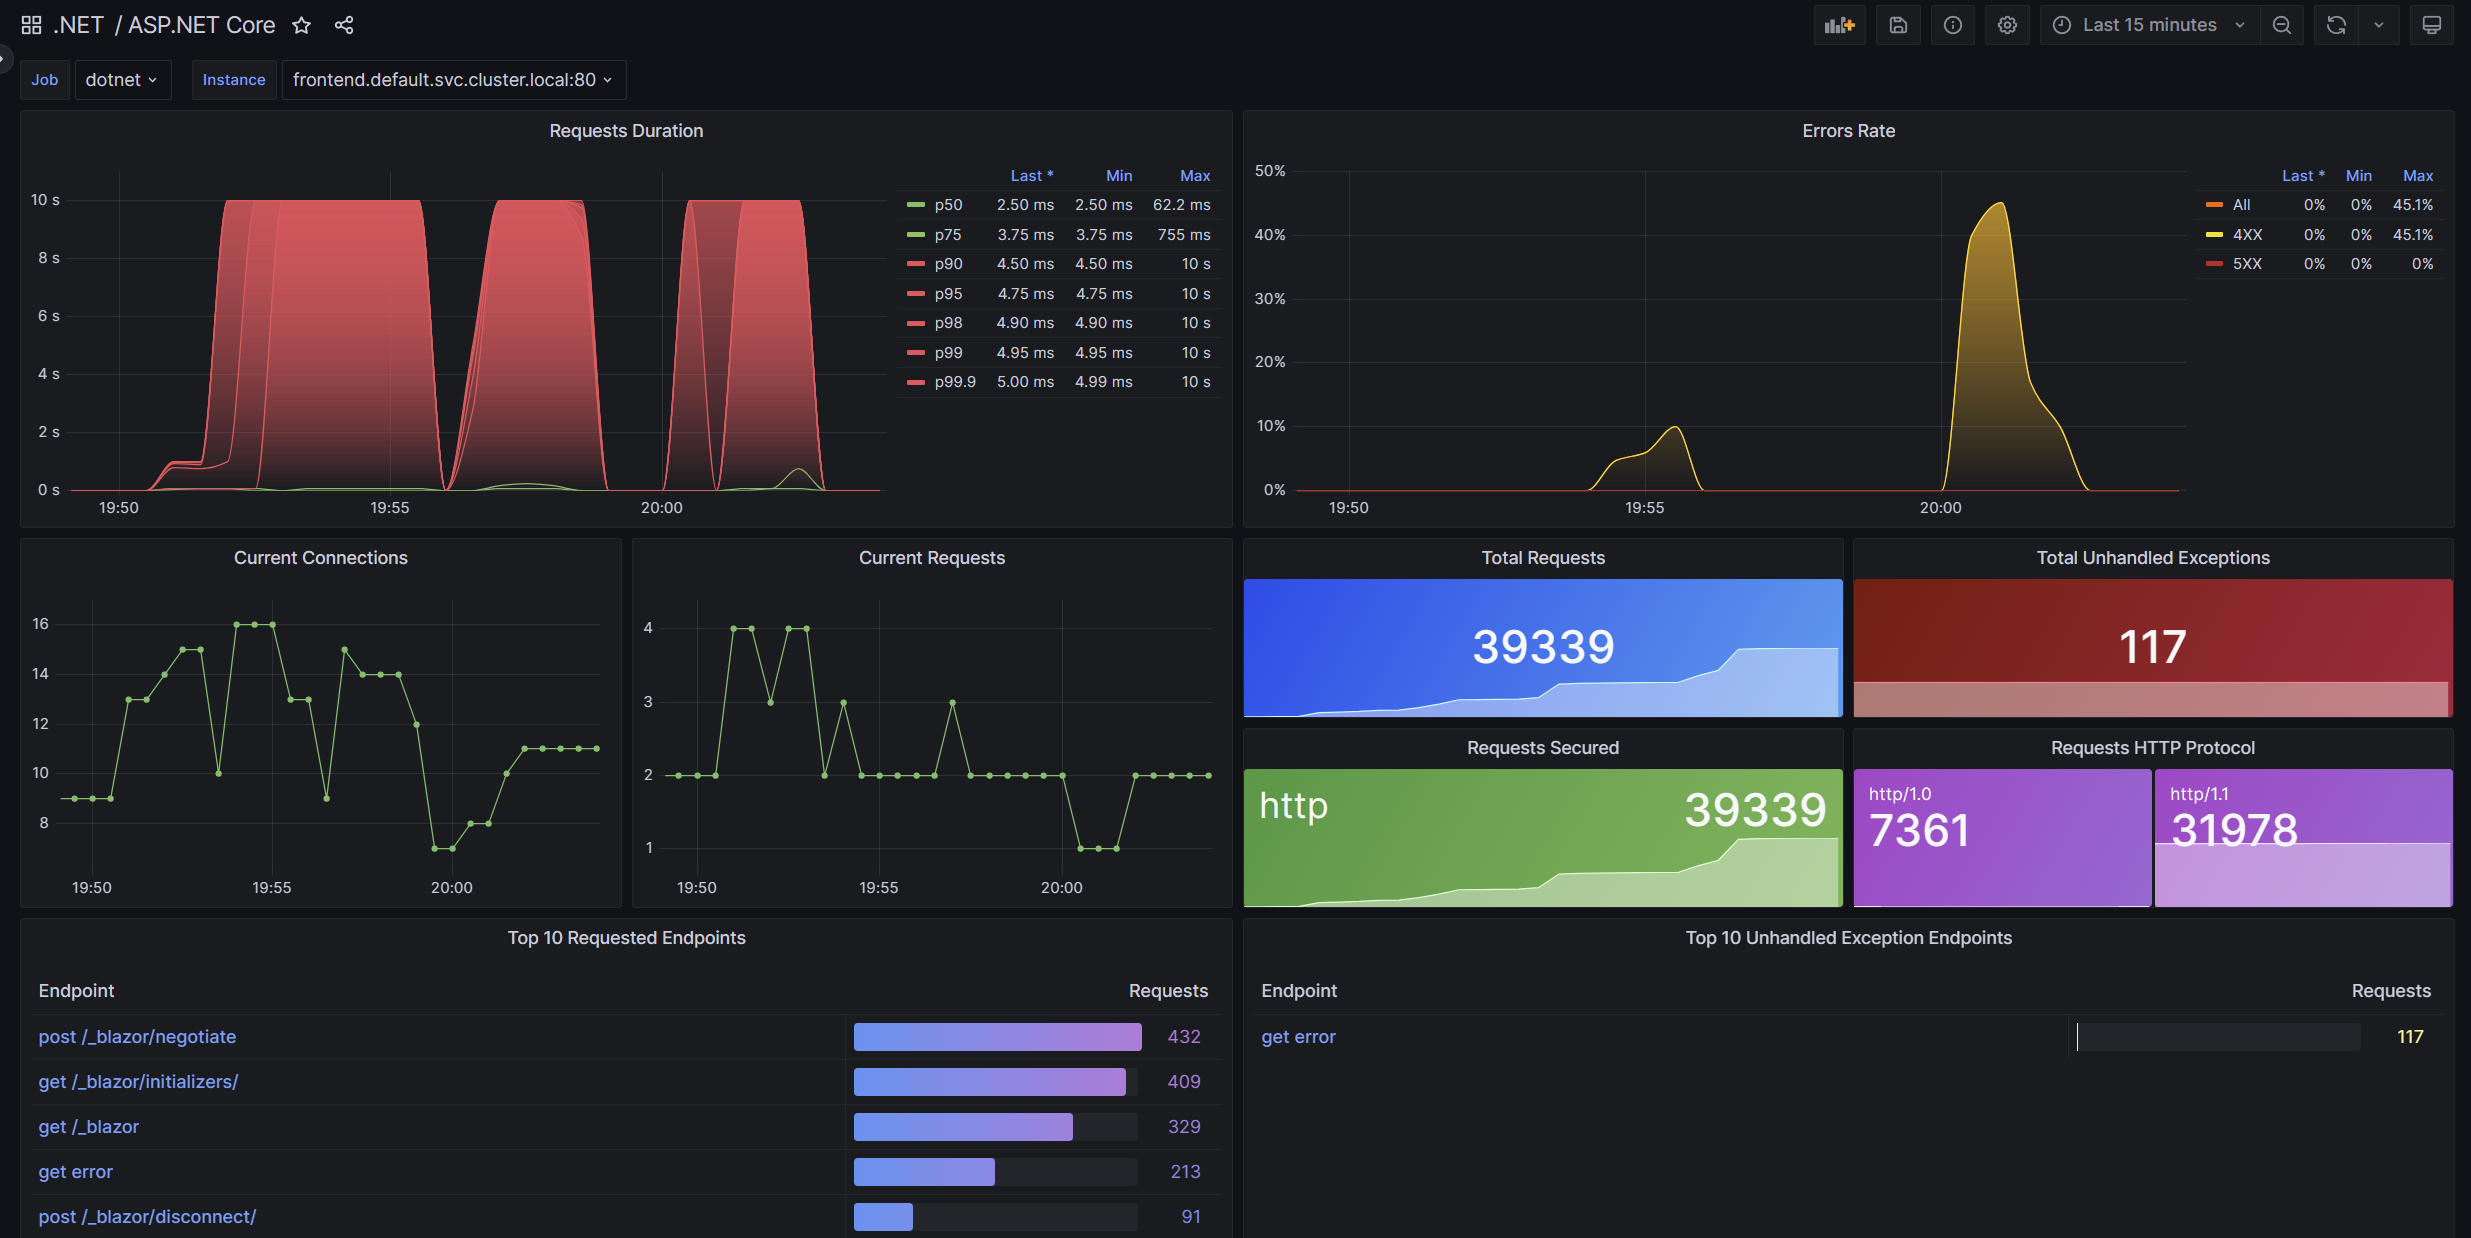
http.server.request.durationand other instruments. - On the Home page, click the Grafana dashboard link. This launches the ASP.NET Core dashboard in Grafana.
- Play around inside the Grafana dashboard:
- Change the time range.
- Enable auto-refresh.
- Click route links to view detailed information about specific areas in the ASP.NET Core app.
For more information about using Grafana dashboards, see the Grafana documentation.