Note
Access to this page requires authorization. You can try signing in or changing directories.
Access to this page requires authorization. You can try changing directories.
Important
Azure Data Studio is retiring on February 28, 2026. We recommend that you use the MSSQL extension for Visual Studio Code. For more information about migrating to Visual Studio Code, visit What's happening to Azure Data Studio?
Applies to: ![]() SQL Server
SQL Server ![]() Azure SQL Database
Azure SQL Database ![]() Azure SQL Managed Instance
Azure SQL Managed Instance
Azure Data Studio supports capturing both estimated and actual query plans. Query plans provide a graphical display of the data retrieval (or modification) method chosen by the SQL Server Query Optimizer. This visual approach helps understand the performance characteristics of a query.
Display - estimated plan
To view the estimated plan for a query, highlight the specific query and select the Estimated Plan button.
Note
If you do not select a query and select the Estimated Plan button, it will display the estimated plans for all queries in the query window.
Display - actual plan
To view the Actual Plan for any query in the editor, select the Enable Actual Plan button or CTRL + M. With this option enabled, executing any query (via the Run button or F5) will result in the actual plan displayed in the Query Plan tab.
Note
If you do not select a query and select Run or F5, it will display the actual plans for all queries in the query window.
Output
When viewing an estimated or actual plan, three tabs are available in addition to the Results and Messages tab. These tabs are Query Plan, Plan Tree, and Top Operations. The Query Plan tab displays the plan(s) and provides multiple menu options, available on the right side menu bar and via the right-click menu. The Plan Tree displays the plan in text format, including sortable columns. The Top Operations pane lists the operators in the plan, and sorting is available to identify the most expensive operators based on different attributes.
Query plan menu options
From the context of a query plan there are multiple options available for further analysis of a plan. These options are accessed by right-clicking anywhere in the plan, or from the right menu bar.
| Icon | Option | Description |
|---|---|---|
|
|
Save Plan File | Save the query plan as a .sqlplan file |
|
|
Show Query Plan XML | View the query plan in XML format in a new window |
|
|
Open Query | Open the plan's query in a new window |
|
|
Zoom In | Zoom in within plan |
|
|
Zoom Out | Zoom out within the plan |
|
|
Zoom to fit | Size the plan to that of the window |
|
|
Custom Zoom | Specify a custom zoom level for the plan |
|
|
Find Node | Search for nodes in a plan based on specific attribute values |
|
|
Properties | Display the properties pane |
|
|
Compare execution plan | Compare the current execution plan to another plan in a new window |
|
|
Highlight expensive operators | Identify the most expensive operator in the plan based on the specified attribute |
|
|
Tooltips | Toggle to enable or disable tooltips when mousing over operators in the plan |
|
|
Top Operations | Switch to the Top Operations pane |
Top operations
Within the Top Operations tab, in addition to sorting columns, the Filter window on the right can be used to find operators with a common field value. For example, it may be helpful to find all Nested Loop operators in a plan that access a specific database object, or filter on specific values for a given attribute.
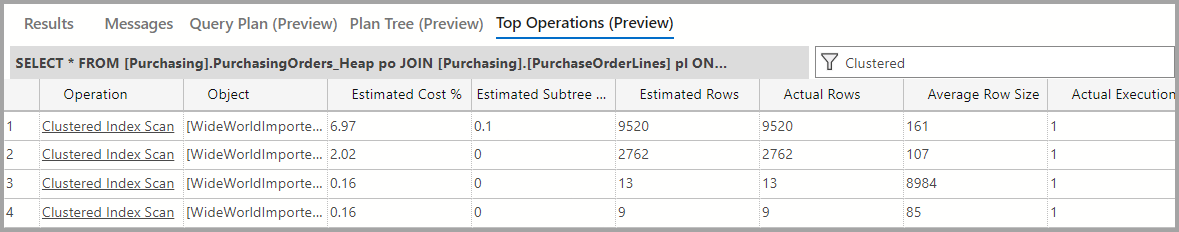
For any operator in the list, select the operator name to jump to that operator's location in the query plan (a green box will surround the operator).
Plan comparison
Comparing query plans can be useful when troubleshooting differences in plan performance, and this can be accomplished in Azure Data Studio by right-clicking on the plan and selecting Compare execution plan. The current plan will open in the top half of a new window, with the Add execution plan button in the bottom half. Select the Add execution plan button and browse out to the saved plan to which you want to compare.

The compare plans menu offers several of the same icons as in the query plan menu, but it also provides the ability to toggle the orientation from a horizontal display to a vertical display, using the Toggle Orientation button. The Properties pane in the plan comparison window provides the ability to review attribute values for an operator from each plan side-by-side. Select the Properties button, then select the operator in each plan to compare. While any operators can be selected, selecting the same operators in similar locations within the plan is typically helpful. The Select operator is one example, but the Index Seek operator is selected in the screenshot below.

The default view of the Properties plan for plan comparison lists attributes with different values at the top, and attributes with the same values are collapsed under the Equivalent Properties heading. This view can be changed using the sort icons, and the attribute lists can be expanded or collapsed to aid in displaying and finding information. The Properties pane also has a filter menu, providing the ability to quickly navigate to the attribute of interest.