Not
Bu sayfaya erişim yetkilendirme gerektiriyor. Oturum açmayı veya dizinleri değiştirmeyi deneyebilirsiniz.
Bu sayfaya erişim yetkilendirme gerektiriyor. Dizinleri değiştirmeyi deneyebilirsiniz.
Bu makalede Power BI görsellerindeki verilerin nasıl vurgulandığı açıklanmaktadır.
Varsayılan olarak, bir öğe seçildiğinde nesnedeki values dataView dizi yalnızca seçili değerleri gösterecek şekilde filtrelenir. values Dizi filtrelendiğinde, sayfadaki diğer tüm görseller yalnızca seçili verileri gösterir.
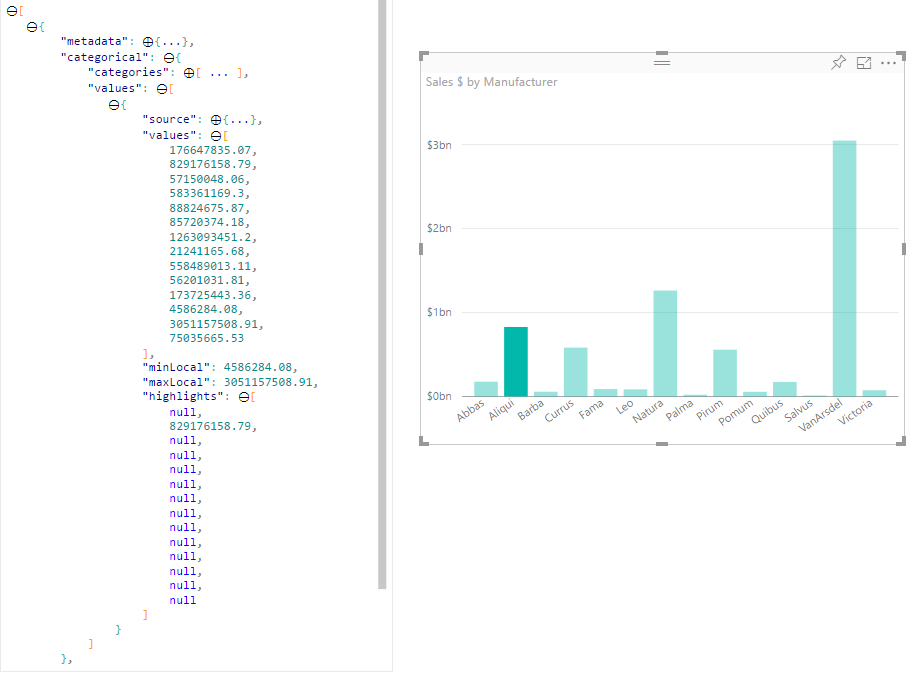
Dosyanızdaki özelliğini olarak trueayarlarsanızsupportsHighlight, diziyle birlikte tam filtrelenmemiş diziyle highlights sonuçlanırvalues.capabilities.json Dizi highlights , değer dizisiyle aynı uzunluktadır ve seçilmemiş değerler olarak nullayarlanır. Bu özellik etkinleştirildiğinde, dizi diziyle highlights karşılaştırılarak values görseldeki uygun veriler vurgulanır.
Örnekte aşağıdakilere dikkat edin:
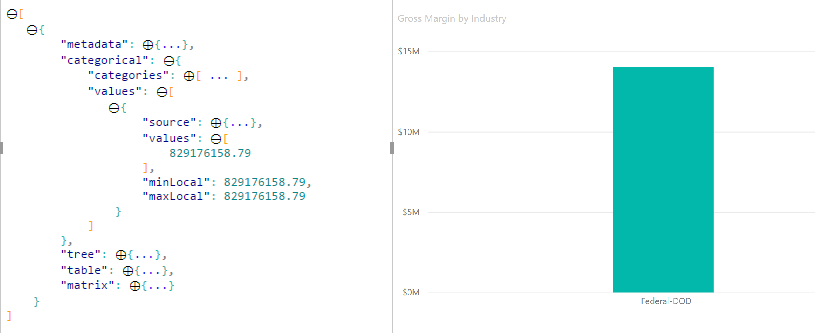
- Vurgu desteği olmadan , seçim dizideki
valuestek değer ve veri görünümünde sunulan tek çubuk olur. - Vurgu desteğiyle , tüm değerler dizide
valuesyer alır. Dizihighlights, vurgulanmayan öğeler için birnulldeğer içerir. Tüm çubuklar veri görünümünde görünür ve vurgulanan çubuk farklı bir renktir.
Birden çok seçim ve kısmi vurgular da olabilir. Vurgulanan değerler veri görünümünde gösterilir.
Not
Tablo veri görünümü eşlemesi, öne çıkanlar özelliğini desteklemez.
Kategorik veri görünümü eşlemesi ile veri noktalarını vurgulama
Kategorik veri görünümü eşlemesi olan görseller için dosyaya capabilities.json ekleyin"supportsHighlight": true. Örneğin:
{
    "dataRoles": [
        {
            "displayName": "Category",
            "name": "category",
            "kind": "Grouping"
        },
        {
            "displayName": "Value",
            "name": "value",
            "kind": "Measure"
        }
    ],
    "dataViewMappings": [
        {
            "categorical": {
                "categories": {
                    "for": {
                        "in": "category"
                    }
                },
                "values": {
                    "for": {
                        "in": "value"
                    }
                }
            }
        }
    ],
    "supportsHighlight": true
}
Gereksiz kodu kaldırdıktan sonra varsayılan görsel kaynak kodu aşağıdaki örneğe benzer:
"use strict";

// ... default imports list

import { FormattingSettingsService } from "powerbi-visuals-utils-formattingmodel";

import DataViewCategorical = powerbi.DataViewCategorical;
import DataViewCategoryColumn = powerbi.DataViewCategoryColumn;
import PrimitiveValue = powerbi.PrimitiveValue;
import DataViewValueColumn = powerbi.DataViewValueColumn;

import { VisualFormattingSettingsModel } from "./settings";

export class Visual implements IVisual {
    private target: HTMLElement;
    private formattingSettings: VisualFormattingSettingsModel;
    private formattingSettingsService: FormattingSettingsService;

    constructor(options: VisualConstructorOptions) {
        console.log('Visual constructor', options);
        this.formattingSettingsService = new FormattingSettingsService();
        this.target = options.element;
        this.host = options.host;
    }

    public update(options: VisualUpdateOptions) {
        this.formattingSettings = this.formattingSettingsService.populateFormattingSettingsModel(VisualFormattingSettingsModel, options.dataViews);
        console.log('Visual update', options);

    }

    // Returns properties pane formatting model content hierarchies, properties and latest formatting values, Then populate properties pane.
    // This method is called once every time we open properties pane or when the user edit any format property.
    public getFormattingModel(): powerbi.visuals.FormattingModel {
        return this.formattingSettingsService.buildFormattingModel(this.formattingSettings);
    }
}
Power BI'dan verileri işlemek için gerekli arabirimleri içeri aktarın:
import DataViewCategorical = powerbi.DataViewCategorical;
import DataViewCategoryColumn = powerbi.DataViewCategoryColumn;
import PrimitiveValue = powerbi.PrimitiveValue;
import DataViewValueColumn = powerbi.DataViewValueColumn;
Kategori değerleri için kök div öğeyi oluşturun:
export class Visual implements IVisual {
    private target: HTMLElement;
    private formattingSettings: VisualFormattingSettingsModel;
    private formattingSettingsService: FormattingSettingsService;

    private div: HTMLDivElement; // new property

    constructor(options: VisualConstructorOptions) {
        console.log('Visual constructor', options);
        this.formattingSettingsService = new FormattingSettingsService();
        this.target = options.element;
        this.host = options.host;

        // create div element
        this.div = document.createElement("div");
        this.div.classList.add("vertical");
        this.target.appendChild(this.div);

    }
    // ...
}
Yeni verileri işlemeden önce div öğelerinin içeriğini temizleyin:
// ...
public update(options: VisualUpdateOptions) {
    this.formattingSettings = this.formattingSettingsService.populateFormattingSettingsModel(VisualFormattingSettingsModel, options.dataViews);
    console.log('Visual update', options);

    while (this.div.firstChild) {
        this.div.removeChild(this.div.firstChild);
    }
    // ...
}
Nesneden dataView kategorileri ve ölçü değerlerini alın:
public update(options: VisualUpdateOptions) {
    this.formattingSettings = this.formattingSettingsService.populateFormattingSettingsModel(VisualFormattingSettingsModel, options.dataViews);
    console.log('Visual update', options);

    while (this.div.firstChild) {
        this.div.removeChild(this.div.firstChild);
    }

    const dataView: DataView = options.dataViews[0];
    const categoricalDataView: DataViewCategorical = dataView.categorical;
    const categories: DataViewCategoryColumn = categoricalDataView.categories[0];
    const categoryValues = categories.values;

    const measures: DataViewValueColumn = categoricalDataView.values[0];
    const measureValues = measures.values;
    const measureHighlights = measures.highlights;
    // ...
}
Burada categoryValues kategori değerleri dizisidir, measureValues ölçü dizisidir ve measureHighlights değerlerin vurgulanan bölümleridir.
Not
Özelliğin değerleri özelliğin measureHighlights değerlerinden categoryValues küçükse, değer kısmen vurgulanmış demektir.
Diziyi numaralandırın categoryValues ve karşılık gelen değerleri ve vurguları alın:
// ...
const measureHighlights = measures.highlights;

categoryValues.forEach((category: PrimitiveValue, index: number) => {
    const measureValue = measureValues[index];
    const measureHighlight = measureHighlights && measureHighlights[index] ? measureHighlights[index] : null;
    console.log(category, measureValue, measureHighlight);

});
Görsel DOM'da veri görünümü değerlerini görüntülemek ve görselleştirmek için ve p öğeleri oluşturundiv:
categoryValues.forEach((category: PrimitiveValue, index: number) => {
    const measureValue = measureValues[index];
    const measureHighlight = measureHighlights && measureHighlights[index] ? measureHighlights[index] : null;
    console.log(category, measureValue, measureHighlight);

    // div element. it contains elements to display values and visualize value as progress bar
    let div = document.createElement("div");
    div.classList.add("horizontal");
    this.div.appendChild(div);

    // div element to visualize value of measure
    let barValue = document.createElement("div");
    barValue.style.width = +measureValue * 10 + "px";
    barValue.style.display = "flex";
    barValue.classList.add("value");

    // element to display category value
    let bp = document.createElement("p");
    bp.innerText = category.toString();

    // div element to visualize highlight of measure
    let barHighlight = document.createElement("div");
    barHighlight.classList.add("highlight")
    barHighlight.style.backgroundColor = "blue";
    barHighlight.style.width = +measureHighlight * 10 + "px";

    // element to display highlighted value of measure
    let p = document.createElement("p");
    p.innerText = `${measureHighlight}/${measureValue}`;
    barHighlight.appendChild(bp);

    div.appendChild(barValue);

    barValue.appendChild(barHighlight);
    div.appendChild(p);
});
kullanmak flexboxüzere öğeler için gerekli stilleri uygulayın ve div öğeleri için renkleri tanımlayın:
div.vertical {
    display: flex;
    flex-direction: column;
}

div.horizontal {
    display: flex;
    flex-direction: row;
}

div.highlight {
    background-color: blue
}

div.value {
    background-color: red;
    display: flex;
}
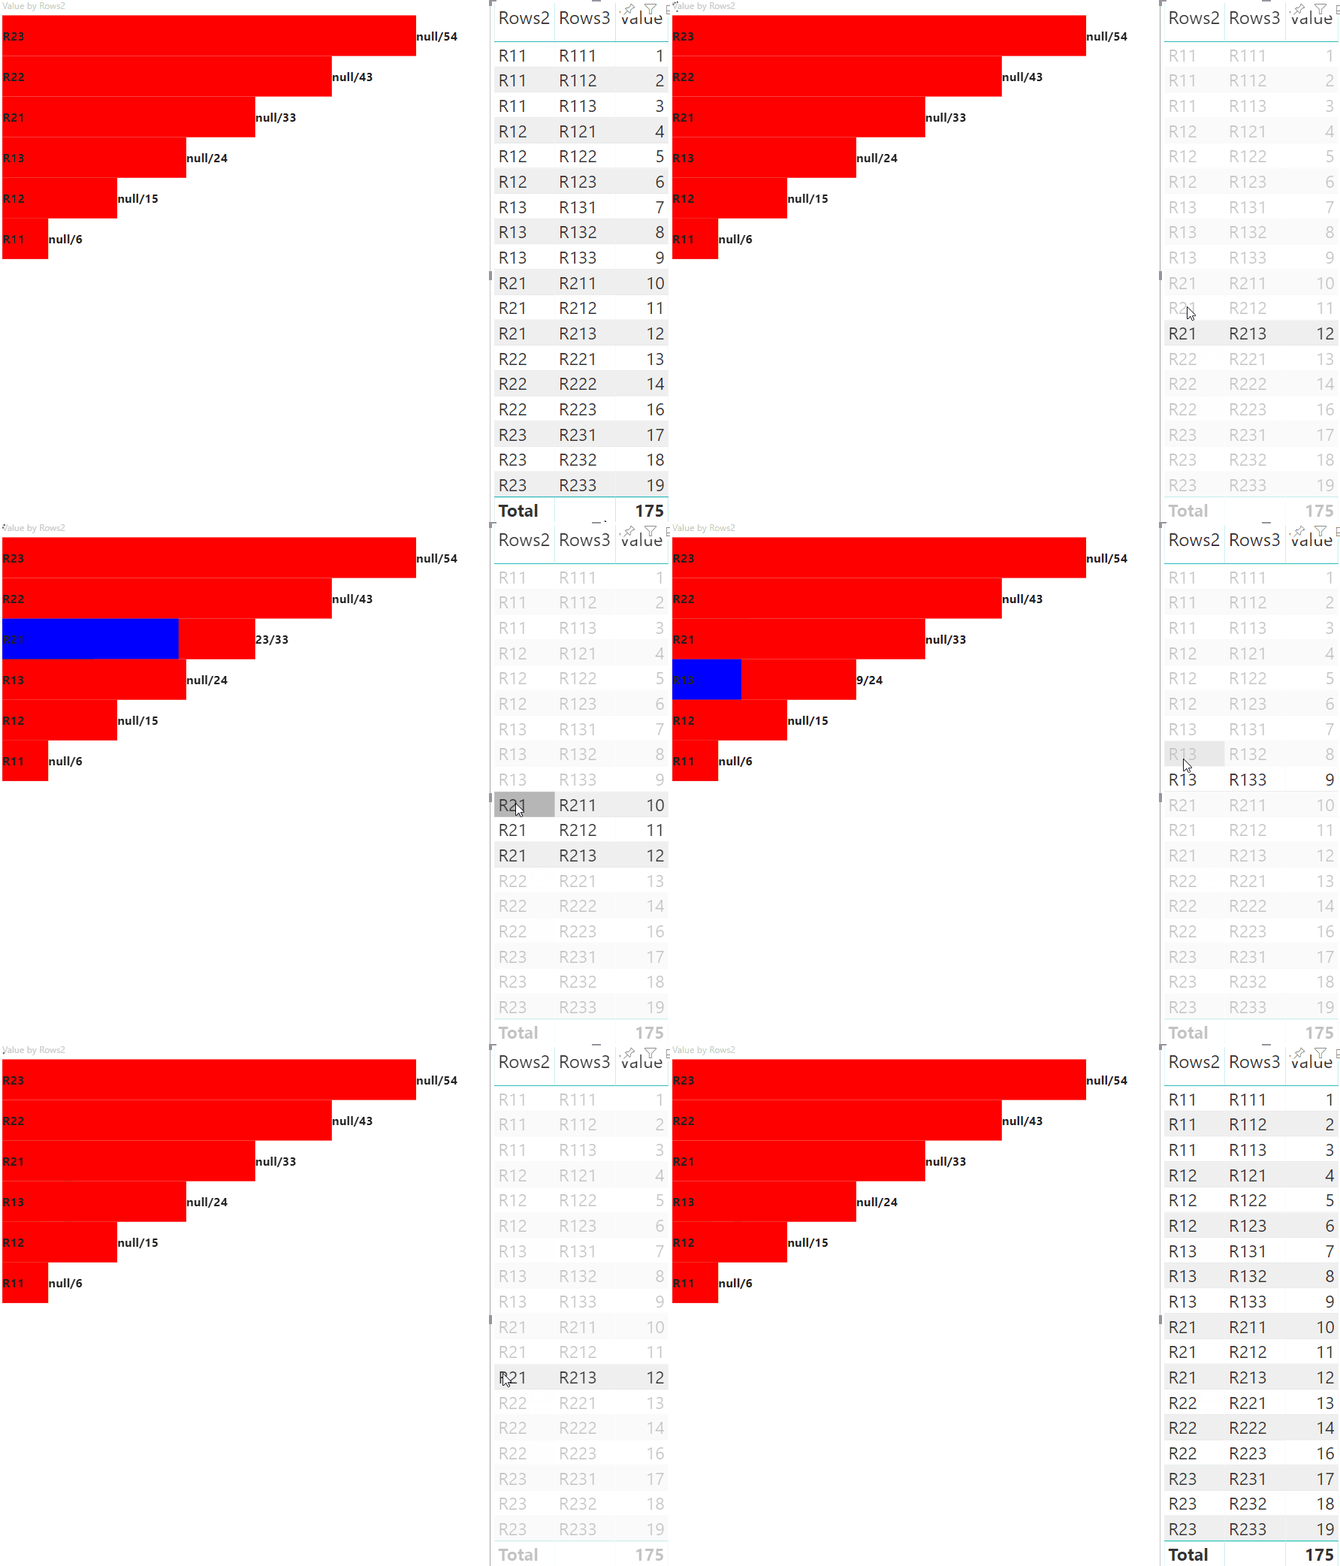
Görselin aşağıdaki görünümü sonucudur:

Matris veri görünümü eşlemesi ile veri noktalarını vurgulama
Matris veri görünümü eşlemesi olan görseller için dosyaya capabilities.json ekleyin"supportsHighlight": true. Örneğin:
{
    "dataRoles": [
        {
            "displayName": "Columns",
            "name": "columns",
            "kind": "Grouping"
        },
        {
            "displayName": "Rows",
            "name": "rows",
            "kind": "Grouping"
        },
        {
            "displayName": "Value",
            "name": "value",
            "kind": "Measure"
        }
    ],
    "dataViewMappings": [
        {
            "matrix": {
                "columns": {
                    "for": {
                        "in": "columns"
                    }
                },
                "rows": {
                    "for": {
                        "in": "rows"
                    }
                },
                "values": {
                    "for": {
                        "in": "value"
                    }
                }
            }
        }
    ],
    "supportsHighlight": true
}
Matris veri görünümü eşlemesi için hiyerarşi oluşturmak için örnek veriler:
| Satır1 | Satır2 | Satır3 | Sütun1 | Sütun2 | Sütun3 | Değerler |
|---|---|---|---|---|---|---|
| R1 | R11 | R111 | C1 | C11 | C111 | 1 |
| R1 | R11 | R112 | C1 | C11 | C112 | 2 |
| R1 | R11 | R113 | C1 | C11 | C113 | 3 |
| R1 | R12 | R121 | C1 | C12 | C121 | 4 |
| R1 | R12 | R122 | C1 | C12 | C122 | 5 |
| R1 | R12 | R123 | C1 | C12 | C123 | 6 |
| R1 | R13 | R131 | C1 | C13 | C131 | 7 |
| R1 | R13 | R132 | C1 | C13 | C132 | 8 |
| R1 | R13 | R133 | C1 | C13 | C133 | 9 |
| R2 | R21 | R211 | C2 | C21 | C211 | 10 |
| R2 | R21 | R212 | C2 | C21 | C212 | 11 |
| R2 | R21 | R213 | C2 | C21 | C213 | 12 |
| R2 | R22 | R221 | C2 | C22 | C221 | 13 |
| R2 | R22 | R222 | C2 | C22 | C222 | 14 |
| R2 | R22 | R223 | C2 | C22 | C223 | 16 |
| R2 | R23 | R231 | C2 | C23 | C231 | 17 |
| R2 | R23 | R232 | C2 | C23 | C232 | 18 |
| R2 | R23 | R233 | C2 | C23 | C233 | 19 |
Varsayılan görsel projeyi oluşturun ve dosyanın örneğini capabilities.json uygulayın.
Gereksiz kodu kaldırdıktan sonra, varsayılan görsel kaynak kodu aşağıdaki örneğe benzer:
"use strict";

// ... default imports

import { FormattingSettingsService } from "powerbi-visuals-utils-formattingmodel";
import { VisualFormattingSettingsModel } from "./settings";

export class Visual implements IVisual {
    private target: HTMLElement;
    private formattingSettings: VisualFormattingSettingsModel;
    private formattingSettingsService: FormattingSettingsService;

    constructor(options: VisualConstructorOptions) {
        console.log('Visual constructor', options);
        this.formattingSettingsService = new FormattingSettingsService();
        this.target = options.element;
        this.host = options.host;
    }

    public update(options: VisualUpdateOptions) {
        this.formattingSettings = this.formattingSettingsService.populateFormattingSettingsModel(VisualFormattingSettingsModel, options.dataViews);
        console.log('Visual update', options);

    }

   /**
     * Returns properties pane formatting model content hierarchies, properties and latest formatting values, Then populate properties pane.
     * This method is called once every time we open properties pane or when the user edit any format property.
     */
    public getFormattingModel(): powerbi.visuals.FormattingModel {
        return this.formattingSettingsService.buildFormattingModel(this.formattingSettings);
    }
}
Power BI'dan verileri işlemek için gerekli arabirimleri içeri aktarın:
import DataViewMatrix = powerbi.DataViewMatrix;
import DataViewMatrixNode = powerbi.DataViewMatrixNode;
import DataViewHierarchyLevel = powerbi.DataViewHierarchyLevel;
Görsel düzeni için iki div öğe oluşturun:
constructor(options: VisualConstructorOptions) {
    // ...
    this.rowsDiv = document.createElement("div");
    this.target.appendChild(this.rowsDiv);

    this.colsDiv = document.createElement("div");
    this.target.appendChild(this.colsDiv);
    this.target.style.overflowY = "auto";
}
Görselin veri aldığından update emin olmak için yöntemindeki verileri denetleyin:
public update(options: VisualUpdateOptions) {
    this.formattingSettings = this.formattingSettingsService.populateFormattingSettingsModel(VisualFormattingSettingsModel, options.dataViews);
    console.log('Visual update', options);

    const dataView: DataView = options.dataViews[0];
    const matrixDataView: DataViewMatrix = dataView.matrix;

    if (!matrixDataView ||
        !matrixDataView.columns ||
        !matrixDataView.rows ) {
        return
    }
    // ...
}
Yeni verileri işlemeden önce öğelerin içeriğini div temizleyin:
public update(options: VisualUpdateOptions) {
    // ...

    // remove old elements
    // to better performance use D3js pattern:
    // https://d3js.org/#enter-exit
    while (this.rowsDiv.firstChild) {
        this.rowsDiv.removeChild(this.rowsDiv.firstChild);
    }
    const prow = document.createElement("p");
    prow.innerText = "Rows";
    this.rowsDiv.appendChild(prow);

    while (this.colsDiv.firstChild) {
        this.colsDiv.removeChild(this.colsDiv.firstChild);
    }
    const pcol = document.createElement("p");
    pcol.innerText = "Columns";
    this.colsDiv.appendChild(pcol);
    // ...
}
treeWalker Matris veri yapısından geçiş yapmak için işlevini oluşturun:
public update(options: VisualUpdateOptions) {
    // ...
    const treeWalker = (matrixNode: DataViewMatrixNode, index: number, levels: DataViewHierarchyLevel[], div: HTMLDivElement)  => {

    }
    // ...
}
Burada matrixNode geçerli düğüm levels , bu hiyerarşi düzeyindeki meta veri sütunlarıdır; div alt HTML öğeleri için üst öğedir.
treeWalker özyinelemeli işlevdir, üst bilgi olarak öğe ve p metin oluşturması div ve düğümün alt öğeleri için işlevini çağırması gerekir:
public update(options: VisualUpdateOptions) {
    // ...
    const treeWalker = (matrixNode: DataViewMatrixNode, index: number, levels: DataViewHierarchyLevel[], div: HTMLDivElement)  => {
        // ...

        if (matrixNode.children) {
            const childDiv = document.createElement("div");
            childDiv.classList.add("vertical");
            div.appendChild(childDiv);

            const p = document.createElement("p");
            const level = levels[matrixNode.level]; // get current level column metadata from current node
            p.innerText = level.sources[level.sources.length - 1].displayName; // get column name from metadata

            childDiv.appendChild(p); // add paragraph element to div element
            matrixNode.children.forEach((node, index) => treeWalker(node, levels, childDiv, ++levelIndex));
        }
    }
    // ...
}
Matris veri görünümü yapısının sütun ve satırının kök öğeleri için işlevini çağırın:
public update(options: VisualUpdateOptions) {
    // ...
    const treeWalker = (matrixNode: DataViewMatrixNode, index: number, levels: DataViewHierarchyLevel[], div: HTMLDivElement)  => {
        // ...
    }
    // ...
    // remove old elements
    // ...

    // ...
    const rowRoot: DataViewMatrixNode = matrixDataView.rows.root;
    rowRoot.children.forEach((node) => treeWalker(node, matrixDataView.rows.levels, this.rowsDiv));

    const colRoot = matrixDataView.columns.root;
    colRoot.children.forEach((node) => treeWalker(node, matrixDataView.columns.levels, this.colsDiv));
}
Düğümler için selectionID ve düğümleri görüntülemek için Oluştur düğmeleri oluşturun:
public update(options: VisualUpdateOptions) {
    // ...
    const treeWalker = (matrixNode: DataViewMatrixNode, index: number, levels: DataViewHierarchyLevel[], div: HTMLDivElement)  => {
        const selectionID: ISelectionID = this.host.createSelectionIdBuilder()
            .withMatrixNode(matrixNode, levels)
            .createSelectionId();

        let nodeBlock = document.createElement("button");
        nodeBlock.innerText = matrixNode.value.toString();

        nodeBlock.addEventListener("click", (event) => {
            // call select method in the selection manager
            this.selectionManager.select(selectionID);
        });

        nodeBlock.addEventListener("contextmenu", (event) => {
            // call showContextMenu method to display context menu on the visual
            this.selectionManager.showContextMenu(selectionID, {
                x: event.clientX,
                y: event.clientY
            });
            event.preventDefault();
        });
        // ...
    }
    // ...
}
Vurgulamanın ana adımı başka bir değer dizisi oluşturmaktır.
Terminal düğümünün nesnesi, value ve highlight değerleri dizisi için iki özelliğe sahiptir:
JSON.stringify(options.dataViews[0].matrix.rows.root.children[0].children[0].children[0], null, " ");
{
 "level": 2,
 "levelValues": [
  {
   "value": "R233",
   "levelSourceIndex": 0
  }
 ],
 "value": "R233",
 "identity": {
  "identityIndex": 2
 },
 "values": {
  "0": {
   "value": null,
   "highlight": null
  },
  "1": {
   "value": 19,
   "highlight": 19
  }
 }
}
Burada value , diğer görselden seçim uygulamadan düğümün değerini temsil eder, highlight verilerin hangi bölümünün vurgulandığını gösterir.
Not
değerinin highlight değeri değerinden valuevalue küçükse, kısmen vurgulanmış demektir.
Sunulan düğümün values dizisini işlemek için kod ekleyin:
public update(options: VisualUpdateOptions) {
    // ...
    const treeWalker = (matrixNode: DataViewMatrixNode, index: number, levels: DataViewHierarchyLevel[], div: HTMLDivElement)  => {
        // ...

        if (matrixNode.values) {
            const sumOfValues = Object.keys(matrixNode.values) // get key property of object (value are 0 to N)
                .map(key => +matrixNode.values[key].value) // convert key property to number
                .reduce((prev, curr) => prev + curr) // sum of values

            let sumOfHighlights = sumOfValues;
            sumOfHighlights = Object.keys(matrixNode.values) // get key property of object (value are 0 to N)
                .map(key => matrixNode.values[key].highlight ? +matrixNode.values[key].highlight : null ) // convert key property to number if it exists
                .reduce((prev, curr) => curr ? prev + curr : null) // convert key property to number

            // create div container for value and highlighted value
            const vals = document.createElement("div");
            vals.classList.add("vertical")
            vals.classList.replace("vertical", "horizontal");
            // create paragraph element for label
            const highlighted = document.createElement("p");
            // Display complete value and highlighted value
            highlighted.innerText = `${sumOfHighlights}/${sumOfValues}`;

            // create div container for value
            const valueDiv = document.createElement("div");
            valueDiv.style.width = sumOfValues * 10 + "px";
            valueDiv.classList.add("value");

            // create div container for highlighted values
            const highlightsDiv = document.createElement("div");
            highlightsDiv.style.width = sumOfHighlights * 10 + "px";
            highlightsDiv.classList.add("highlight");
            valueDiv.appendChild(highlightsDiv);

            // append button and paragraph to div containers to parent div
            vals.appendChild(nodeBlock);
            vals.appendChild(valueDiv);
            vals.appendChild(highlighted);
            div.appendChild(vals);
        } else {
            div.appendChild(nodeBlock);
        }

        if (matrixNode.children) {
            // ...
        }
    }
    // ...
}
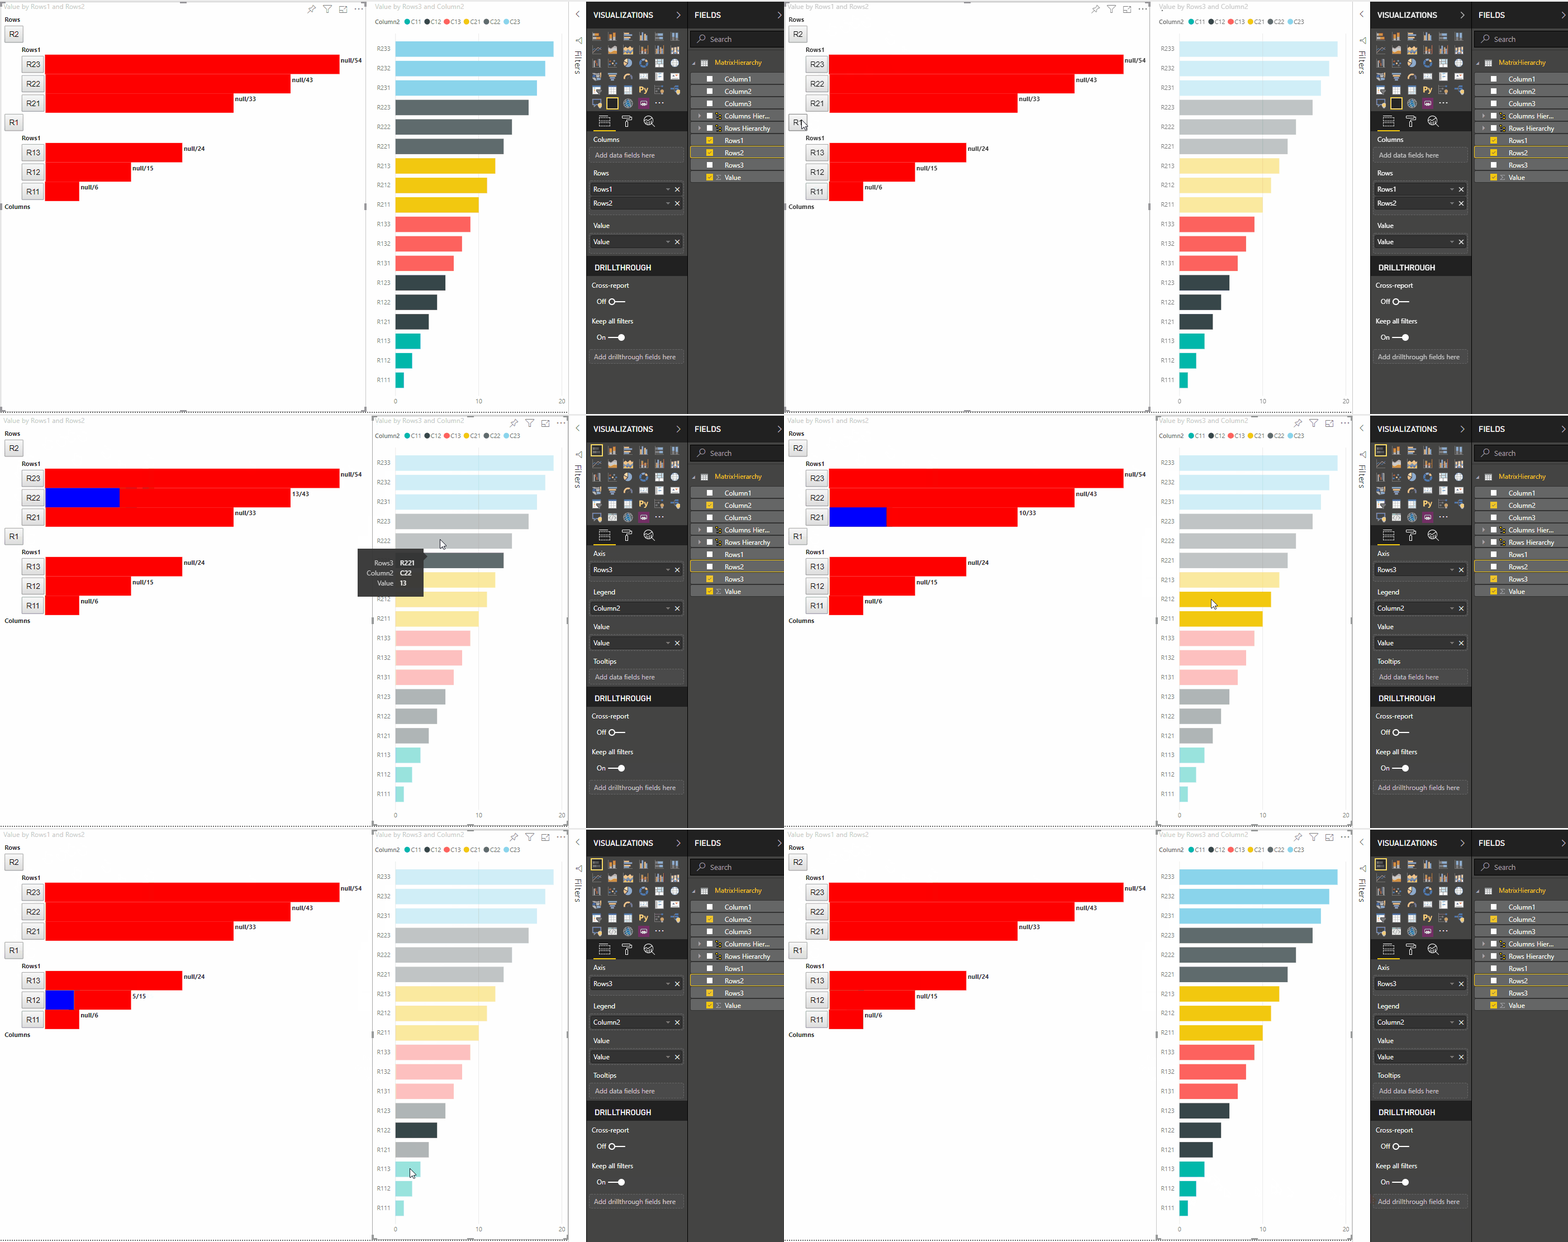
Sonuç olarak highlighted value/default valuedüğmeleri ve değerleri olan bir görsel elde edilir.


