Microsoft 365 Reports in the admin center - Microsoft 365 groups
The Microsoft 365 Reports dashboard shows you the activity overview across the products in your organization. It enables you to drill in to individual product level reports to give you more granular insight about the activities within each product. Check out the Reports overview topic. In the Microsoft 365 groups report, you can gain insights into the activity of groups in your organization and see how many groups are being created and used.
How to get to the groups report
In the admin center, select Reports, and then select Usage.
From the dashboard homepage, under Reports, select Microsoft 365 apps then Groups activity to get to the Office 365 report page.
Interpret the groups report
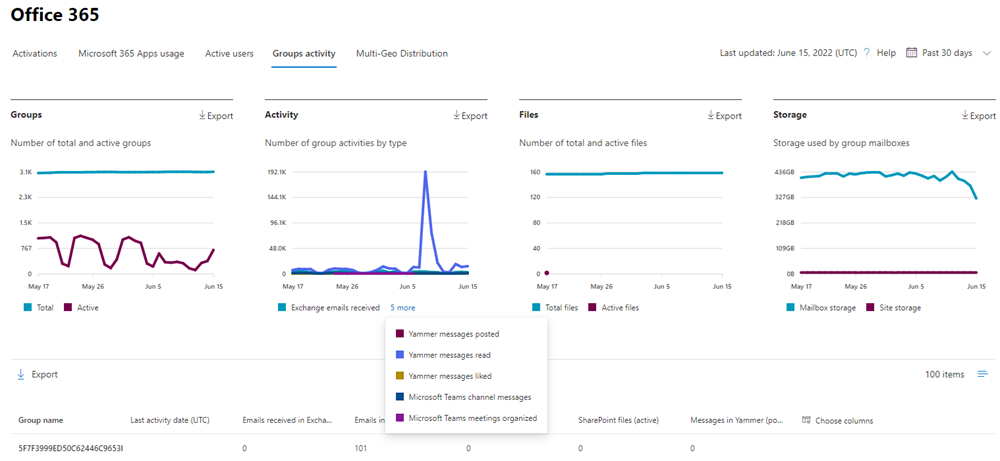
You can view the activations in the Office 365 report by choosing the Groups activity tab.
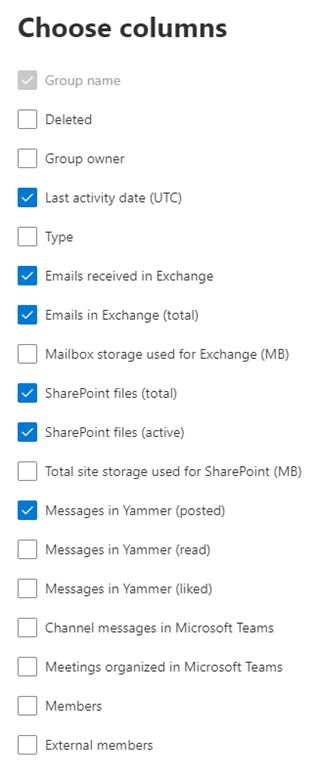
Select Choose columns to add or remove columns from the report.

You can also export the report data into an Excel .csv file by selecting the Export link. This exports data of all users and enables you to do simple sorting and filtering for further analysis.
The groups report can be viewed for trends over the last 7 days, 30 days, 90 days, or 180 days. However, if you select a particular day in the report, the table will show data for up to 28 days from the current date (not the date the report was generated).
GroupID hidden by default
When you export the report data, you will by default not be able to view the GroupID variable in the Excel .csv file that you download. If you want to view GroupID information and all other identifiable information in Microsoft 365 usage reports, you can use choose to show user details in reports through the organizational settings in the Microsoft 365 admin center. You must be a global administrator to make these changes.
The following are definitions of the metrics available in the report table.
| Metric | Definition |
|---|---|
| Group name | The name of the group. |
| Deleted | The number of deleted groups. If the group is deleted, but had activity in the reporting period it will show up in the grid with this flag set to true. |
| Group owner | The name of the group owner. |
| Last activity date (UTC) | The latest date a message was received by the group. - This is the latest date an activity happened in an email conversation, Viva Engage, or the Site. |
| Type | The type of group. This can be private or public group. |
| Emails received in Exchange | The number of messages received by the group. |
| Emails in Exchange (total) | The total number of items in the group's mailbox. |
| Mailbox storage used for Exchange (MB) | The storage used by the group's mailbox. |
| SharePoint files (total) | The number of files stored in SharePoint group sites. |
| SharePoint files (active) | The number of files in the SharePoint group site that were acted on (viewed or modified, synched, shared internally or externally) during the reporting period. |
| Total site storage used for SharePoint (MB) | The amount of storage in MB used during the reporting period. |
| Messages in Viva Engage (posted) | The number of messages posted in the Viva Engage group over the reporting period. |
| Messages in Viva Engage (read) | The number of conversations read in the Viva Engage group over the reporting period. |
| Messages in Viva Engage (liked) | The number of messages liked in the Viva Engage group over the reporting period. |
| Members | The number of members in the group. |
| External members | The number of external users in the group. |
| Total organized meetings | The sum of one-time scheduled and recurring meetings a user organized during the specified time period. |
| Channel messages | The number of unique messages that a user posted in a team chat during the specified time period. This includes original posts and replies. |
Related content
Microsoft 365 Reports in the admin center (article)
Microsoft 365 Reports in the admin center - Active Users (article)
