Monitor Stream Analytics job with Azure portal
The Azure portal surfaces key performance metrics that can be used to monitor and troubleshoot your query and job performance. This article demonstrates how to monitor your Stream Analytics job in portal with the metrics.
Azure portal monitor page
To see Azure Stream Analytics job metrics, browse to the Stream Analytics job you're interested in seeing metrics for and view the Monitoring section on the Overview page.
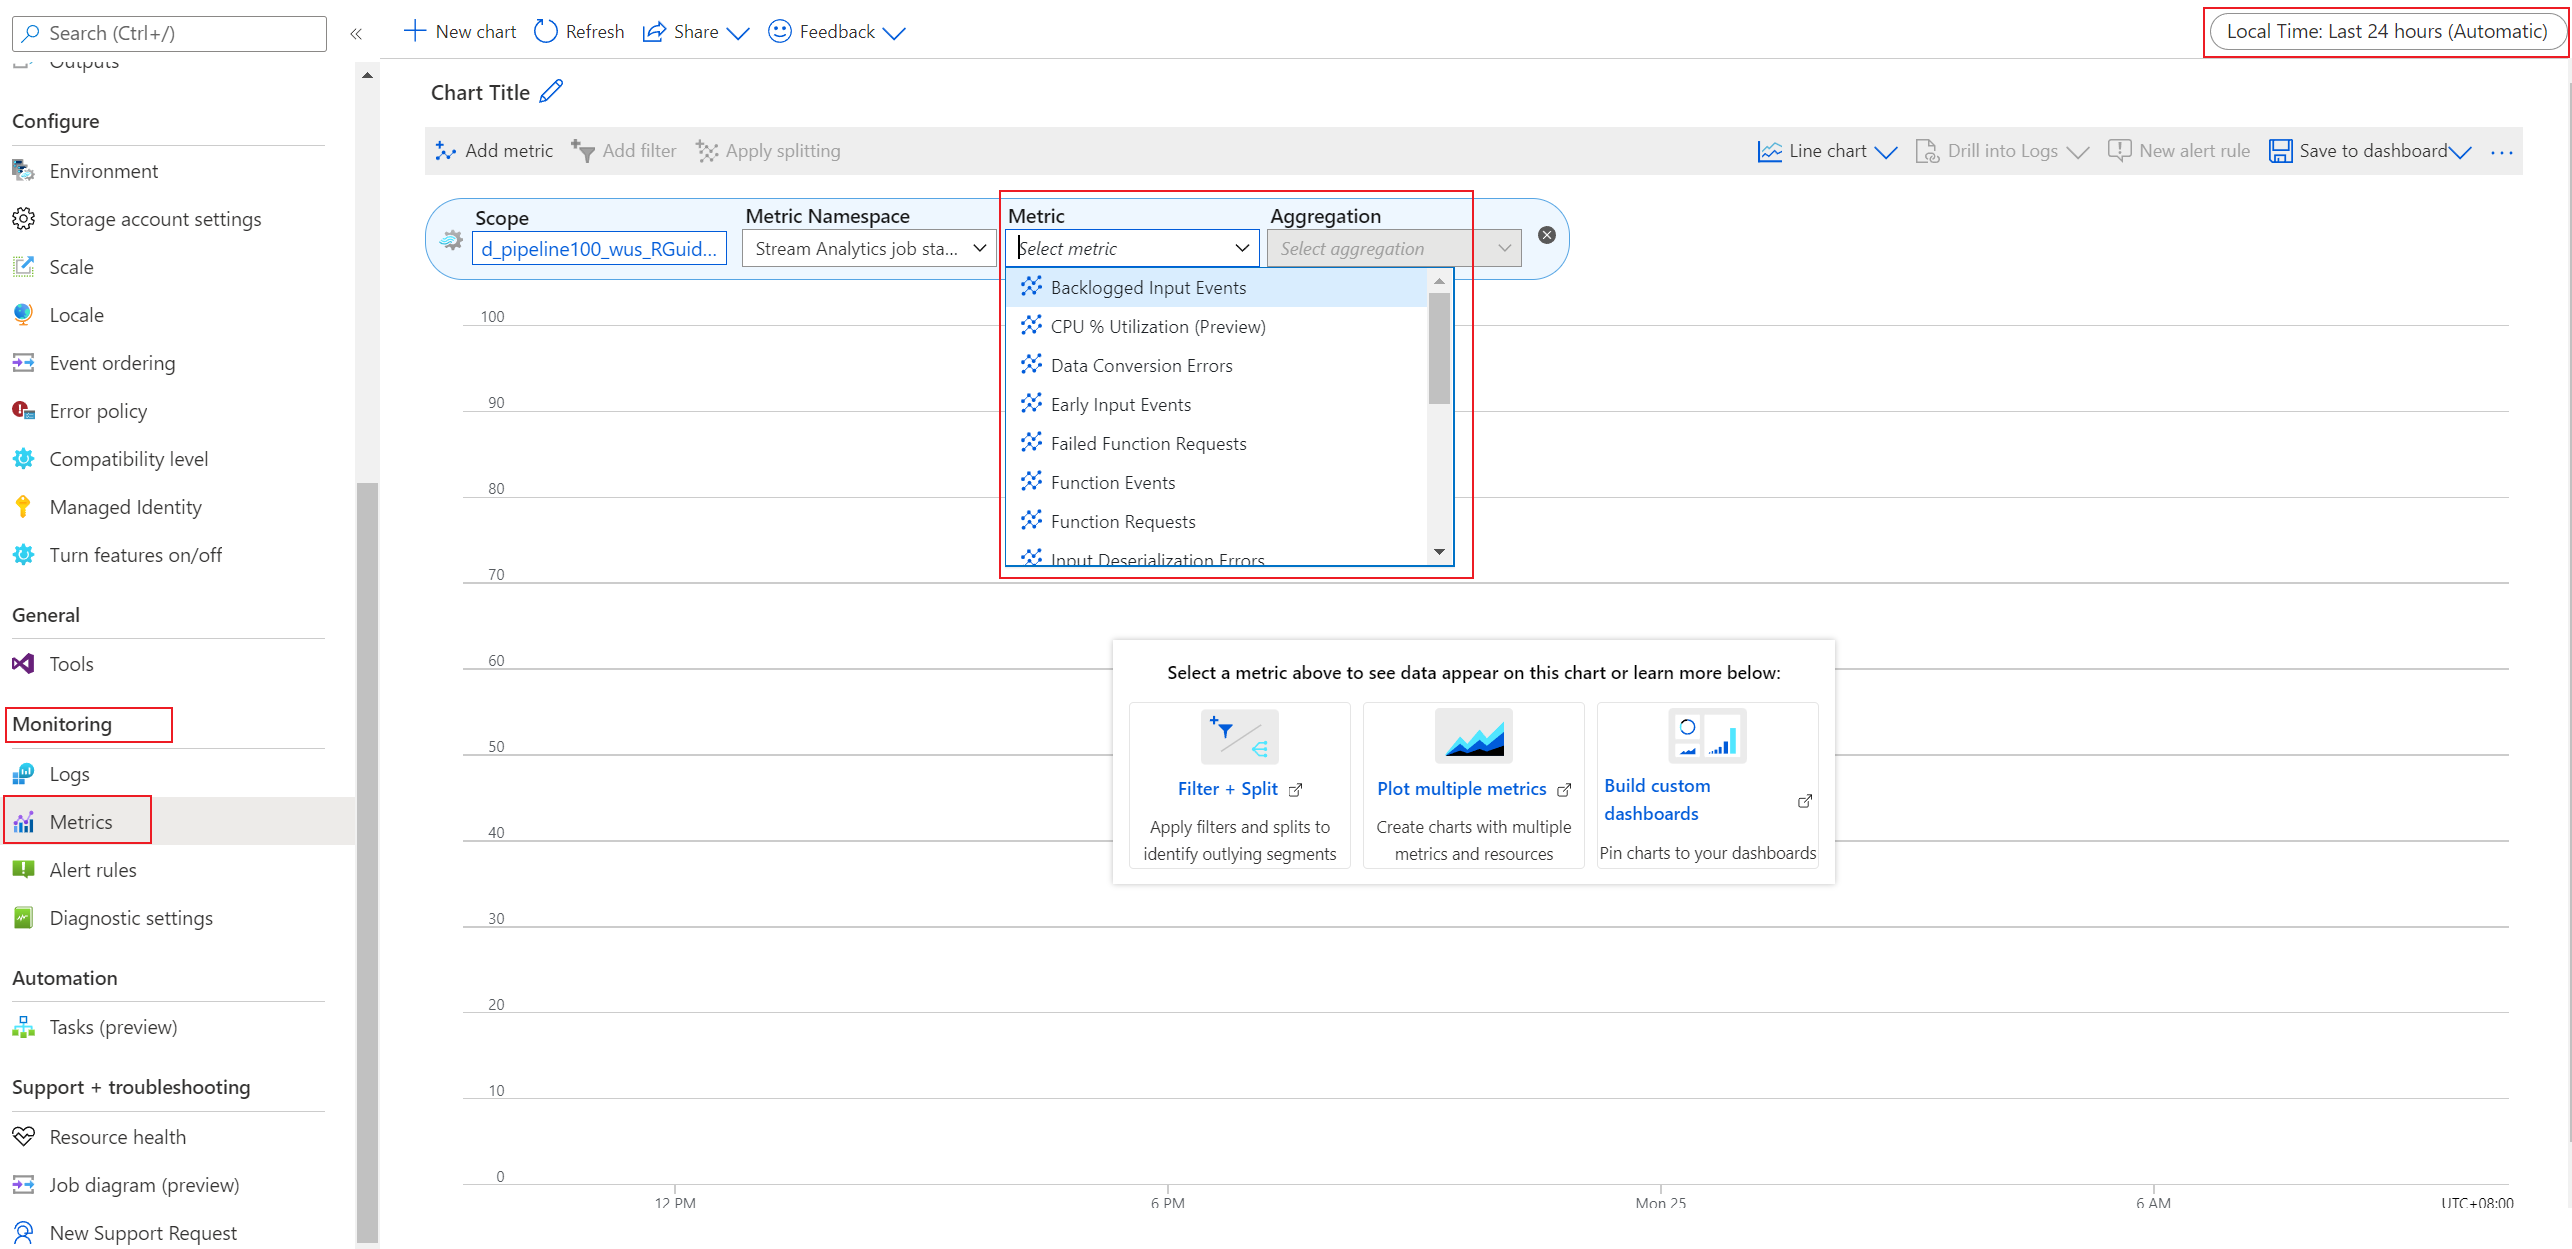
Alternatively, browse to the Monitoring blade in the left panel and select the Metrics, then the metric page will be shown for adding the specific metric you'd like to check:
There are 17 types of metrics provided by Azure Stream Analytics service. To learn about the details of them, see Azure Stream Analytics job metrics.
You can also use these metrics to monitor the performance of your Stream Analytics job.
Operate and aggregate metrics in portal monitor
There are several options available for you to operate and aggregate the metrics in portal monitor page.
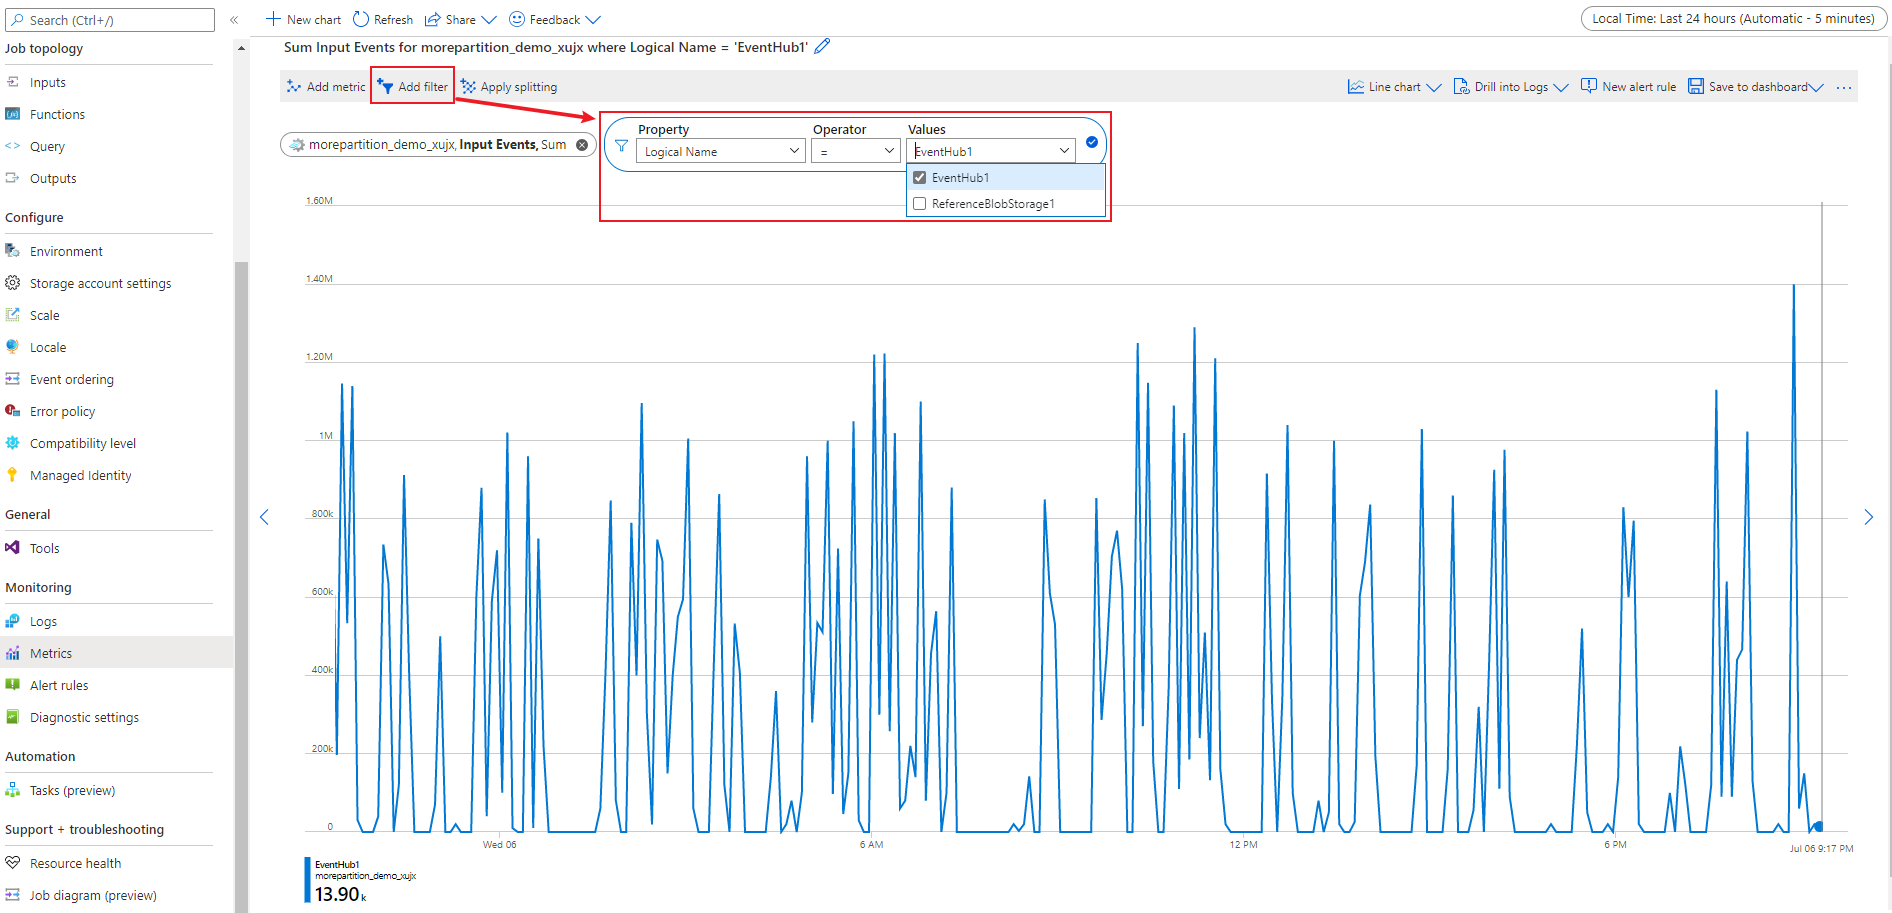
To check the metrics data for a specific dimension, you can use Add filter. There are three important metrics dimensions available. To learn more about the metric dimensions, see Azure Stream Analytics metrics dimensions.
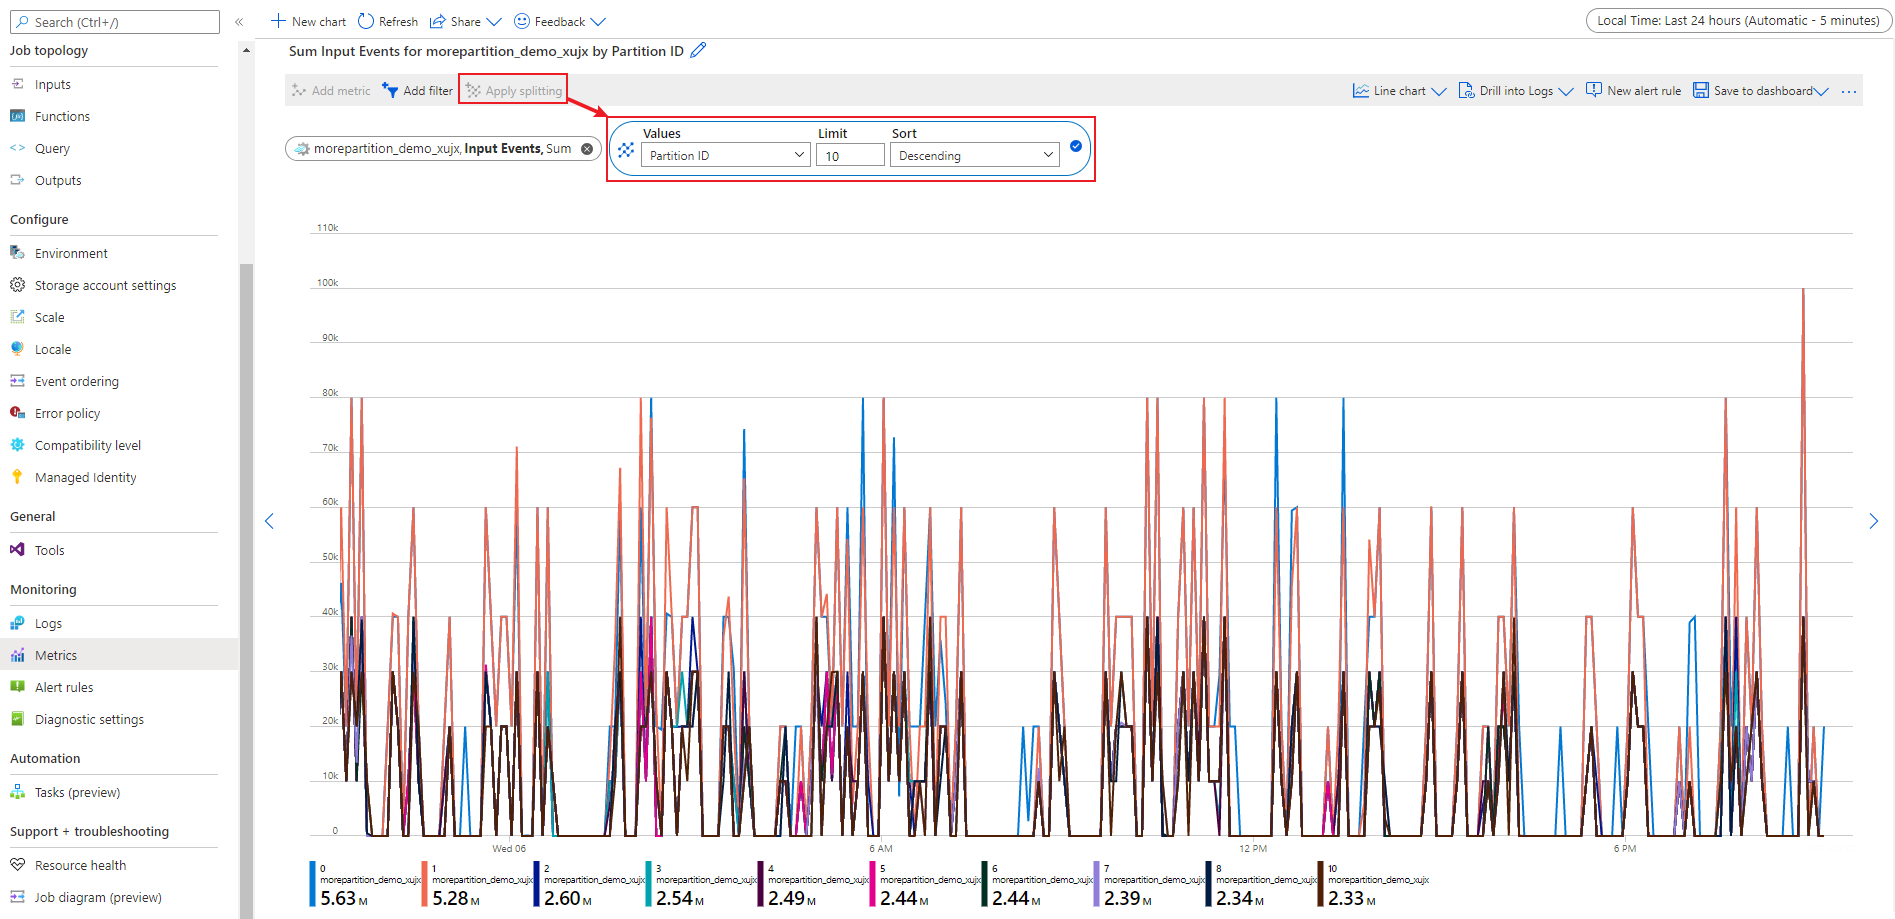
To check the metrics data per dimension, you can use Apply splitting.
You can also specify the time range to view the metrics you're interested in.
For details, see How to Customize Monitoring.
Get help
For further assistance, try our Microsoft Q&A question page for Azure Stream Analytics


