Eventhouse and KQL Database consumption
Eventhouses and KQL databases operate on a fully managed Kusto engine. With an Eventhouse or KQL database, you can expect available compute for your analytics within 5 to 10 seconds. The compute resources grow with your data analytic needs. This article explains compute usage reporting of the KQL databases in Microsoft Fabric, including [Eventhouse UpTime](#eventhouse uptime) and storage.
When you use a Fabric capacity, your usage charges appear in the Azure portal under your subscription in Microsoft Cost Management. To understand your Fabric billing, visit Understand your Azure bill on a Fabric capacity.
Important
Changes to Microsoft Fabric Workload Consumption Rate
Consumption rates are subject to change at any time. Microsoft will use reasonable efforts to provide notice via email or through in-product notification. Changes shall be effective on the date stated in Microsoft's Release Notes or Microsoft Fabric Blog. If any change to a Microsoft Fabric Workload Consumption Rate materially increases the Capacity Units (CU) required to use a particular workload, customers can use the cancellation options available for the chosen payment method.
Capacity
Based on the Capacity SKU that was purchased in Fabric, you're entitled to a set of Capacity Units (CUs) that are shared across all Fabric workloads. For more information on licenses supported, see Microsoft Fabric licenses.
Capacity is a dedicated set of resources that is available at a given time to be used. Capacity defines the ability of a resource to perform an activity or to produce output. Different resources consume CUs at different times. The amount of capacity that used by a KQL database is based on the Eventhouse UpTime operation.
Eventhouse UpTime
Eventhouse UpTime for an eventhouse is the number of seconds that your eventhouse is active in relation to the number of virtual cores used by your eventhouse. An autoscale mechanism is used to determine the size of your eventhouse. This mechanism ensures cost and performance optimization based on your usage pattern. An eventhouse with multiple KQL databases attached to it only shows Eventhouse UpTime for the eventhouse item. You will not see usage for the KQL database sub-item.
For example, an eventhouse with 4 KQL databases using 4 virtual cores that is active for 30 seconds will use 120 seconds of Capacity Units.
Eventhouse UpTime for a KQL database is the number of seconds that your KQL database is active in relation to the number of virtual cores used by your database. An autoscale mechanism is used to determine the size of your KQL database. This mechanism ensures cost and performance optimization based on your usage pattern.
For example, a database using 4 virtual cores that is active for 30 seconds will use 120 seconds of Capacity Units.
Note
If your KQL database is a sub-item of an eventhouse, the Eventhouse UpTime is relfected in the eventhouse item and the database item isn't shown in the list.
Monitor Eventhouse UpTime
You can monitor Eventhouse UpTime with the Microsoft Fabric Capacity Metric app. Learn how to understand the Metrics app compute page in Understand the metrics app compute page. This example shows information specific to monitoring Eventhouse UpTime.
Note
You must be a capacity administrator to monitor capacity usage. For more information, see Understand Microsoft Fabric admin roles.
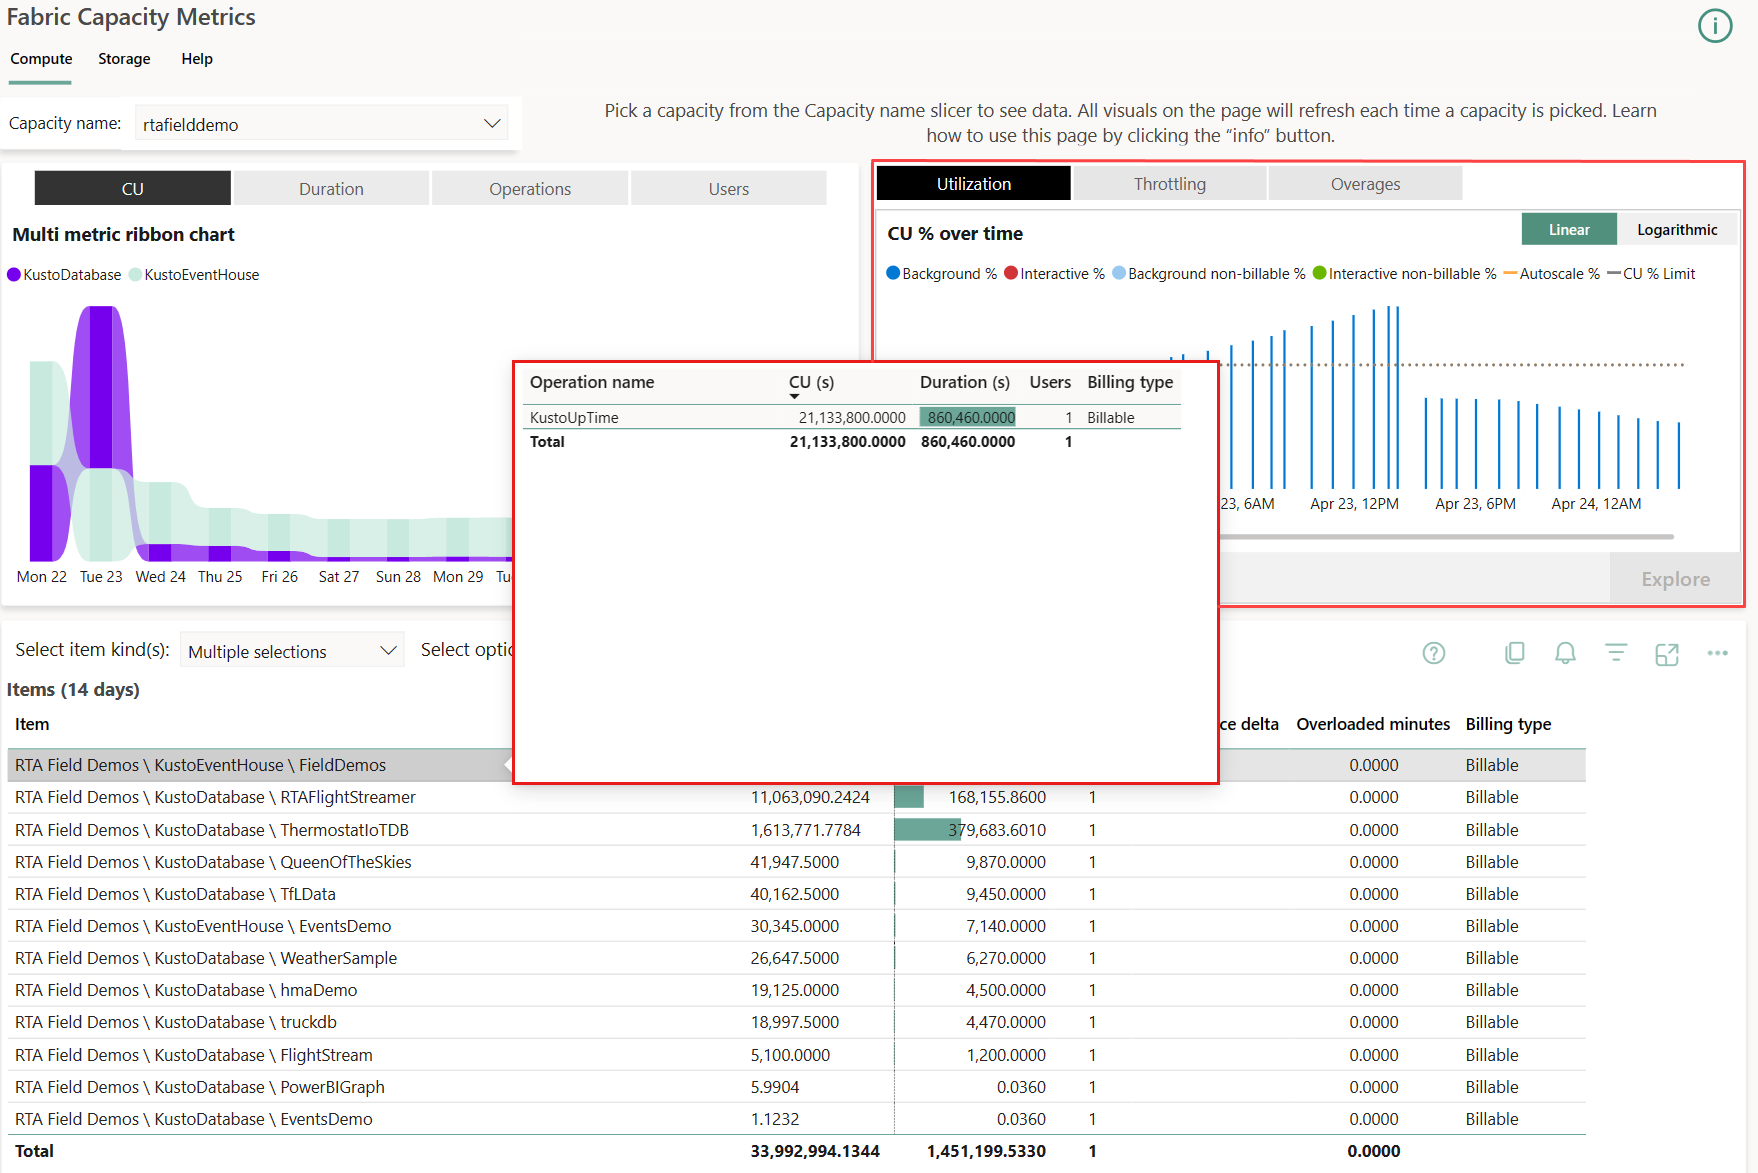
The following image shows a sample compute page from monitoring capacity in the Fabric Capacity Metric app:
Here are some insights you can take from the example:
- The capacity being examined is called rtafielddemo.
- The capacity units for the selected day were used by a single workspace called RTA Field Demo.
- The Items view has been filtered to show both Eventhouse and KQL Database.
- Selecting a single item, such as an Eventhouse item, breaks down the CU usage by operations.
- The utilization graph, on the right side of the app, shows nearly 100% CU usage over time. This high utilization can explain query throttling experienced by users and indicates a need to increase the capacity units.
Storage billing
Storage is billed separately from your Fabric or Power BI Premium Capacity units. Data ingested into a KQL database is stored in two tiers of storage: OneLake Cache Storage, and OneLake Standard Storage.
- OneLake Cache Storage is premium storage that is utilized to provide the fastest query response times. When you set the cache policy, you affect this storage tier. For instance, if you typically query back seven days then you can set the cache retention to seven days for best performance. This storage tier is comparable to the Azure ADLS (Azure Data Lake Storage) premium tier.
Note
Enabling minimum consumption means that you aren't charged for OneLake Cache Storage. When minimum capacity is set, the eventhouse is always active resulting in 100% Eventhouse UpTime.
- OneLake Standard Storage is standard storage that is used to persist and store all queryable data. When you set the retention policy, you affect this storage tier. For instance, if you need to maintain 365 days of queryable data you can set the retention to 365 days. This storage tier is comparable to the Azure ADLS (Azure Data Lake Storage) hot tier.
Monitor OneLake Storage
The Microsoft Fabric Capacity Metric app allows any capacity administrator to monitor OneLake Storage. Learn how to understand the Metrics app storage page in Understand the metrics app storage page.
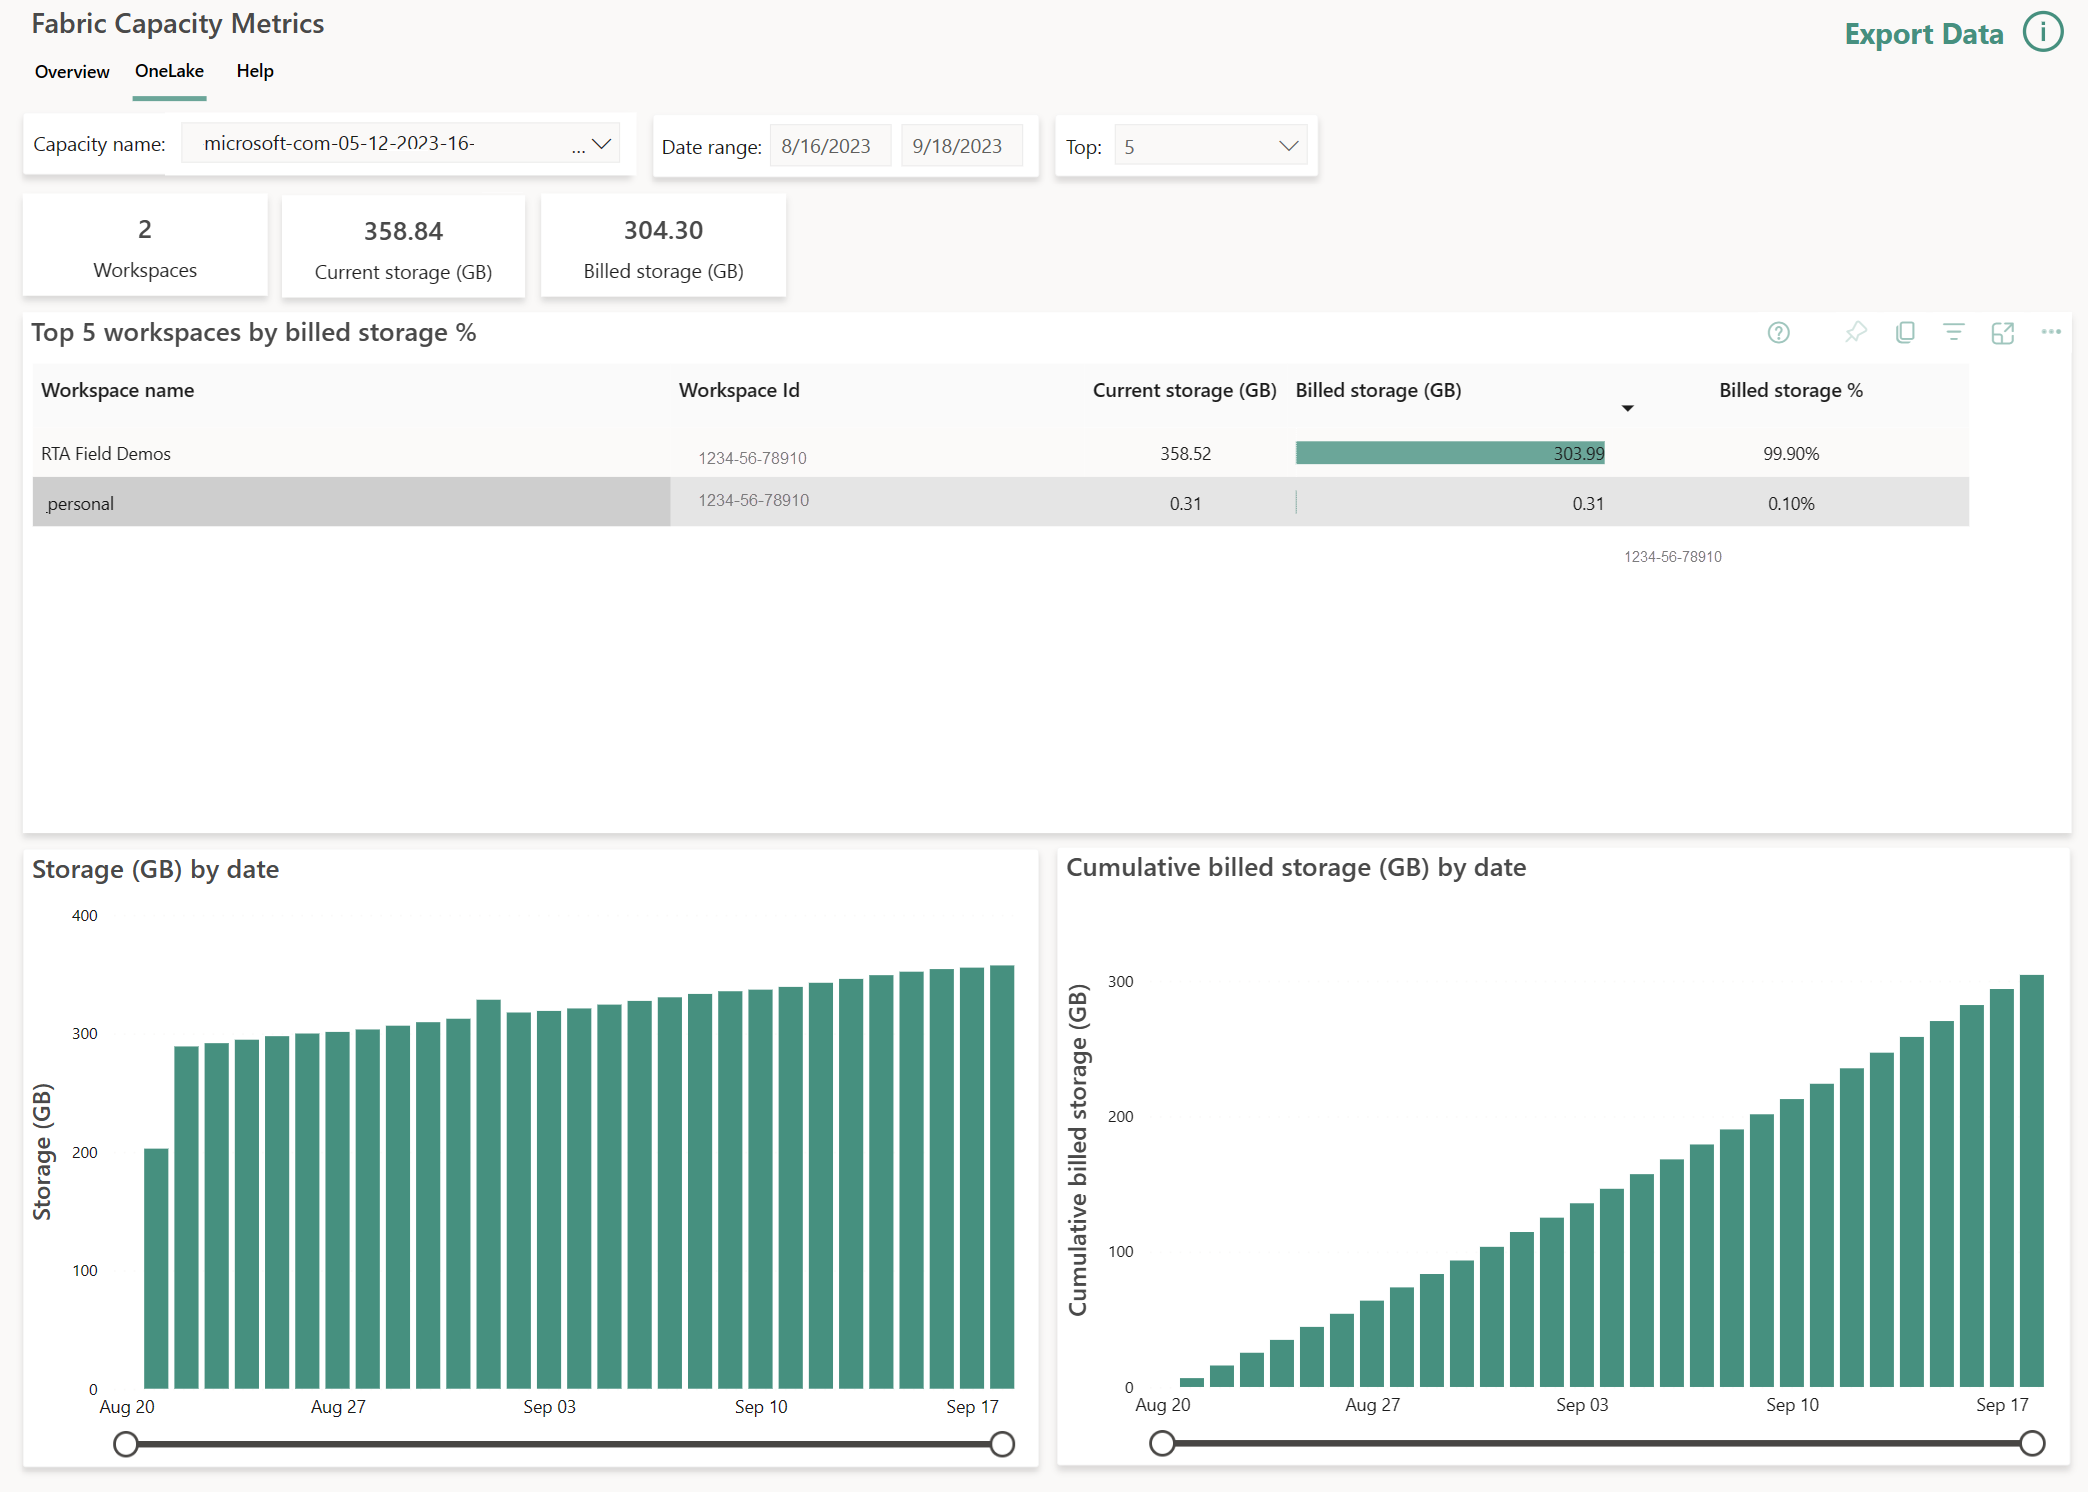
The following image shows a sample storage page from monitoring a KQL database in the Fabric Capacity Metric app:

