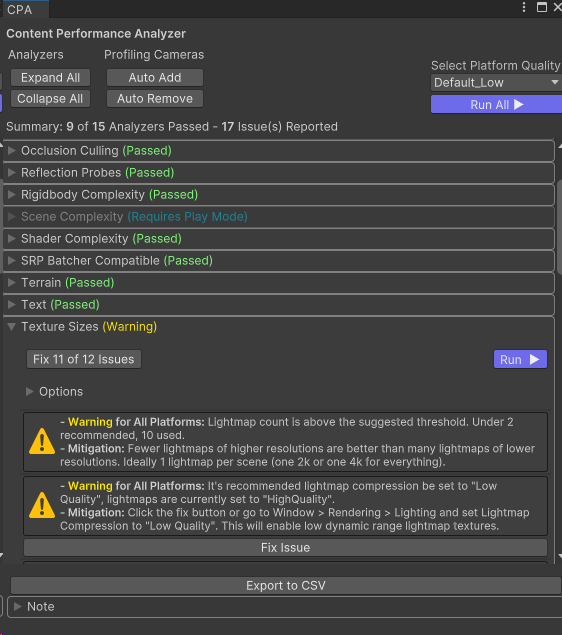
Content Performance Analyzer
What is the Content Performance Analyzer?
You can use the Content Performance Analyzer (CPA) to automatically catch content optimization issues and opportunities before you upload content to Mesh. You can use the CPA to audit triangle counts, batches, texture memory utilization, and more.
Using the CPA tool
To run the CPA tool:
On the menu bar, select Mesh Toolkit > Content Performance Analyzer.
This opens the CPA tool in its own window.

In the CPA tool, click the Run All (▶) button. Your content will be automatically analyzed based on the project's current quality settings.
To audit other platform quality settings:
Click the Select Platform Quality drop-down and then select your desired platform.
Important
For best results, make sure you run the CPA tool while playing in Unity. Some tests only work in Play mode, while some work in either Play or Edit mode.
Analyzers
Each analyzer performs a different test to check if content is optimally setup. The table below highlights what each analyzer does as well as discrete thresholds.
| Name | Description | Requires Play Mode | PC thresholds | Android (Quest) thresholds |
|---|---|---|---|---|
| Animation | Checks if Animator and Animation components have visibility culling set up optimally. | No | N/A | N/A |
| Collision Complexity | Checks for high triangle count MeshCollider components. | No | Under 100 triangles for dynamic MeshColliders and under 10,000 triangles for static MeshColliders. | Same as PC |
| Light Complexity | Checks utilization of real-time lights and shadow casting lights and for the existence of an avatar light. | No | Under 5 real-time per pixel lights and 0 real-time shadow casting lights. | Under 3 real-time per pixel lights and 0 real-time shadow casting lights. |
| Mesh Complexity | Warns about the use of very dense MeshFilter components. | No | Above 30,000 triangles per MeshFilter emits a warning and above 100,000 triangles per MeshFilter emits an error. | Same as PC |
| Mesh Complexity Rendered | Checks if a viewpoint is rendering too many triangles. | Yes | Under 500,000 triangles rendered. | Under 80,000 triangles rendered. |
| Reflection Probes | Checks if real-time reflection probes are being used. | No | Allowed | Disallowed |
| Rigidbody Complexity | Checks for too many Rigidbody components being used. | No | Under 50 Rigidbodies. | Same as PC |
| Scene Complexity | Checks if a viewpoint is emitting too many rendering batches. | Yes | Under 200 batches emitted. | Under 50 batches emitted. |
| Shader Complexity | Checks the number of vertex and fragment stage math operations of referenced shaders. | No | Under 150 math operations for the vertex stage. Under 600 math operations for the fragment stage. | Under 30 math operations for the vertex stage. Under 120 math operations for the fragment stage. |
| SRP Batcher Compatible | Checks if SRP Batcher compatible shaders are being used. | No | N/A | N/A |
| Terrain | Checks for performance issues on Terrain components. | No | Under 2 Terrain components and a Heightmap Pixel Error over 4. | Same as PC |
| Text | Warns if a TextMeshPro component is using a nonstandard font. | No | N/A | N/A |
| Texture Sizes | Checks memory usage for textures and lightmaps. | No | Under 160 MB for textures and under 80 MB for lightmaps. | Under 16 MB for textures and under 20 MB for lightmaps. |
| WebSlate | Checks the runtime render time for a WebSlate component. | Yes | Under 2 ms per WebSlate component. | Same as PC |
Scene Complexity and Mesh Complexity Rendered results are based on camera position and orientation. The CPA tool will search for all cameras within your scene, including disabled ones, and run tests from each camera. If your scene doesn't have a camera, the CPA tool will add a camera when testing that focuses on the bounds of your scene.
Important
Place a few cameras in your scene (disable them if you need to) that mimic real vantage points a user might experience. If you're unsure about where to add cameras by hand, you can click the Auto Add button in the Profiling Cameras section of the CPA window. This will automatically add cameras to the navigable space.
How to interpret the results
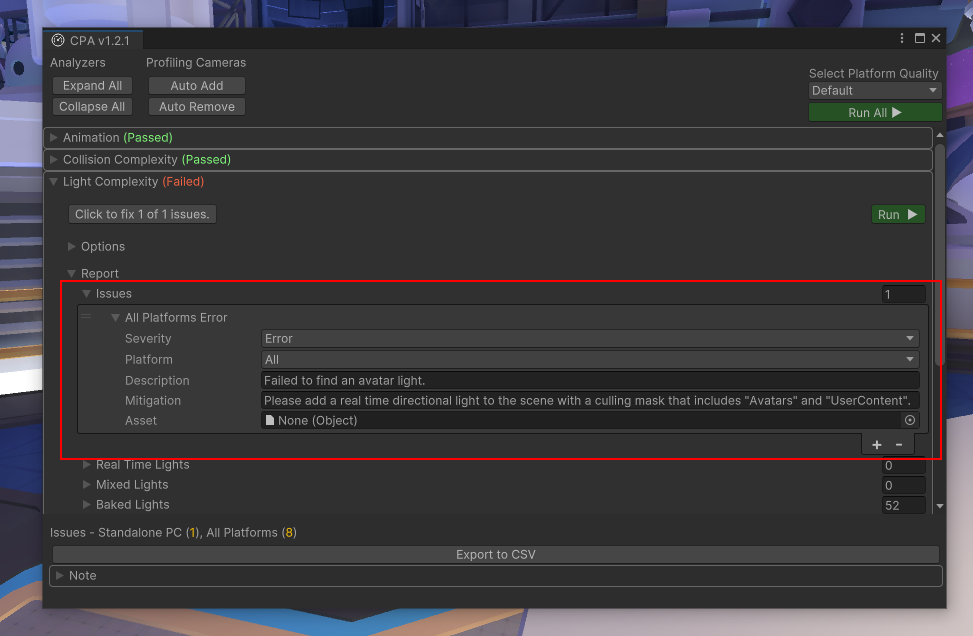
After you click Run All, the words "Passed", "Warning", or "Failed" will be added to each analyzer's title. To gain more insight into why an analyzer failed, look in the Report > Issues section of the analyzer.

Tip
You can export results to a .CSV file and then open it in Microsoft Excel by clicking the Export to CSV button.
Зворотний зв’язок
Очікується незабаром: протягом 2024 року ми будемо припиняти використання механізму реєстрації проблем у GitHub для зворотного зв’язку щодо вмісту й замінювати його новою системою зворотного зв’язку. Докладніше: https://aka.ms/ContentUserFeedback.
Надіслати й переглянути відгук про