Create Q&A featured questions for Power BI dashboards
APPLIES TO:
Power BI Desktop
Power BI service
If you have edit permission for a semantic model, you can add your own featured questions to that semantic model. Power BI Q&A will show those questions to colleagues who consume dashboards based on that semantic model. Featured questions give your colleagues ideas about the types of questions they can ask about the semantic model. The featured questions you add are up to you. You can add popular questions, questions that display interesting results, or questions that might be hard to phrase.
Note
Q&A featured questions are available for use in the Microsoft Power BI app on iPads, iPhones, and iPod Touch devices and in the Power BI service (app.powerbi.com). Creating the questions is only available in the Power BI service.
Prerequisites
- You just need a Fabric free license to add featured questions to a dataset in My Workspace in the Power BI service.
- You need a Power BI Pro license to add featured questions in other workspaces in the Power BI service. Read more about Power BI Pro licenses.
- You also need at least a Contributor role in that workspace. Read more about roles in workspaces.
- If you want to follow along, get the Retail Analysis sample in the Power BI service.
Create a featured question
This article uses the Retail Analysis sample. Follow these step-by-step instructions to explore a semantic model.
On the dashboard, select the Ask a question about your data Q&A question box. Notice that Q&A is already being helpful by displaying some suggested questions.
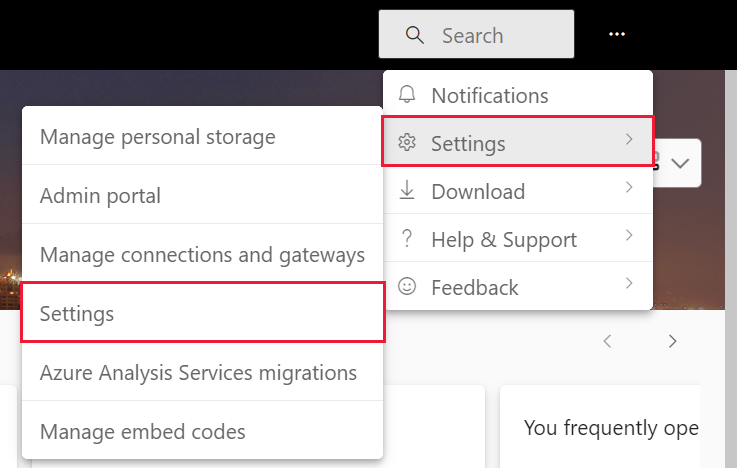
To create a featured question, in Power BI, select More options (...), select Settings > Settings.

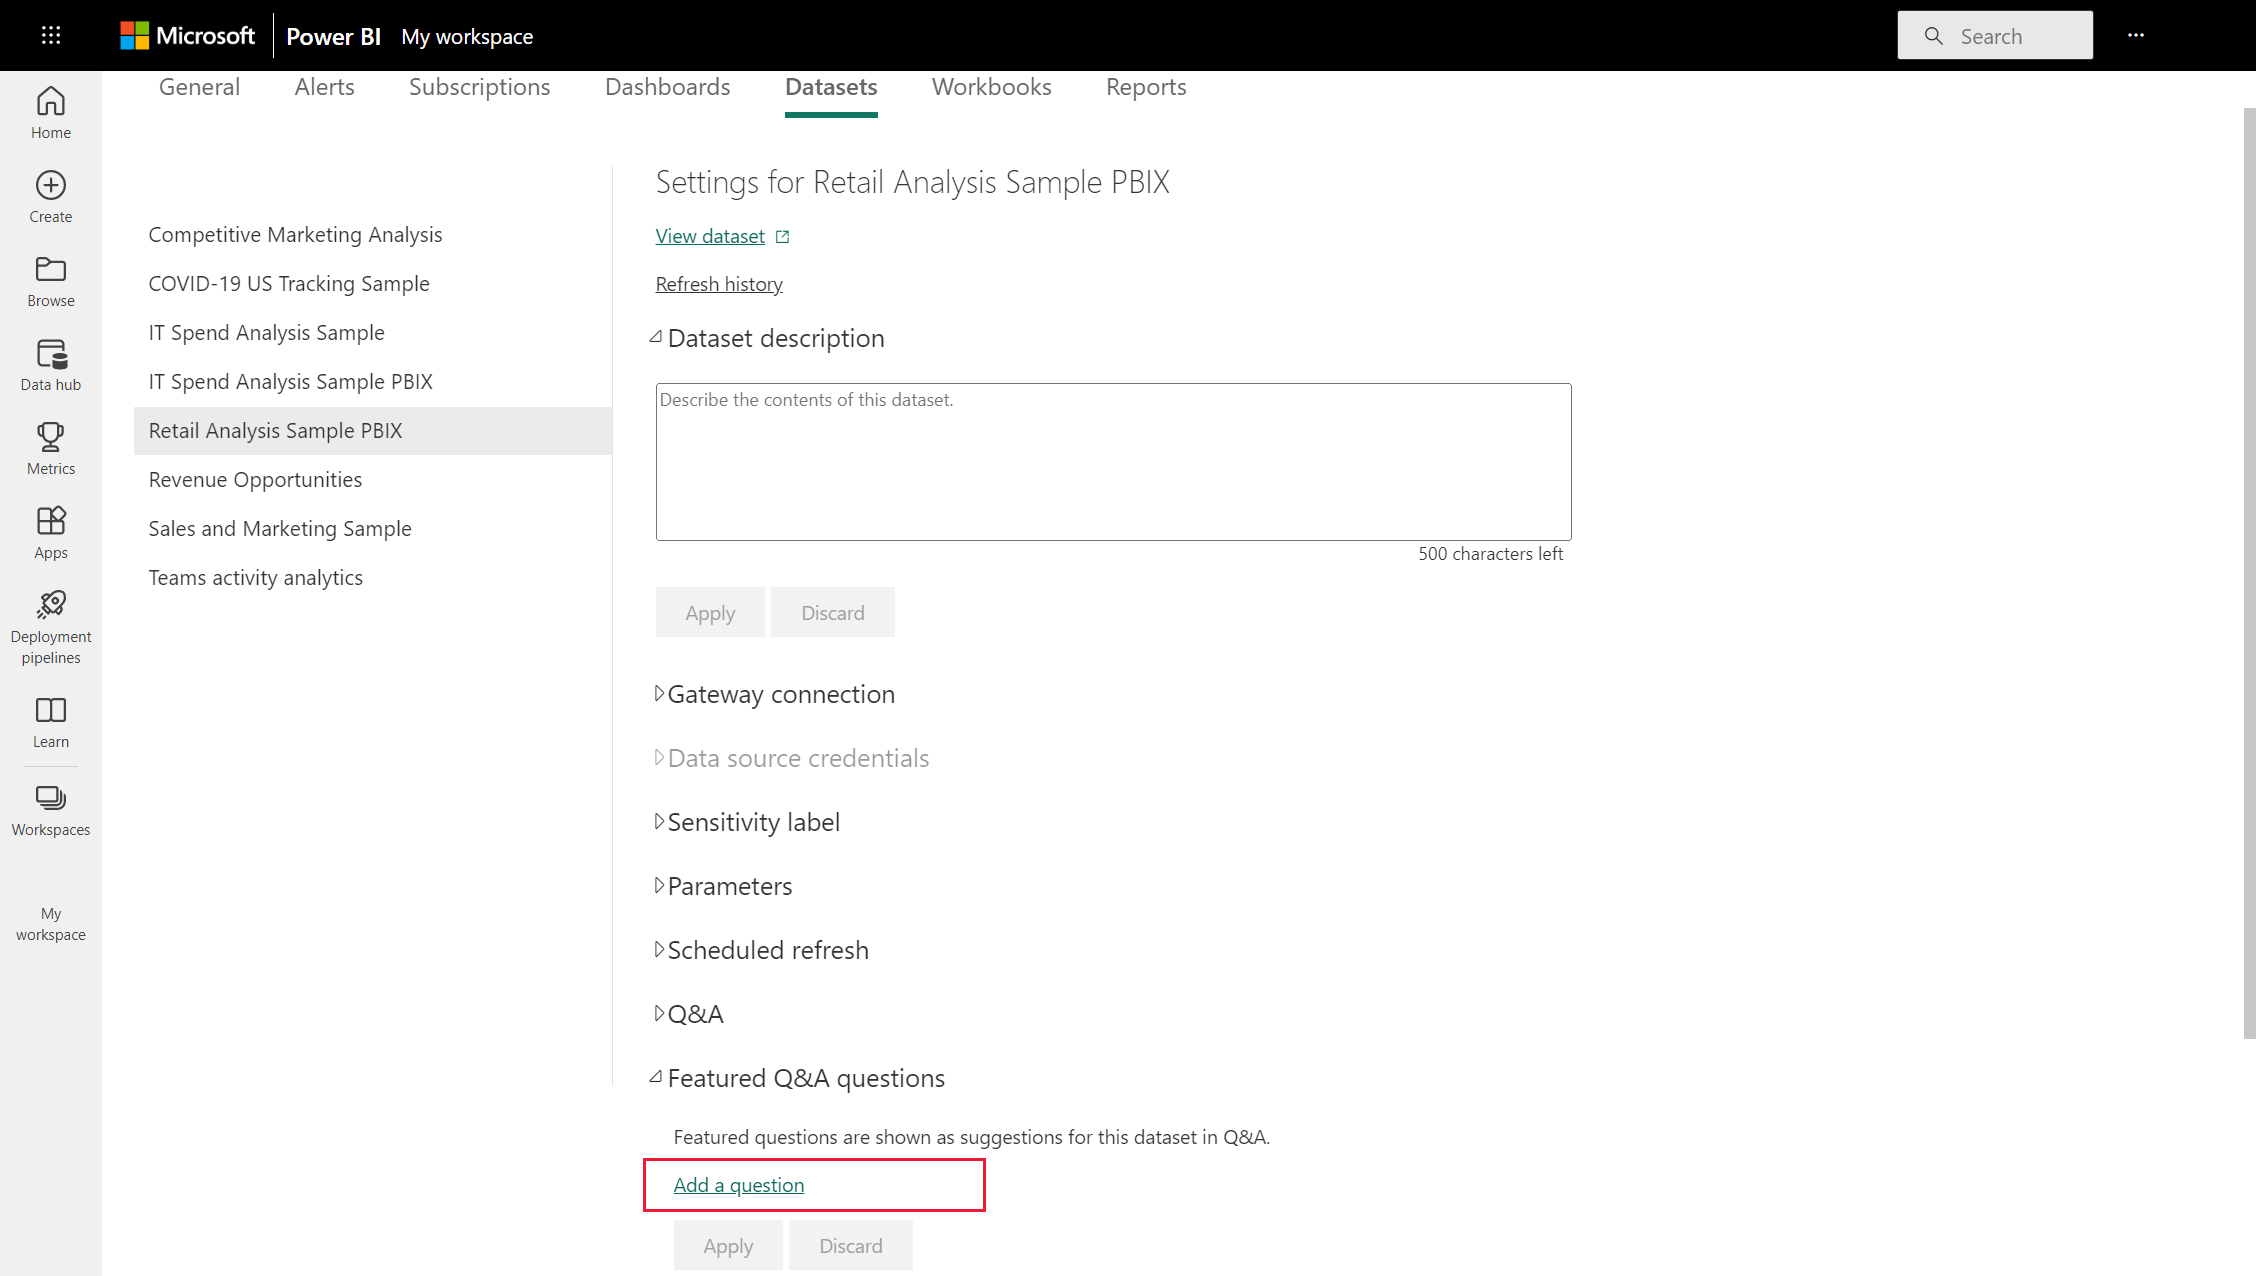
Select Semantic models > Retail Analysis sample > Featured Q&A questions.
Select Add a question.

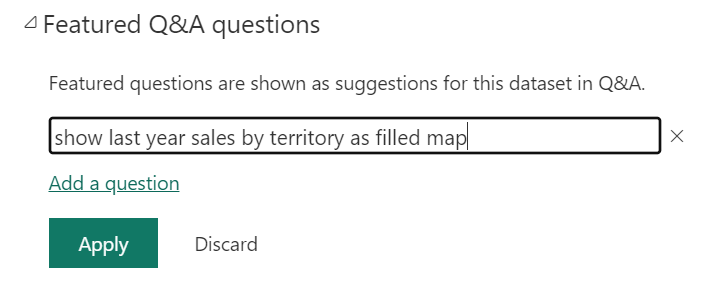
Type your question in the text box. For example, type "show last year sales by territory as filled map" and select Apply. Optionally, add another question by selecting Add a question again.

Go back to the Power BI dashboard for the Retail Analysis sample, and place your cursor in the Q&A question box.

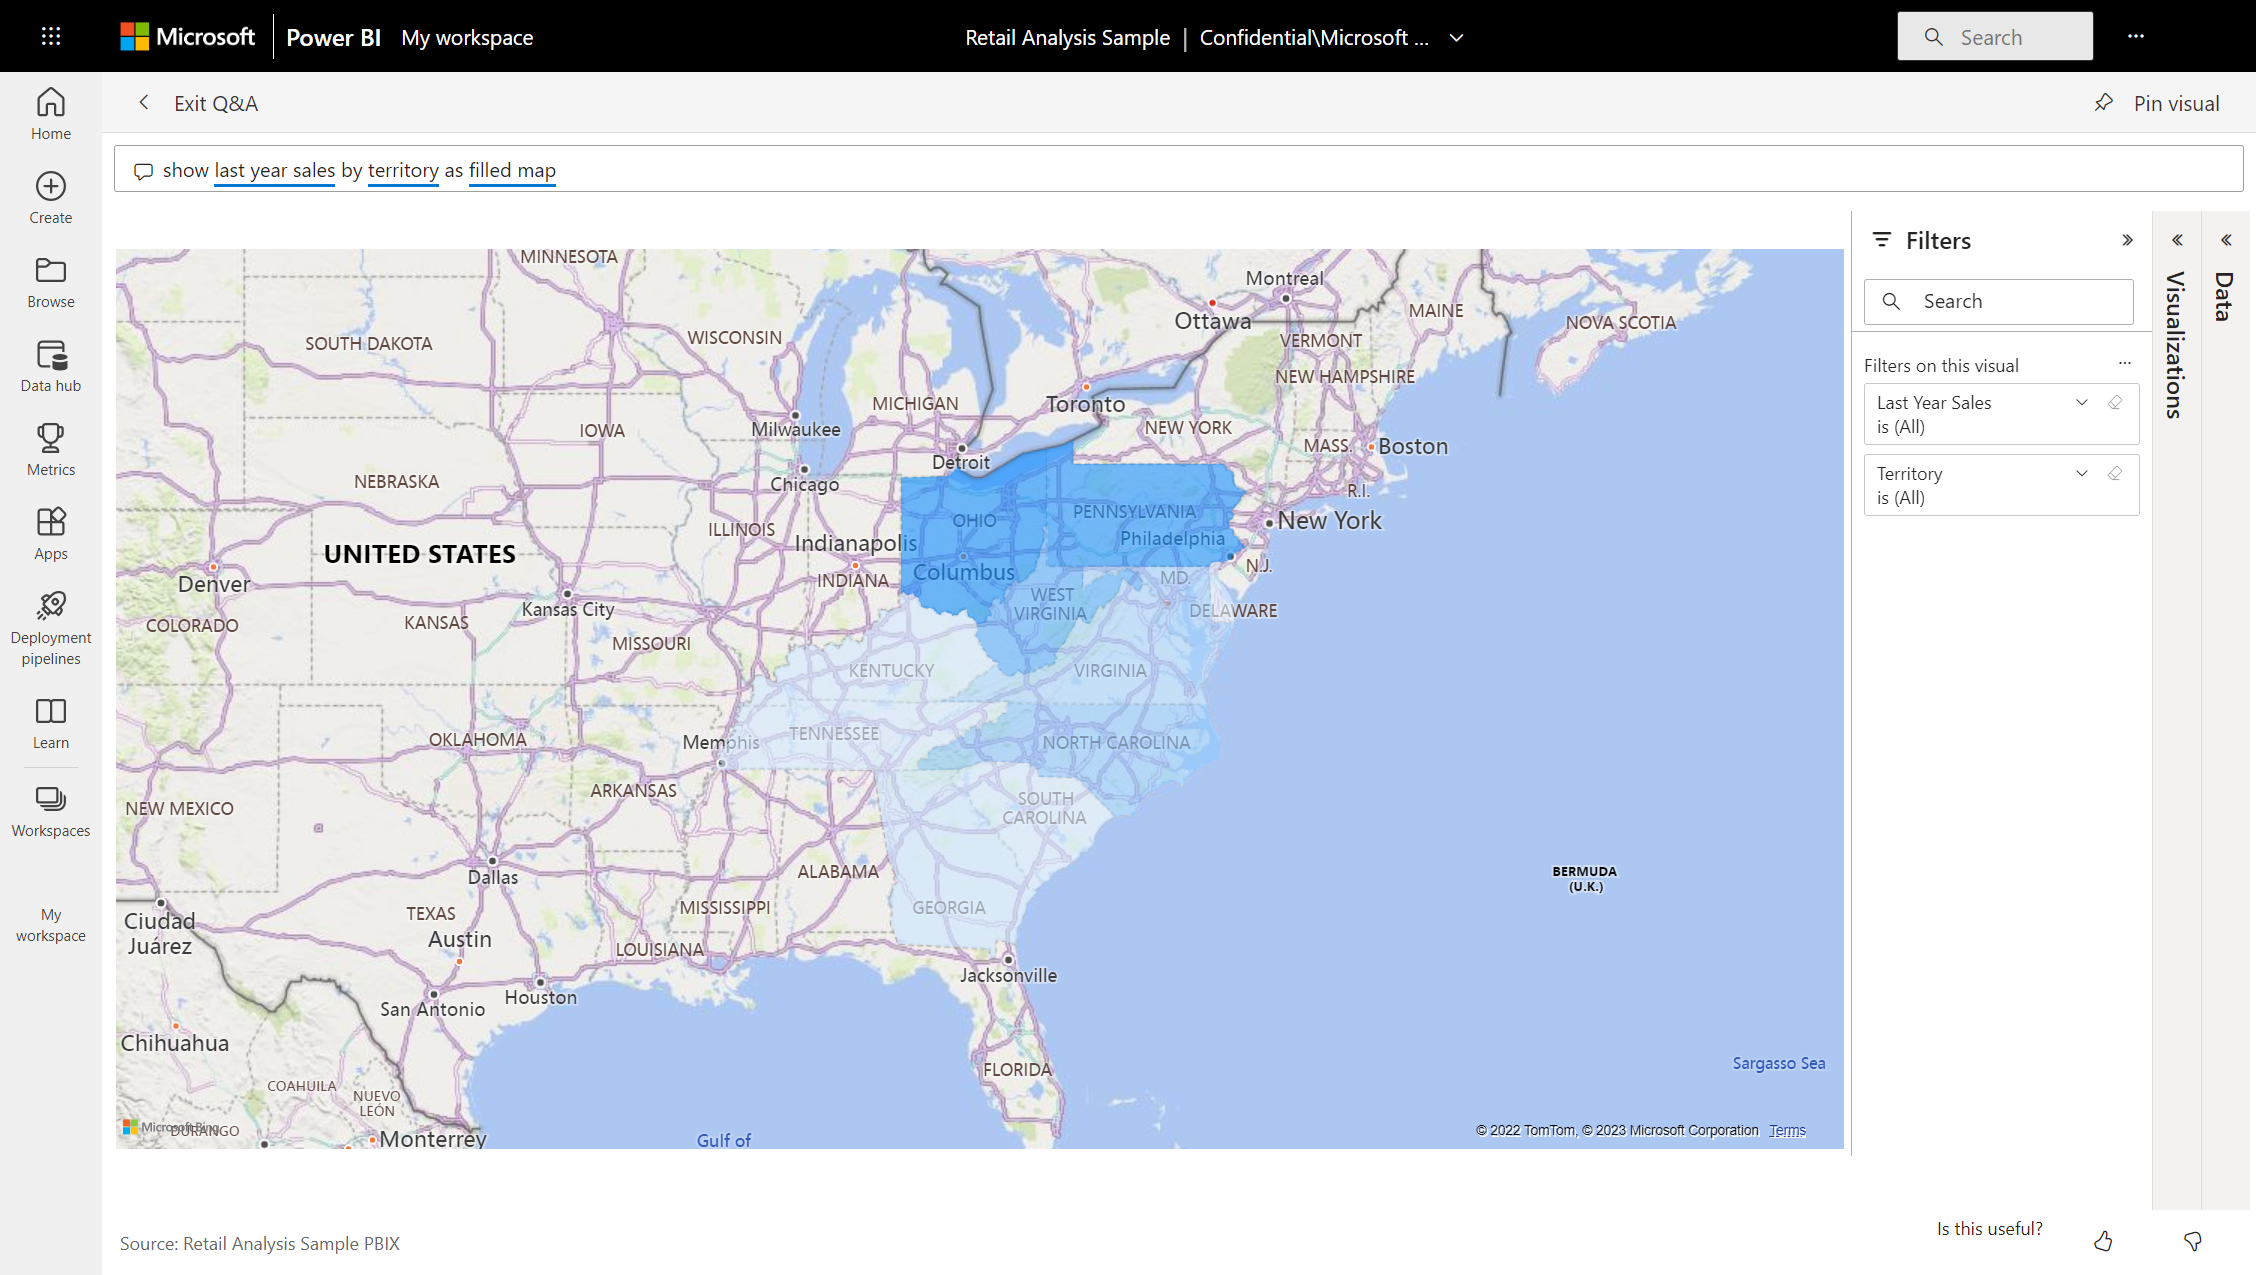
The Q&A screen shows the new featured question, show last year sales by territory as filled map. Select the featured question.

Power BI creates the answer and displays it as a filled map visualization.

Related content
- Q&A for Power BI business users
- Use Power BI Q&A to explore your data and create visuals
- Basic concepts for designers in the Power BI service
More questions? Ask the Power BI Community