Use quick measures for common calculations
You can use quick measures to quickly and easily perform common, powerful calculations. A quick measure runs a set of Data Analysis Expressions (DAX) commands behind the scenes, then presents the results for you to use in your report. You don't have to write the DAX, it's done for you based on input you provide in a dialog box. There are many available categories of calculations and ways to modify each calculation to fit your needs. Best of all, you can see the DAX that's executed by the quick measure and jump-start or expand your own DAX knowledge.
Create a quick measure
To create a quick measure in Power BI Desktop, right-click or select the ellipsis ... next to any item in the Fields pane, and choose New quick measure from the menu that appears.
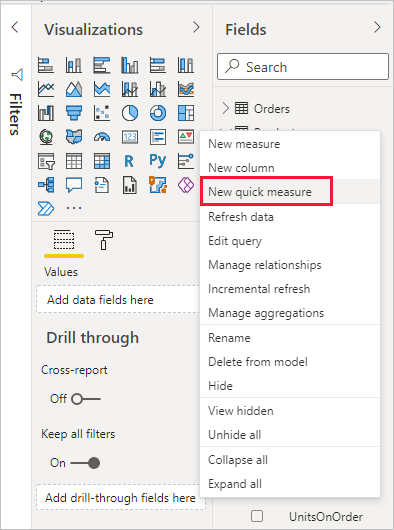
You can also right-click or select the drop-down arrow next to any value in the Values well for an existing visual, and choose New quick measure from the menu.
When you select New quick measure, the Quick measures window appears, letting you choose the calculation you want and the fields to run the calculation against.
Choose the Select a calculation field to see a long list of available quick measures.
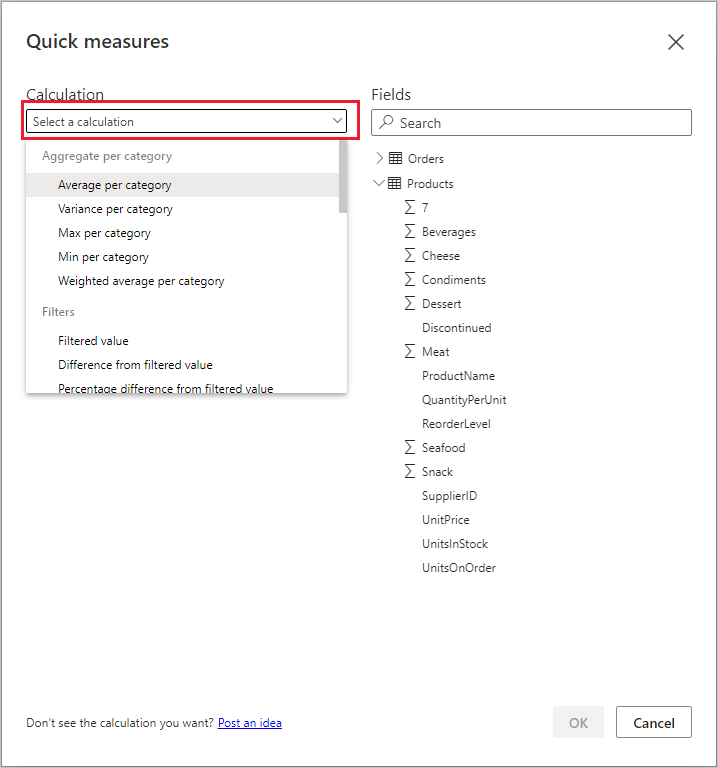
The five quick measure calculation types, with their calculations, are:
- Aggregate per category
- Average per category
- Variance per category
- Max per category
- Min per category
- Weighted average per category
- Filters
- Filtered value
- Difference from filtered value
- Percentage difference from filtered value
- Sales from new customers
- Time intelligence
- Year-to-date total
- Quarter-to-date total
- Month-to-date total
- Year-over-year change
- Quarter-over-quarter change
- Month-over-month change
- Rolling average
- Totals
- Running total
- Total for category (filters applied)
- Total for category (filters not applied)
- Mathematical operations
- Addition
- Subtraction
- Multiplication
- Division
- Percentage difference
- Correlation coefficient
- Text
- Star rating
- Concatenated list of values
To submit your ideas about new quick measures you'd like to see, underlying DAX formulas, or other quick measures ideas for consideration, check out the Power BI Ideas page.
Note
When using SQL Server Analysis Services (SSAS) live connections, some quick measures are available. Power BI Desktop displays only the quick measures that are supported for the version of SSAS you're connecting to. If you're connected to a SSAS live data source and don't see certain quick measures in the list, it's because the SSAS version you're connected to doesn't support the DAX commands used to implement those quick measures.
After you select the calculations and fields you want for your quick measure, choose OK. The new quick measure appears in the Fields pane, and the underlying DAX formula appears in the formula bar.
Quick measure example
Let's take a look at a quick measure in action.
The following matrix visual shows a sales table for various products. It's a basic table that includes the sales totals for each category.
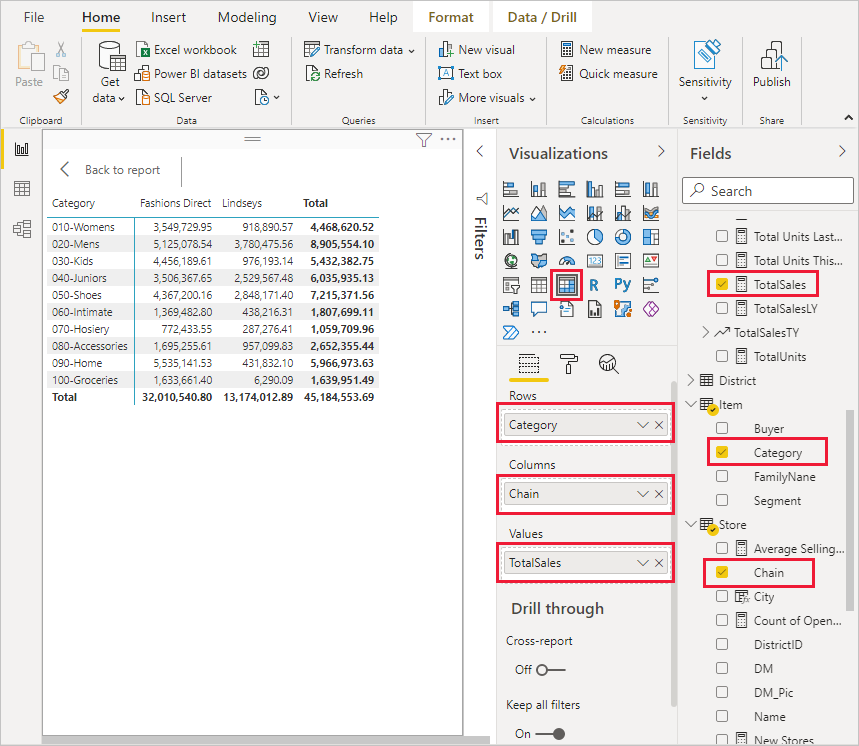
With the matrix visual selected, choose the drop-down arrow next to TotalSales in the Values well, and select New quick measure.
In the Quick measures window, under Calculation, select Average per category.
Drag Average Unit Price from the Fields pane into the Base value field. Leave Category in the Category field, and select OK.
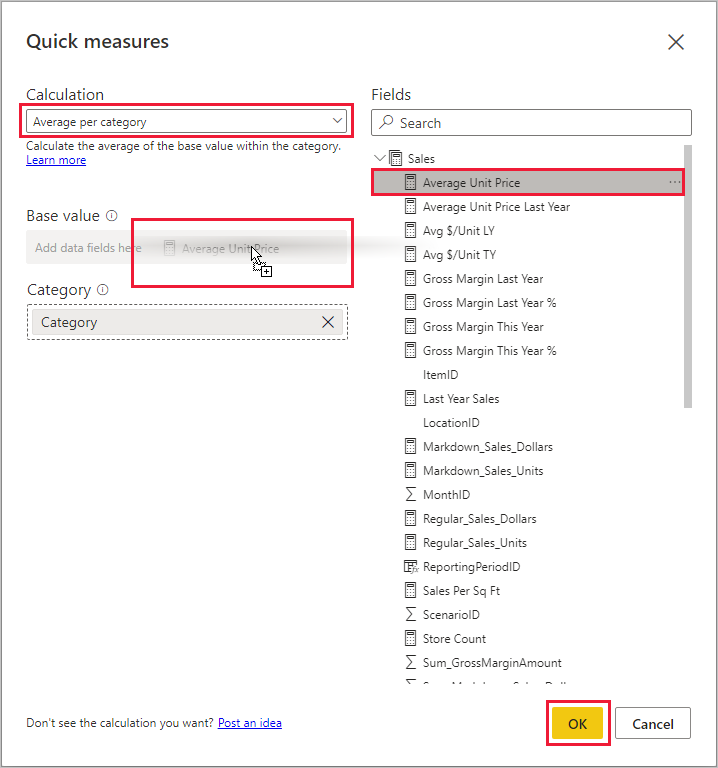
When you select OK, several interesting things happen.

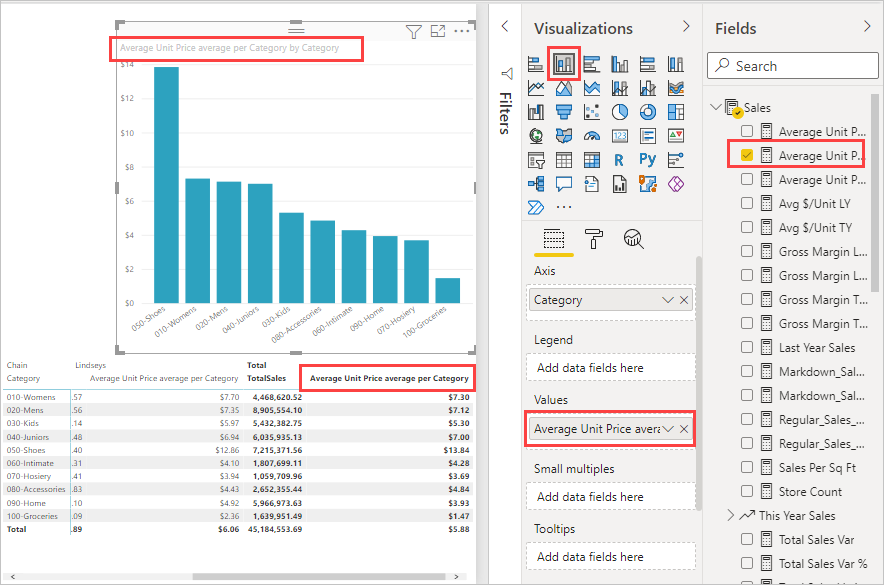
The matrix visual has a new column that shows the calculated Average Unit Price average per Category.
The DAX formula for the new quick measure appears in the formula bar. See the next section for more about the DAX formula.
The new quick measure appears selected and highlighted in the Fields pane.
The new quick measure is available to any visual in the report, not just the visual you created it for. The following image shows a quick column chart visual created by using the new quick measure field.
Learn DAX by using quick measures
A great advantage of quick measures is that they show you the DAX formula that implements the measure. When you select a quick measure in the Fields pane, the Formula bar appears, showing the DAX formula that Power BI created to implement the measure.

The formula bar not only shows you the formula behind the measure, but more importantly, lets you see how to create the DAX formulas underlying quick measures.
Imagine you need to do a year-over-year calculation, but you're not sure how to structure the DAX formula, or you have no idea where to start. Instead of banging your head on the desk, you can create a quick measure by using the Year-over-year change calculation, and see how it appears in your visual and how the DAX formula works. Then you can either make changes directly to the DAX formula, or create a similar measure that meets your needs and expectations.
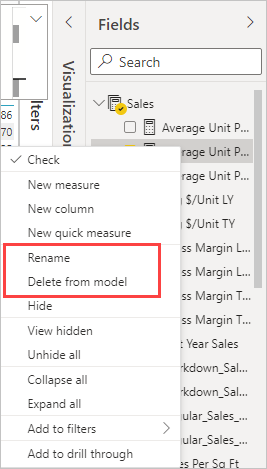
You can always delete quick measures from your model if you don't like them by right-clicking or selecting the ... next to the measure and selecting Delete from model. You can also rename a quick measure whatever you like by selecting Rename from the menu.
Considerations and limitations
There are a few considerations and limitations to keep in mind.
- You can use quick measures added to the Fields pane with any visual in the report.
- You can always see the DAX associated with a quick measure by selecting the measure in the Fields list and looking at the formula in the formula bar.
- Quick measures are only available if you can modify the model. One exception is the case when you're working with some Live connections. SSAS tabular live connections are supported, as previously described.
- You can't create time intelligence quick measures when working in DirectQuery mode. The DAX functions used in these quick measures have performance implications when translated into the T-SQL statements that are sent to your data source.
Important
DAX statements for quick measures use only commas for argument separators. If your version of Power BI Desktop is in a language that uses commas as decimal separators, quick measures will not work properly.
Time intelligence and quick measures
You can use your own custom date tables with time intelligence quick measures. If you're using an external tabular model, make sure that when the model was built, the primary date column in the table was marked as a date table. For more information, see Specify Mark as Date Table for use with time-intelligence. If you're importing your own date table, make sure to mark it as a date table, as described in Set and use date tables in Power BI Desktop.
Additional information and examples
Have an idea for a quick measure that isn't already provided? Great! Go to the Power BI Ideas page, and submit your ideas and DAX formulas for quick measures you'd like to see in Power BI Desktop. We'll consider adding them to the quick measures list in a future release.
Related content
Other articles of interest: