Примітка
Доступ до цієї сторінки потребує авторизації. Можна спробувати ввійти або змінити каталоги.
Доступ до цієї сторінки потребує авторизації. Можна спробувати змінити каталоги.
We're excited to announce the availability of Visual Studio 2022 v17.14. This update focuses on stability and security, along with AI improvements for all developers.
Download Visual Studio 2022 v17.14 to enjoy these new features and improvements.
Features
All the new features in the latest release.
GitHub Copilot
Copilot Agent Mode
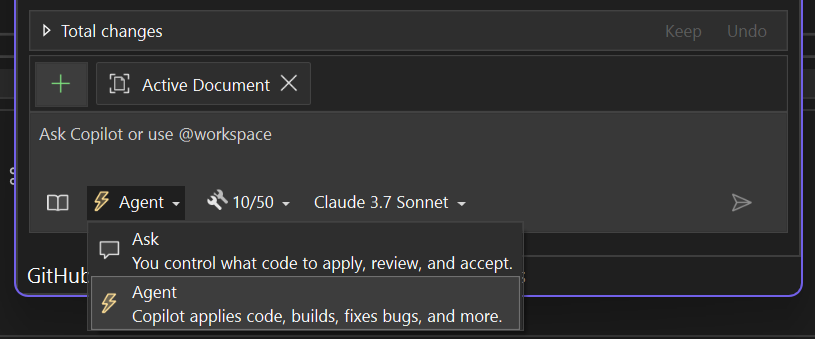
Copilot Agent Mode is the next evolution in AI-assisted development and has moved out of preview.
It unlocks a new way to build with GitHub Copilot, going beyond single-turn prompts to handle entire tasks from start to finish.
To get started, open Copilot Chat, click the Ask button, and switch to Agent.
From Idea to Code
Agent Mode understands your intent, creates a plan, pulls in the right context, and takes action. It can fix bugs, edit files, and build your solution—all from a single prompt until your goal is reached.
With MCP integration, Agent Mode can also pull in rich context from your connected systems—like GitHub, CI pipelines, or monitoring dashboards—to take even smarter actions.
Try it out and see what improvements it can offer!
Important
Activate GitHub Copilot Free and unlock this and other AI features. No trial. No credit card. Just your GitHub account.
Gemini 2.5 Pro and GPT-4.1
New Models just dropped in Visual Studio Chat.
More power, speed, and flexibility — all within your IDE!
🚨 Gemini 2.5 Pro is now in Visual Studio
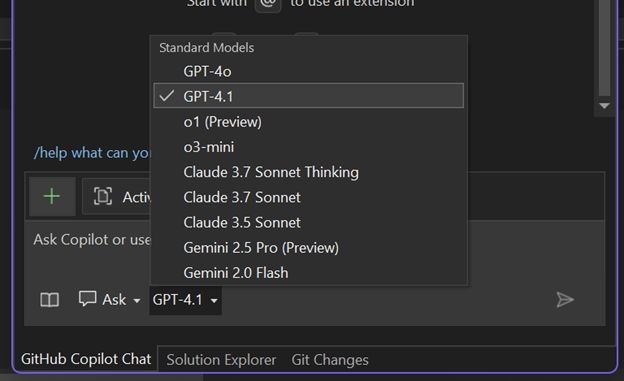
Gemini 2.5 Pro, widely regarded as one of the top-performing models available, is now supported in Visual Studio. It joins GPT-4.1, GPT-4o, Claude Sonnet 3.7, Claude Sonnet 3.5, and o3 mini to bring a truly versatile multi-model AI experience to your IDE.
🚨 GPT-4.1 is now the default
GPT-4.1 is now the default model in Visual Studio, offering a faster, more responsive, and noticeably smoother experience across the board.
You can now select the best model for the task, code, and workflow at hand. Try them out and let us know what you think!
Important
Activate GitHub Copilot Free and unlock this and other AI features. No trial. No credit card. Just your GitHub account.
Claude Sonnet 4 and Claude Opus 4
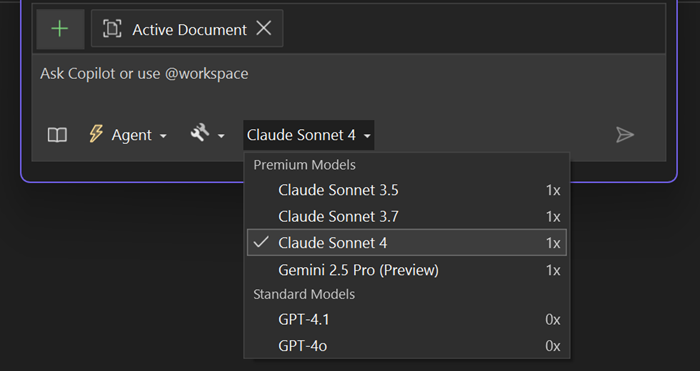
Claude Sonnet 4 and Claude Opus 4 are now generally available in Visual Studio, offering enhanced AI capabilities.
We're excited to announce that Claude Sonnet 4 and Claude Opus 4 are now generally available to all Visual Studio customers!
- Use Claude Sonnet 4 in Agent Mode for faster, more focused interactions.
- Try both Claude Sonnet 4 and Opus 4 in Ask Mode for deeper reasoning.
To get started, open Chat in Visual Studio, select the model picker, and choose the Claude model that fits your workflow.
Important
Activate GitHub Copilot Free and unlock this and other AI features. No trial. No credit card. Just your GitHub account.
MCP server support
Connect Visual Studio to AI agents using the new Model Context Protocol (MCP) — a standardized way to share context, access data, and drive intelligent features.
Visual Studio now supports MCP servers, unlocking smarter and more connected AI development. MCP is an open protocol that standardizes how apps and AI agents share context and take action.
With MCP in Visual Studio, you can do more than just retrieve information from your MCP servers, such as logs, test failures, PRs, or issues. You can also use that information to drive meaningful actions in your code, your IDE, and even your connected systems across your stack.
Set Up Your MCP Server
Add an
mcp.jsonfile to your solution, and Visual Studio will detect it automatically. It also recognizes configs from other environments like.vscode/mcp.json.Use Your MCP Servers
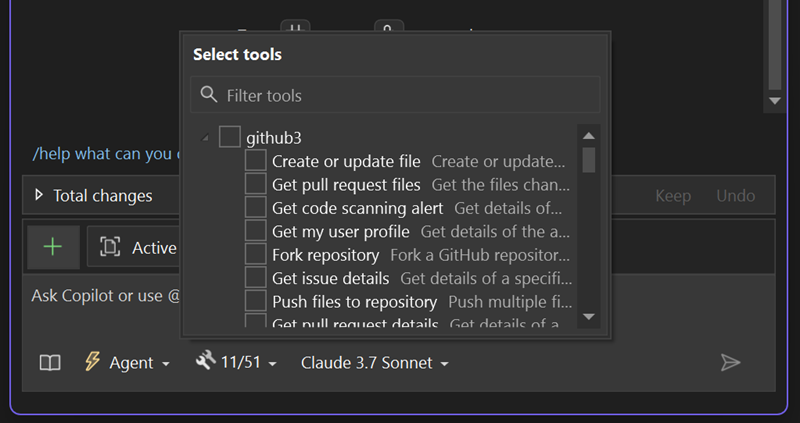
Open the Tools dropdown in the Copilot Chat panel to view connected MCP servers. From there, Copilot can pull in context and take action using your existing systems.
Note: You will need to be in Agent Mode to access and interact with MCP servers.
Bring the full power of your stack into Copilot without leaving Visual Studio!
Important
Activate GitHub Copilot Free and unlock this and other AI features. No trial. No credit card. Just your GitHub account.
MCP Server July Update
Enhanced MCP server integration in Visual Studio enables seamless connection of your entire engineering stack directly into Copilot for a more powerful development experience.
We've made significant improvements to MCP server integration in Visual Studio to help you unlock a more powerful, connected engineering stack.
Set Up Your MCP Server
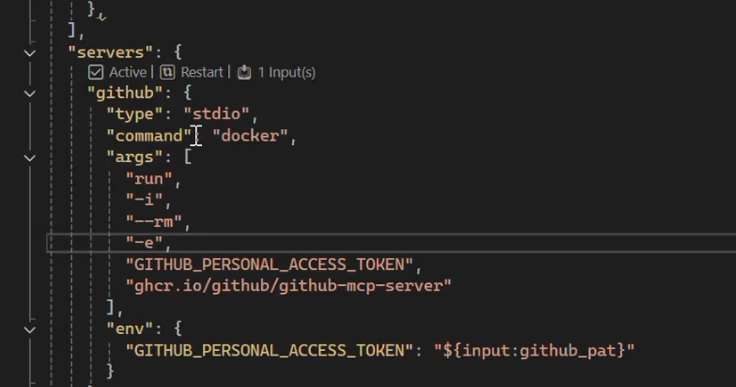
Add an
mcp.jsonfile to your solution — Visual Studio will detect it automatically (we also support.vscode/mcp.json). Start and manage servers directly with CodeLens controls at the top of each server block. Easily restart, run, and control inputs from within the editor.With seamless authentication via keychain support, you can now authenticate with supported MCP servers directly in Visual Studio using your existing keychain credentials — no additional configuration needed.
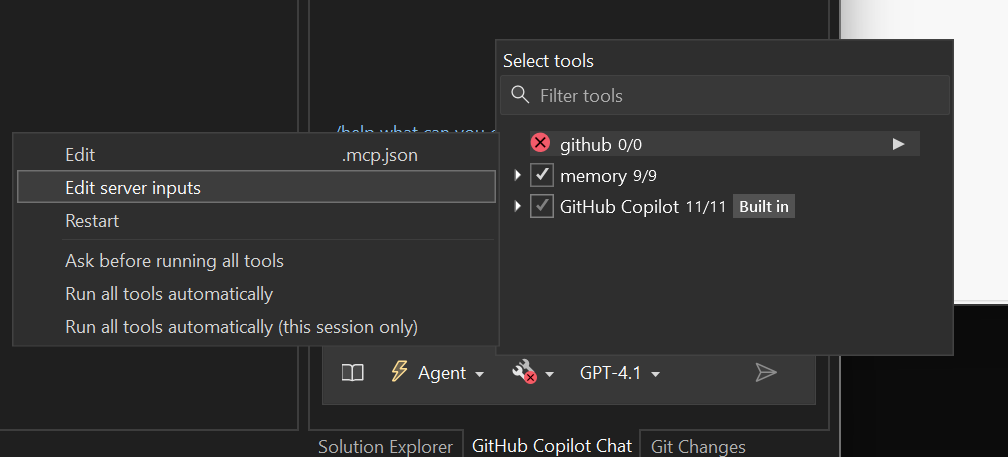
Use Your MCP Servers
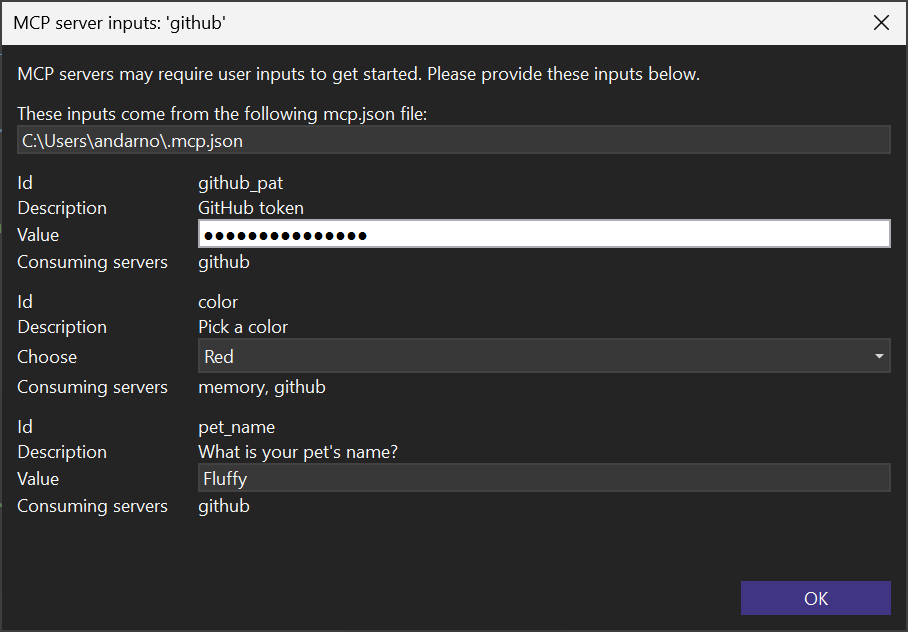
Open the Tools dropdown in the Copilot Chat panel to view connected MCP servers and manage them by selecting the arrow to reveal the new menu. From there, you can manage server inputs in our new modal dialog. Copilot can then pull in context and take action using your existing systems.
Note: You will need to be in Agent Mode to access and interact with MCP servers.
Visual Studio now supports the new Authentication protocol for MCP servers
With seamless authentication via keychain support, you can now authenticate with supported remote MCP servers directly in Visual Studio using your existing keychain credentials — no additional configuration needed. This is currently supported for GitHub and Entra ID accounts, with support for additional OAuth providers coming in a later update.
Codelens support for MCP servers
Visual Studio now supports CodeLens for MCP servers, allowing you to start and manage servers inputs and authentication directly from the editor. This makes it easier to control your development environment without leaving your code.
Bring the full power of your stack into Copilot without leaving Visual Studio!
Important
Activate GitHub Copilot Free and unlock this and other AI features. No trial. No credit card. Just your GitHub account.
Copilot output window context
You can now reference the Output Window as context in Copilot Chat.
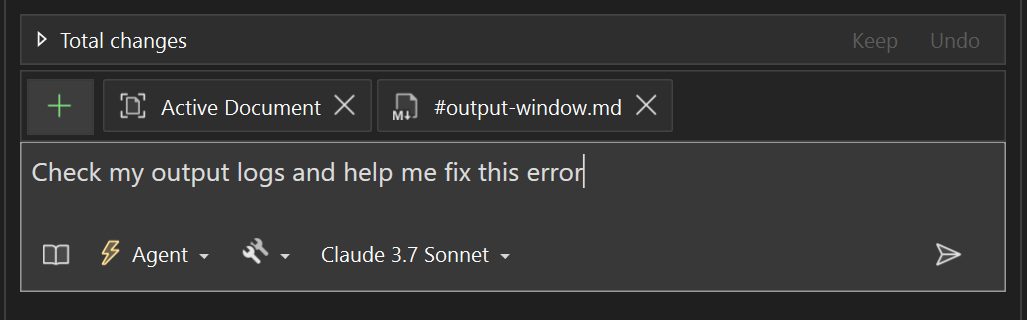
We know the Output Window is essential for tracking builds, debugging, and understanding what is going on under the hood. Now, Copilot can read that information - so you can ask questions, get help, and take action based on your output logs.
How to Use It
- Use
#outputto reference it directly in chat.- Click the ➕ icon in the chat input to add it as context.
- Ask Copilot directly: Check my output logs and help me fix this error.
- Or right-click in the Output Window and choose Explain with Copilot to attach it instantly.
Try it out and see how much easier it is to read and act on your logs!
Important
Activate GitHub Copilot Free and unlock this and other AI features. No trial. No credit card. Just your GitHub account.
See your Copilot usage
You can now track your Copilot usage directly in Visual Studio.
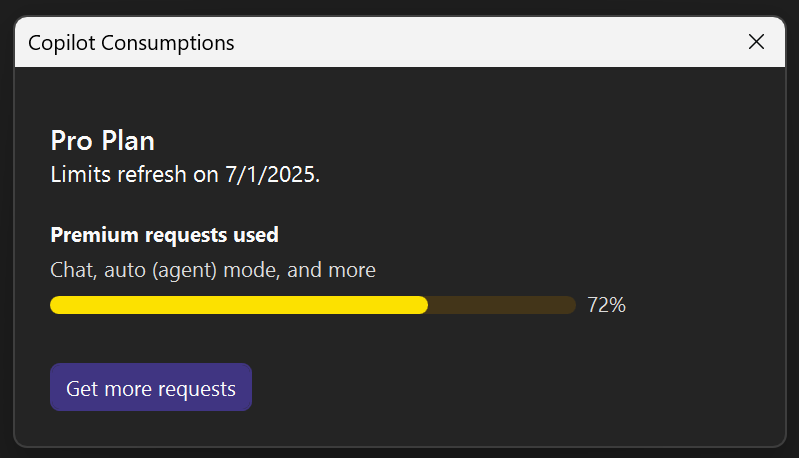
Want to know how much you've used Copilot this month? Visual Studio now includes a Copilot Consumptions panel to easily track your usage!
Whether you're using Copilot Free or a paid plan, you can check your number of chat requests and code completions right from the IDE.
Access it by clicking the Copilot badge in the top-right corner of your IDE and selecting Copilot Consumptions.
This opens a panel showing your current usage for the month.
Tip: If you're using premium models, you'll also see usage multipliers listed in the model picker, so you always know exactly what you're using.
Important
Activate GitHub Copilot Free and unlock this and other AI features. No trial. No credit card. Just your GitHub account.
Save or share your prompts with prompt files
You can now create reusable prompt files in your repository to quickly run or share your frequently used prompts.
Writing effective prompts can be time consuming, but it's the key to getting the most out of Copilot Ask and Agent mode. We've enabled reusable prompt files to allow you to leverage these great prompts again and again. From there, you can run quickly from the chat window or share with your team.
How to Write Prompt Files
- Write your prompts the way you normally would in the prompt box, attaching # references to add specific information from your solution like methods, classes, and files. You can even reference other prompt files to include common base instructions.
- Then, copy it from the prompt box into a markdown file, and save it with the .prompt.md file extension in the root of your repository in the
.github/promptsfolder.Tip: You can even get Copilot's help in refining your prompt to be more specific
How to Run Your Prompts
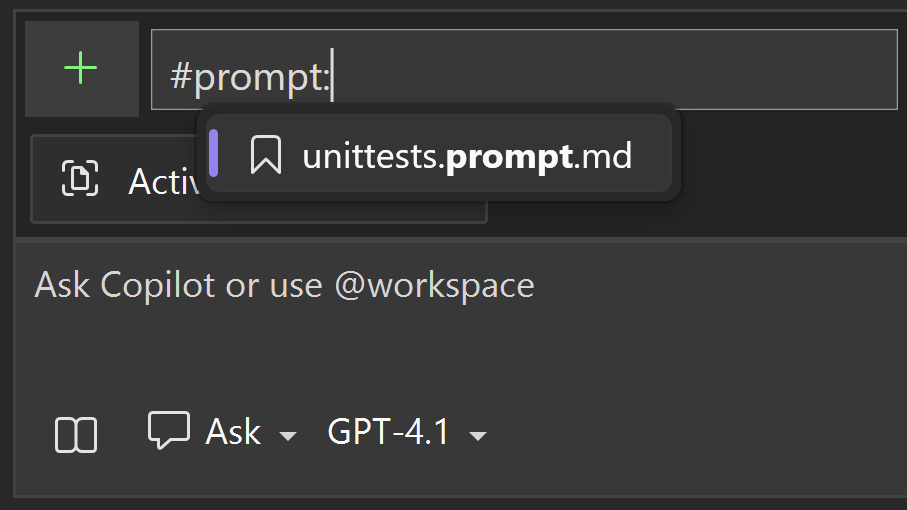
- Start typing
#prompt:to reference all the prompt files from your.github/promptsfolder directly in chat or click the ➕ icon in the chat input to add it as context.- Add any additional information in the prompt box or just send the prompt!
Give it a try and speed up your AI workflows!
📣 Take this survey to help make the feature even better.
Important
Activate GitHub Copilot Free and unlock this and other AI features. No trial. No credit card. Just your GitHub account.
GitHub Copilot Walkthrough
GitHub Copilot Walkthroughs are now available in Visual Studio to help you get up and running quickly. Walkthroughs guide you through using key Copilot features directly in your editor.
We're excited to introduce the GitHub Copilot Walkthrough in Visual Studio! The Walkthrough is an interactive guide built right into your editor, helping you explore GitHub Copilot's capabilities step-by-step. Whether you're new to GitHub Copilot or want to learn about its latest features, the walkthrough makes it easier than ever to get started.
Getting Started with Walkthroughs
You can launch Copilot Walkthroughs directly from Visual Studio by going to Copilot button (upper right) → GitHub Copilot Walkthrough.
Once opened, you'll see guided activities that introduce you to different parts of the Copilot experience, such as:
Writing prompts in Chat
Using inline code completions
Accepting, editing, or rejecting Copilot suggestions
Exploring and learning about new features like Copilot Edits
The walkthrough is a great way to get a high-level understanding of what Copilot can do before diving deeper into the documentation and hands-on usage!
How to Access Walkthroughs
The GitHub Copilot walkthrough automatically opens the first time you sign into GitHub Copilot, making it super easy to get started! If you want to revisit it later, simply go to GitHub Copilot > GitHub Copilot Walkthrough in Visual Studio.
Whether you're exploring GitHub Copilot for the first time or just need a quick refresher, this walkthrough is your friendly guide to unlocking the full potential of Copilot. Dive in and start creating with confidence!
Important
Activate GitHub Copilot Free and unlock this and other AI features. No trial. No credit card. Just your GitHub account.
GPT-4o code completion model 📣
Introducing the GPT-4o Copilot code completion model to bring you higher quality completions.
We are thrilled to announce that the new GPT-4o Copilot code completion model is now available in Visual Studio 17.14 for GitHub Copilot users! This advanced model, based on GPT-4o mini, has been further trained on over 275,000 high-quality public repositories across more than 30 popular programming languages. As a result, developers can look forward to more accurate suggestions and enhanced performance.
GPT-4o Copilot access notes:
- Copilot Pro, Business, or Enterprise users: The new model is available for you now in 17.14 and later.
- Copilot Free users: Using this model will count toward your 2,000 free monthly completions.
📣 See feature ticket to share your feedback and continue the conversation.
Important
Activate GitHub Copilot Free and unlock this and other AI features. No trial. No credit card. Just your GitHub account.
AI doc comment generation 📣
Automatically generate doc comments for C++ and C# functions.
Copilot is now seamlessly integrated into Visual Studio's code editor to significantly boost your productivity by generating doc comments for your functions.
With automatic doc comment generation enabled for your project, you can simply type the comment pattern according to your settings configuration (e.g.,
///), and Copilot will instantly complete the function description based on the function's content. This feature saves you valuable time and effort, allowing you to focus more on coding and less on documentation.
This game-changing feature is available for both C++ and C# project files, making your coding experience smoother and more efficient.
📣 See feature ticket to share your feedback and continue the conversation.
Important
Activate GitHub Copilot Free and unlock this and other AI features. No trial. No credit card. Just your GitHub account.
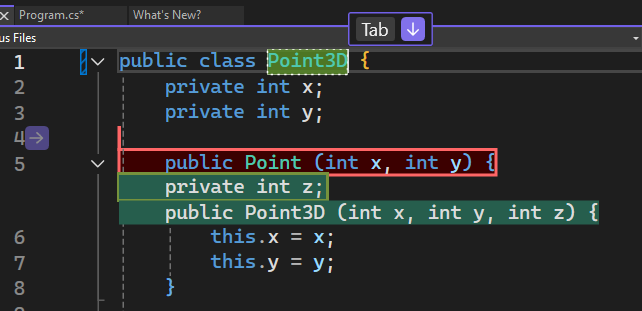
Next Edit Suggestion
NES leverages the previous edits made and predicts the next edit to come, whether it's an insertion, deletion, or mix of both.
We are excited to announce Next Edit Suggestions, or NES for short, is now available in Visual Studio to further improve your coding experience. NES leverages the previous edits made and predicts the next edit to come, whether it's an insertion, deletion, or mix of both. Unlike Completions which is limited to generate suggestions at your caret location, NES can support you anywhere in your file, where the next edit is most likely to occur. NES augments the existing Copilot Completions experience by supporting developers' code editing activities.
Getting Started with NES
Enable NES via Tools → Options → GitHub → Copilot → Copilot Completions → Enable Next Edit Suggestions.
Like completions, all you need to do to get NES is to start coding!
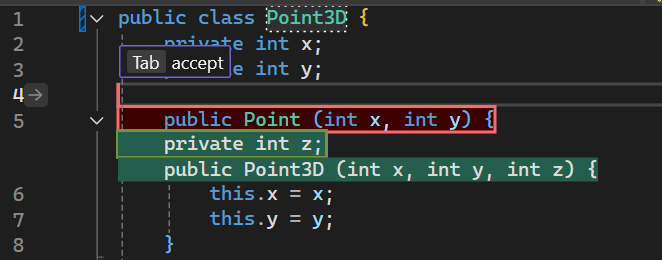
When you're presented with an edit suggestion, if it is on a different line than the one you are on now, it will suggest you Tab to Navigate to the corresponding line first. You won't need to manually search for related edits anymore; NES will lead the way!
After you are on the same line as the edit, you can Tab to Accept the suggestion.
Note: You can turn on/off the hint bars by going to Tools → Options → IntelliCode → Advanced → Hide the tip shown with gray text.
In addition to the hint bars, an arrow in the gutter also pops up to indicate that there is an edit suggestion available. You can click on the arrow to explore the edit suggestion menu.
Example Scenarios
Next edit suggestions can be helpful in a variety of scenarios, not only making obvious repetitive changes but also logical changes. Here are some examples:
Refactoring a 2D Point class to 3D Point:
Updating code syntax to modern C++ using STL:
Note that NES is not just making repetitive changes like updating all
printf()tostd::cout, but also updating other syntax such asfgets().
Making logical changes in response to a newly added variable:
NES responds quickly to the new variable, which adds a maximum number of guesses a player can make in a game, and Copilot Completions also jumps in to help.
Important
Activate GitHub Copilot Free and unlock this and other AI features. No trial. No credit card. Just your GitHub account.
Adaptive paste
You can now let Copilot adjust your pasted code to fit the context of your existing code.
When you're pasting code into Visual Studio, there are often additional steps required to make it work seamlessly. Parameters may need to be adjusted to match those already used in your solution, or the syntax and styling may not align with the rest of your document.
Adaptive paste is here to save you time and reduce effort by automatically adjusting the pasted code to fit the context of your existing code, minimizing the need for manual modifications. This feature also supports scenarios such as minor error fixes, code styling, formatting, human and code language translation, and fill-in-the-blank or continue-the-pattern tasks.
For instance, if you have a
Mathclass that implements theIMathinterface, copying and pasting the implementation for theCeilingmethod into the same file will adapt it to implement the not yet implemented interface memberFloor.
The adaptive paste UI will appear when you perform a regular paste {KeyboardShortcut:Edit.Paste}. Simply press the
TABkey to request a suggestion, and you'll be shown a diff comparing the original pasted code with the adjusted code.Try it out today by enabling the option Tools → Options → GitHub → Copilot → Editor → Enable Adaptive Paste.
Important
Activate GitHub Copilot Free and unlock this and other AI features. No trial. No credit card. Just your GitHub account.
Implement with Copilot
You can now let Copilot fully implement your empty C# method.
Today, if you're referencing a method in your C# code that hasn't been implemented yet, you can use a common lightbulb refactoring called Generate Method to immediately create that method in a class. However, this refactoring only creates a method with the correct signature but an empty skeleton and
throw new NotImplementedExceptionline otherwise. This means that while the method technically exists and you have to do less work to create it, you'll still need to implement the method yourself, which can take more time.The Implement with Copilot refactoring aims to make you even more productive in this scenario by allowing you to automatically implement or add the meat to your method with the help of GitHub Copilot. When an empty method only containing a NotImplementedException throw is encountered, you can select the lightbulb (CTRL+.) on that
throwline and select the Implement with Copilot refactoring and Copilot will fill out all the contents of your method based on your existing codebase, method name, etc.
Important
Activate GitHub Copilot Free and unlock this and other AI features. No trial. No credit card. Just your GitHub account.
Debugging & diagnostics
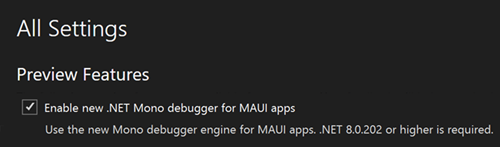
New debugger for .NET MAUI apps
New Mono debug engine for .NET MAUI integrated into the Visual Studio Core debugger.
The new Mono debugger for .NET MAUI apps is an advanced debug engine integrated into the Visual Studio debugger. It offers significant improvements in reliability, performance, and feature parity with the rest of Visual Studio.
Notable enhancements include Just My Code, variables, and expression evaluation.
To use this feature, ensure you have enabled the following Visual Studio Preview option: Enable new .NET Mono debugger for MAUI apps.
Currently, this feature is only available for the Android platform. iOS support is coming soon.
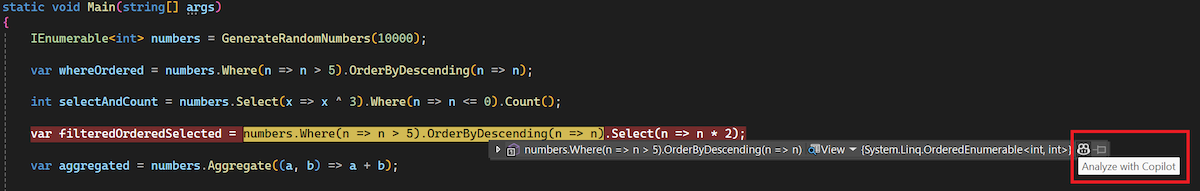
Show datatips for LINQ Expressions 📣
Enhanced LINQ expression debugging experience with clause hovering datatip.
Generating and troubleshooting LINQ queries can be a tedious and intricate process, often requiring precise syntax knowledge and numerous iterations. To alleviate these challenges, Visual Studio 2022 now features a LINQ on-hover DataTip in its debugger.
While you are in a break state during debugging, you can hover over individual clauses or segments of your LINQ query to evaluate the immediate query value at runtime.
Additionally, you can click the GitHub Copilot icon at the end of the DataTip to perform an Analyze with Copilot on the specific query clause you hovered over. Copilot will then explain the clause's syntax and clarify why you are getting the specified result.
This feature can significantly improve efficiency and make your debugging experience smoother and easier, helping you pinpoint issues with LINQ queries faster and streamline your overall development workflow.
📣 See feature ticket to share your feedback and continue the conversation.
Zero-Length Array Allocation Insights
The .NET Allocation Tool now identifies zero-length array allocations, helping optimize memory usage and performance.
The .NET Allocation Tool now provides detailed insights into zero-length array allocations, helping you identify and optimize unnecessary memory usage. While these allocations may seem insignificant individually, they can accumulate quickly and impact performance, especially in high-performance or memory-constrained applications.
With this update, you can investigate zero-length array allocations by clicking the Investigate link, which opens the Allocation View displaying allocation details. Double-clicking reveals code paths where these allocations occur, enabling precise optimizations. To improve efficiency, consider using
Array.Empty<T>(), a statically allocated empty array instance, to eliminate redundant memory allocations.
Git tooling
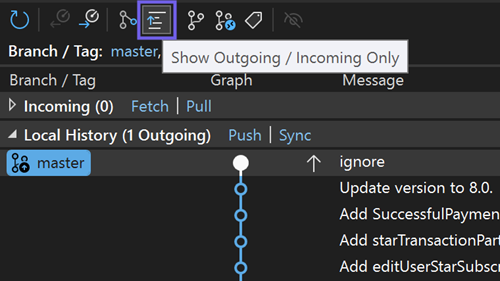
View Outgoing / Incoming Commits 📣
The Git Repository window now provides a filter at its toolbar to show only outgoing / incoming commits.
The Git Repository window is your go-to place to understand your Git history. As you work on a local branch, it may get out of sync with your remote, either because you created new commits (outgoing) or there are new commits to pull (incoming).
With the new outgoing/incoming filter available in the toolbar, you can instantly spot these unsynced commits. Your commits, their commits – scan them with ease and stay perfectly in sync!
📣 See feature ticket to share your feedback and continue the conversation.
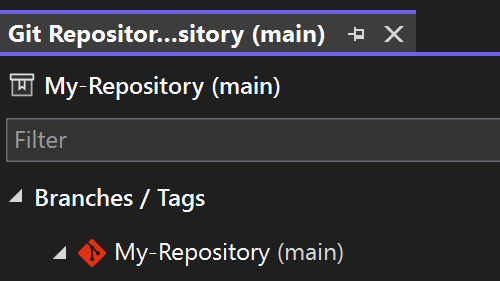
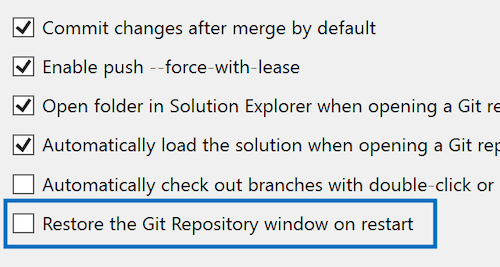
Restore the Git repository window 📣
Keep the Git Repository window open between restarts with this new setting.
As your dedicated environment for branch operations, the Git Repository window is likely at the core of your day-to-day development. If you find yourself frequently reopening it with every Visual Studio session, this update is designed to save you time and effort.
We've added a new setting to Git > Settings that automatically restores the Git Repository window when restarting Visual Studio. Additionally, the window will be included in your saved window layouts, enhancing your customization options.
By default, this feature is off to keep things running smoothly for those who don't need it. But if you like the convenience, this setting is perfect for you.
📣 See feature ticket to share your feedback and continue the conversation.
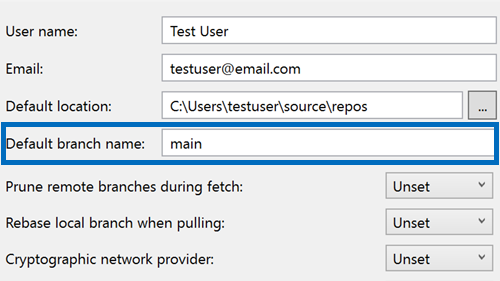
Default branch name 📣
Allow users to customize the initial default branch when a new git repository is created.
You can now set the default branch name for new Git repositories directly through Visual Studio. This new setting integrates smoothly with your Git configuration, making it easier to tailor your workflow to your preferences.
Simply navigate to Git > Settings, and the next time you create a repository, you will see your custom branch name in action.
📣 See feature ticket to share your feedback and continue the conversation.
IDE
Microsoft 365 Agents Toolkit - June
Agents Toolkit 17.14 GA June release updates.
The June release contains several fixes for 17.14 GA release:
- Enable Custom Engine Agent launch and preview in Microsoft 365 Copilot.
There is a Custom Engine Agent template available in our toolkit which is called Weather Agent. We have updated this template to enable it to be launched and previewed in the Microsoft 365 Copilot chat. To try out, simply select the Copilot launch profile when you debug.
Fixed an error pop up when debug failed with installation of Microsoft 365 Agents playground. Now toolkit will pop up clear message and instructions on how to fix the issue.
Templates upgrade App manifest dependency to v1.21.
Several bugs in templates README file introduced by our new branding changes were fixed.
Updated the toolkit icon in extension manager.
Fixed the issue when launching Agents Playground, the required channel ID value only allows msteams and emulator. Now it allows other values like webchat.
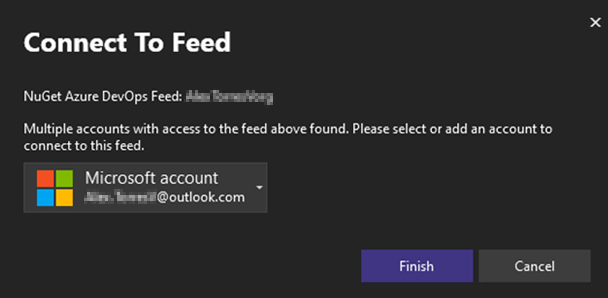
Enhanced NuGet Authentication
NuGet now provides context when asking you to provide credentials.
We've improved the NuGet authentication process. If we detect any potential authentication issues, you'll now see a new authentication dialog that provides context about the feed and the specific account needs.
This update enhances the reauthentication process for multi-factor authentication (MFA) scenarios, resolves issues with consecutive authentication prompts, and ensures a smoother overall experience when managing private NuGet feeds.
Microsoft 365 Agents Toolkit
Teams Toolkit 17.14 GA updates.
We are excited to announce that our product, previously known as Teams Toolkit, is being renamed to Microsoft 365 Agents Toolkit. This change reflects our expanded focus and commitment to support a broader range of platforms and project types within the Microsoft 365 ecosystem.
As we continue to enhance our product, we are shifting our focus from solely supporting Teams development to empowering developers to create Microsoft 365 Copilot agents and other applications across the Microsoft 365 platform. These platforms include Microsoft 365 Copilot, Microsoft Teams, Office family and Outlook. This expansion in scope allows us to better serve our users by providing comprehensive tools, templates and resources for developing a wide variety of Microsoft 365 solutions.
The new name, Microsoft 365 Agents Toolkit, better represents the diverse functionalities and capabilities of our product. We believe this change will help our users more easily identify the full range of development opportunities available within the Microsoft 365 environment.
Thank you for your continued support as we evolve to meet the growing needs of our developer community.
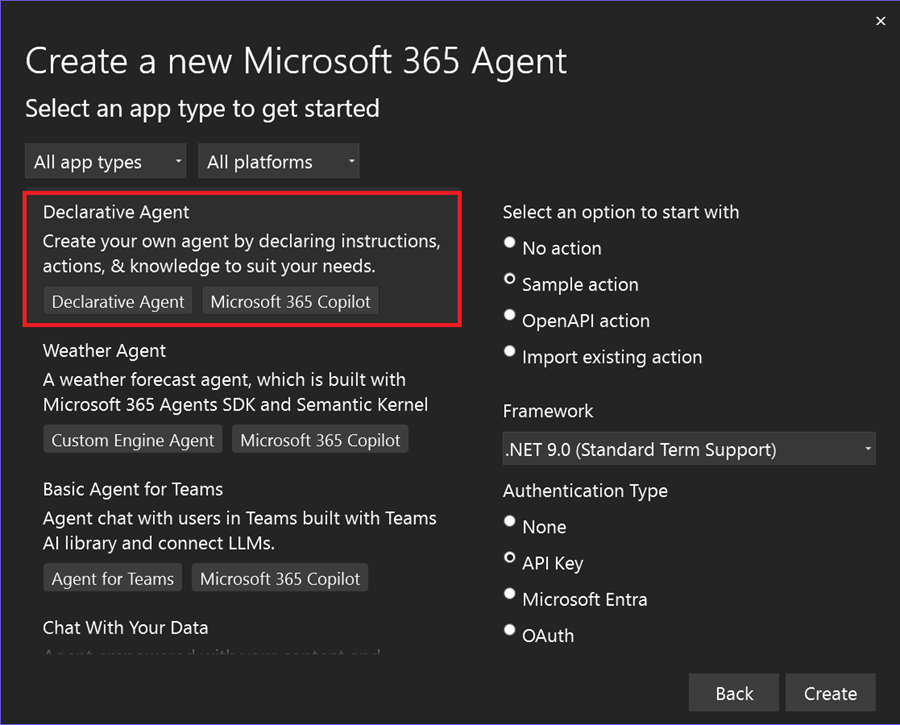
Create declarative agent
We're excited to announce that in this release we added project templates for building Declarative Agents for Microsoft 365 Copilot.
You can create a Declarative Agent with or without an action. You can choose to define new APIs or utilize existing ones to perform tasks or retrieve data.
Use Microsoft 365 Agents Toolkit to debug and preview your Declarative Agents in Microsoft Copilot.
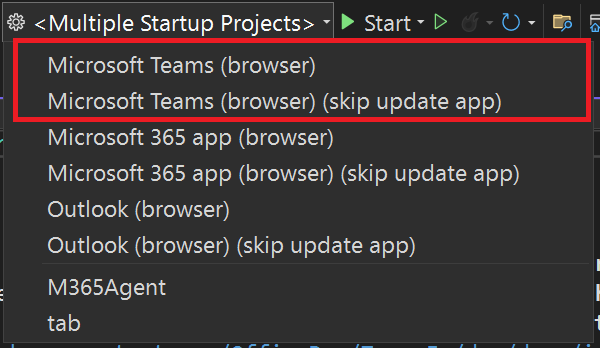
Enable smooth one-click debug
In previous versions of Teams Toolkit, which is now called Microsoft 365 Agents Toolkit, when users debugged any solution generated, you needed to use the command Prepare Teams app dependency before debugging the project. This command triggered the toolkit to help developers create essential resources for debugging, such as registering or updating the Teams app.
To enhance the debugging experience and make it more intuitive for Visual Studio users, we have removed this step and enabled one-click debugging experience. Now, you can directly click the debug button without any preparation steps. However, if you have made edits to your app manifest between two debug events and need to update your app, there remains an option to do that. We offer two debug profiles:
- Debug with updating app: Select the default profile
[Your Target Launch Platform] (browser)if you have made edits to your app to ensure the updates are applied.- Debug without updating app: Choose the second profile
[Your Target Launch Platform] (browser) (skip update app)to skip updating the app resources, making debugging lighter and quicker.Upgrade to .NET 9
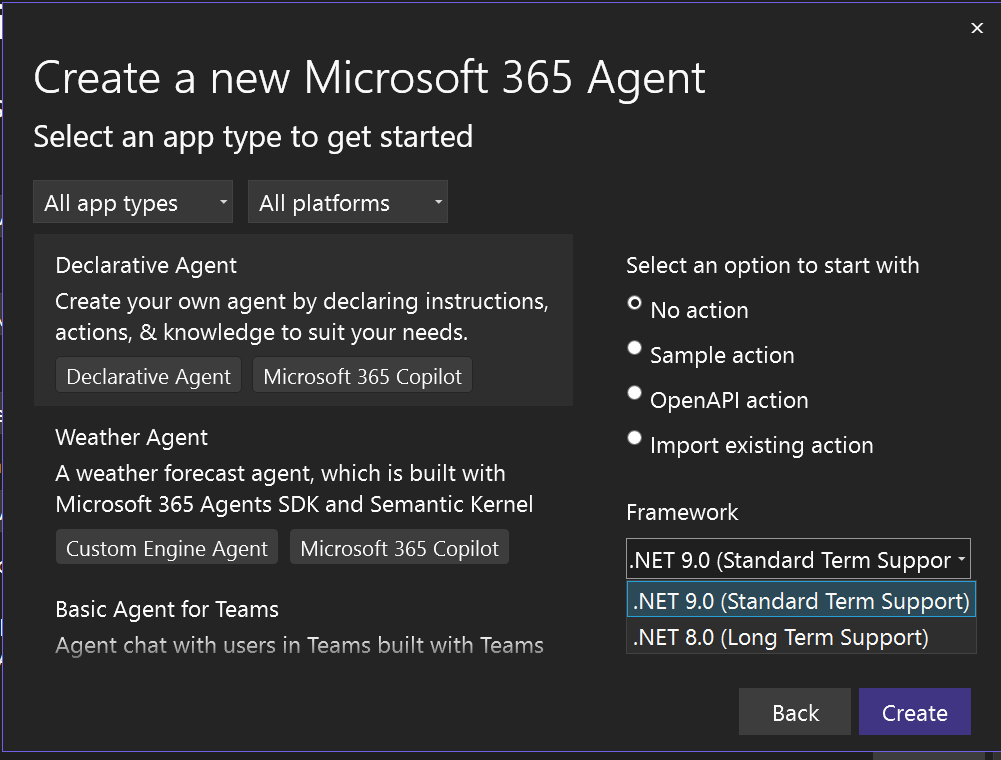
Additionally, in this release, we have refreshed all project templates to support .NET 9.
Happy coding!
The Microsoft 365 Agents Toolkit Team
Preserve font preferences across themes 📣
Changing themes will now preserve your font and font size preferences.
We understand that the fonts developers select when coding is a personal choice, influenced by preferences for readability, accessibility, or aesthetics. Visual Studio themes primarily focus on presentation colors and are independent of your preferred fonts.
With this update, we've introduced functionality to retain your font face and size choices when switching themes. You can now set your font preferences once and switch themes in Visual Studio without needing to reconfigure your font settings every time. Note that the colors of your fonts remain linked to the theme, as that is the purpose of themes, but your font selections will be preserved.
📣 See feature ticket to share your feedback and continue the conversation.
Desktop
Toolbox support for 32-bit assemblies
Discover your favorite Windows Forms (WinForms) controls present in the Explicit Assembly References automatically added to the Toolbox for .NET Framework projects using the WinForms out-of-process designer.
WinForms out-of-process Designer for .NET Framework projects now supports an enhanced experience by automatically discovering and displaying controls present in standalone assembly references, also known as Explicit Assembly References.
This feature greatly enriches the design time experience for .NET Framework projects referencing legacy 32-bit assemblies. Users can leverage improved tool configurations tailored for better integration with modern development workflows and enhanced productivity. For more details, please read our blog post.
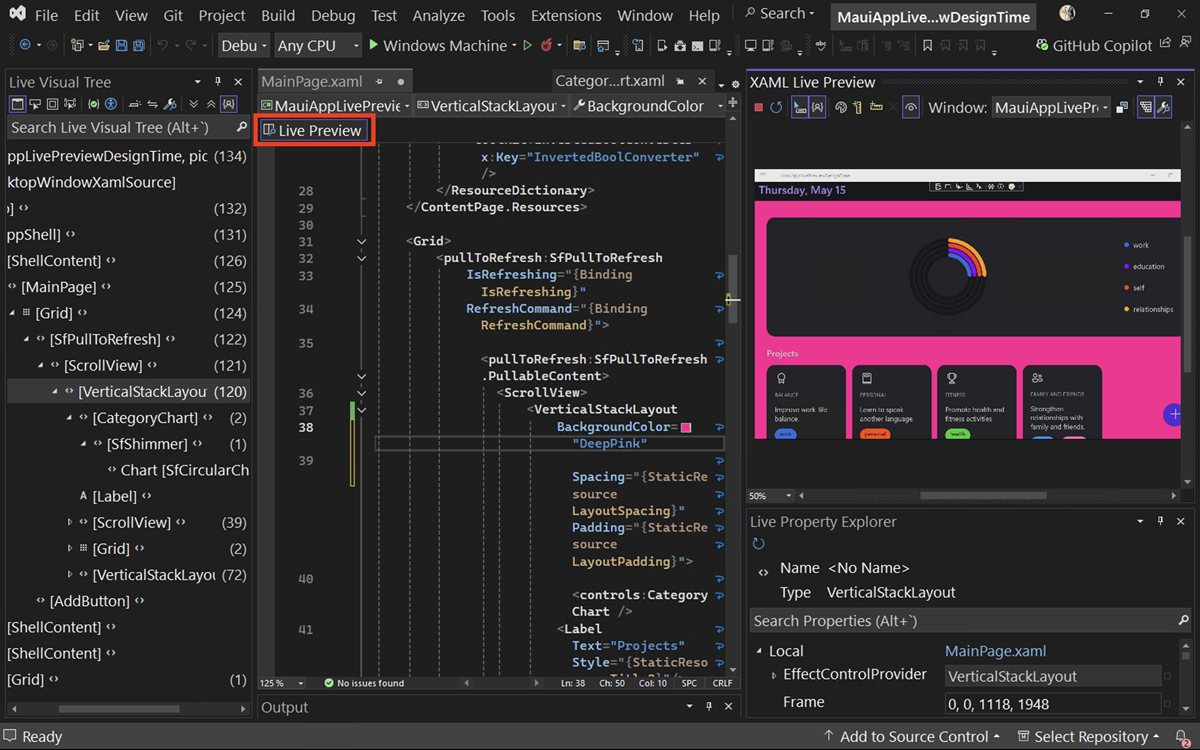
Update your UI, live at design time 📣
Live Preview, Hot Reload, and other UI tools are now available at design time.
Live Preview is now available at design time, allowing you to see changes in your app UI in real-time. You can also use Hot Reload and other live UI tools in this way, ensuring a seamless workflow.
These tools can be used even when detached from the debugger, allowing for uninterrupted experimentation and refinement of your designs.
Click on the new Live Preview indicator to access Live Preview at design time from any XAML file:
Whether you're working on a new .NET MAUI app or refining an existing WPF app, these enhancements will help you deliver high-quality applications faster and with greater confidence.
📣 See feature ticket to share your feedback and continue the conversation.
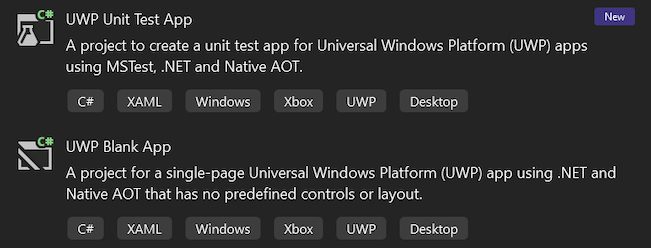
New UWP .NET 9 MSTest project template 📣
Visual Studio now includes an updated UWP MSTest project template targeting .NET 9 and Native AOT.
Visual Studio now includes a new UWP MSTest project template targeting .NET 9 and Native AOT. We worked closely with the MSTest team to add all necessary support for UWP .NET 9 projects to the MSTest libraries, infrastructure, and the Visual Studio test host. This enables UWP test projects to target .NET 9 and leverage all the modern .NET SDK and MSTest tooling while still running in a UWP context as you'd expect.
The previous UWP MSTest project template using .NET Native will still be available. However, we recommend using the new project templates targeting .NET 9 and Native AOT going forward. As in Visual Studio 17.13, we have adjusted the ordering of all UWP templates to prioritize the new .NET 9 project templates in the search results.
📣 See feature ticket to share your feedback and continue the conversation.
Extensibility
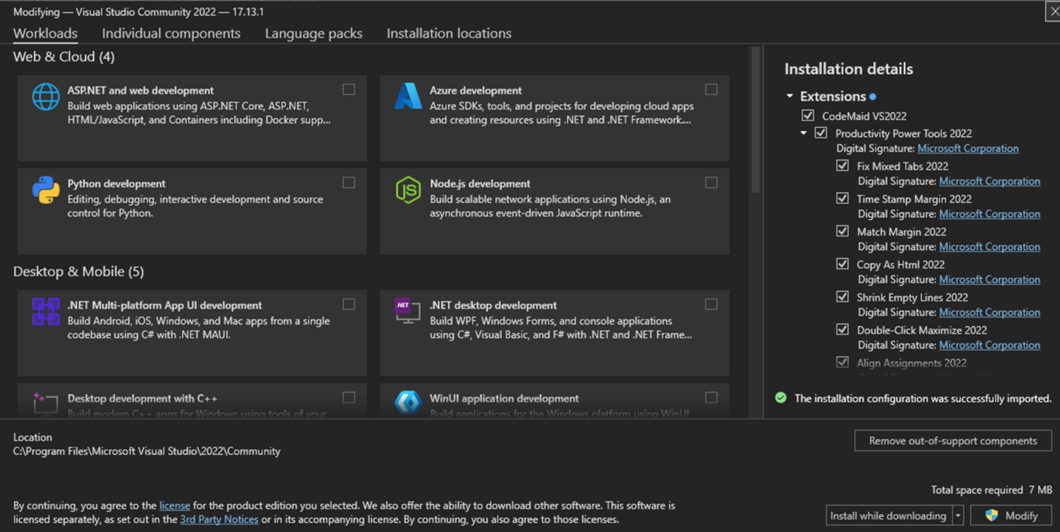
Install extension packs
The installer can now handle the installation of extension packs.
The installer now supports Extension Packs, which are bundles of multiple extensions referenced from a single extension.
To use Extension Packs in the Installer, first specify the desired extensions in a .vsconfig file. Then, use the Visual Studio Installer's Import Configuration feature to import the .vsconfig file containing your extension details.
For more information on creating or generating .vsconfig files, refer to the installation configurations documentation.
After importing the .vsconfig file, you'll be directed to the modify screen where extensions will be grouped under their own heading in the installation summary pane. Here, you can select or deselect entire Extension Packs or individual extensions within any Packs.
Faster VSIX build times
VSIX projects with one or more project references now use intelligent incremental builds, drastically improving F5 scenarios and developer productivity.
If you're developing Visual Studio extensions with multiple projects, you'll love this performance enhancement! VSIX projects with one or more project references will now only build projects that actually need rebuilding, making your development workflow significantly faster.
How it works
The Fast Up-to-Date Check system has been improved to be smarter about determining which projects in your solution need rebuilding:
- If you modify Project A which depends on Projects B and C, only Project A will be rebuilt
- If you modify Project B, only Projects A and B will be rebuilt
- This intelligence extends throughout your entire project dependency tree
Real-world impact
The performance improvements are substantial in real-world scenarios. For example, the GitHub Copilot extension that ships with Visual Studio (with approximately 30 projects) saw build time improvements of over 50% for incremental changes - reducing build times from around 60 seconds to just 24 seconds!
This enhancement is particularly beneficial for:
- Large VSIX projects with multiple dependencies
- Rapid iteration development workflows
- Frequent F5 debugging sessions
Note that if your solution contains only a single project, you won't see any performance benefits from this enhancement.
Note: This only applies to SDK-Style VSIX projects.
Your extension development just got a whole lot faster - happy coding!

Extension Manager updates 📣
There are several new improvements to the Extension Manager in Visual Studio that will make it easier to manage your extensions.
We're excited to introduce a set of powerful new features in Visual Studio that streamline your workflow and improve the extension management experience. These updates ensure that you stay up to date effortlessly while giving you more control over how and when updates are applied.
What's New?
Seamless auto updates
Visual Studio will now automatically trigger updates when you open the application, ensuring you always have the latest features and fixes without manual intervention.
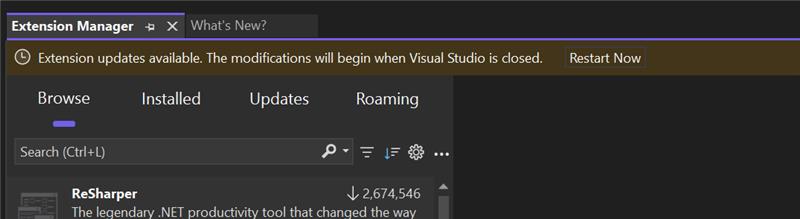
Restart gold bar for applied updates
When updates are applied, a gold bar notification will appear, prompting you to restart Visual Studio for the changes to take effect.
Auto update settings in extension page
We've made auto update settings more accessible by integrating them directly into the extension page, giving you quick access to configuration options.
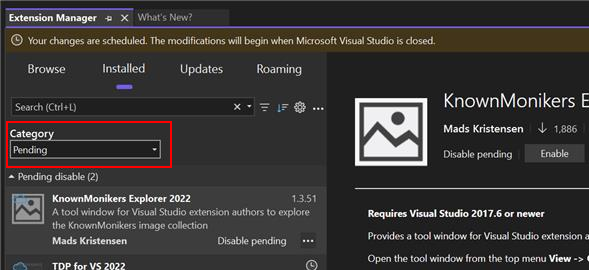
Filter by pending changes
A new Pending category now highlights pending changes, keeping you informed about updates and modifications that require attention.
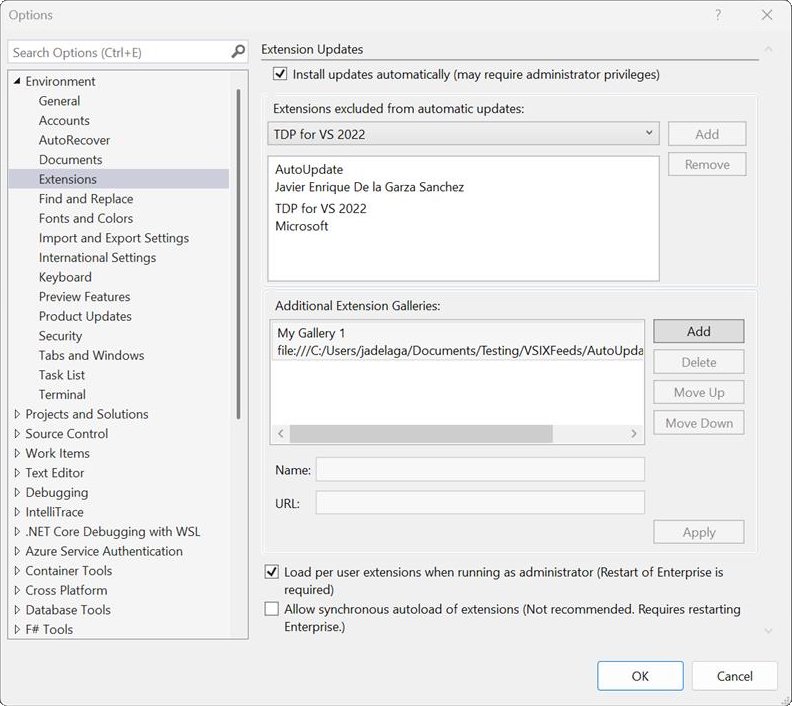
Auto update settings
In addition to the extension page, auto update settings are now available under Tools → Options → Environment → Extensions, allowing for a more intuitive settings management experience.
Simplified settings experience
We've streamlined the settings UI, making it easier to configure auto updates and other related preferences with fewer clicks and clearer options.
Excluded extensions list
Visual Studio now features an Excluded extensions list that auto-populates, helping you manage extensions that should not be updated automatically. This is particularly useful for mission-critical extensions where you prefer to control version updates manually.
These enhancements are designed to improve usability, reduce update friction, and give you greater control over your development environment while ensuring you benefit from the latest improvements.
📣 See feature ticket to share your feedback and continue the conversation.

Data
Use SDK-style SQL projects in SSDT 📣
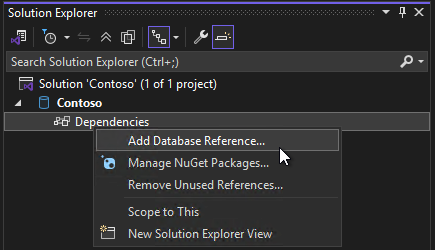
You can now use the SDK-style project file format in your SQL Server Data Tools projects with enhanced SQL debugging and schema comparison capabilities.
The update in Visual Studio 17.14 introduces new item templates and .dacpac database references to SDK-style SQL Server Data Tools (preview). SDK-style SSDT SQL projects are based on the Microsoft.Build.Sql SDK, which provides cross-platform support and improved CI/CD capabilities for SQL Server Data Tools (SSDT) projects.
With less verbose project files and database references to NuGet packages, teams can collaborate more efficiently on large databases within a single project or compile multiple sets of objects from several projects. Database deployments from a Microsoft.Build.Sql project can be automated in both Windows and Linux environments using the Microsoft.SqlPackage dotnet tool to publish the build artifact (.dacpac) from the SQL project. Learn more about SDK-style SQL projects and DevOps for SQL.
In 17.14, database references have been expanded to support project and .dacpac artifact references. Support for database references as package references will be available in a future release. A recent update to the slngen solution file generator also added support for Microsoft.Build.Sql projects, enabling the management of large solutions programmatically.
To use SDK-style SQL projects in your solution, make sure to install the latest SSDT preview component in the Visual Studio installer.
📣 See feature ticket to share your feedback and continue the conversation.

C++
Hover tooltips for CMake modules
Added support for CMake modules in IntelliSense Quick Info and completions.
We are thrilled to announce that we have added support for IntelliSense-based completions and quick info for CMake modules in Visual Studio. Now, you can view all available CMake modules and learn more about them directly from the Visual Studio editor, making your development process smoother and more efficient.
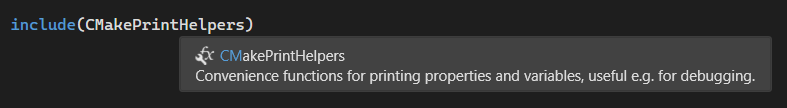
Quick Info
When you hover over a referenced CMake module, IntelliSense provides detailed information about the selected module, helping you understand its usage and functionality at a glance.
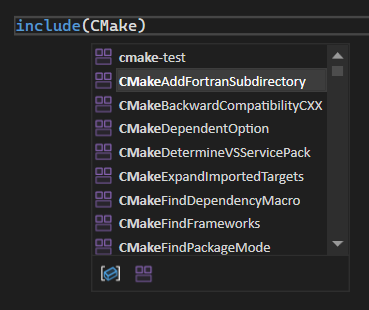
Completion
When you start typing a CMake module in your
CMakeLists.txtor other CMake script files, IntelliSense will provide a list of available modules to choose from.
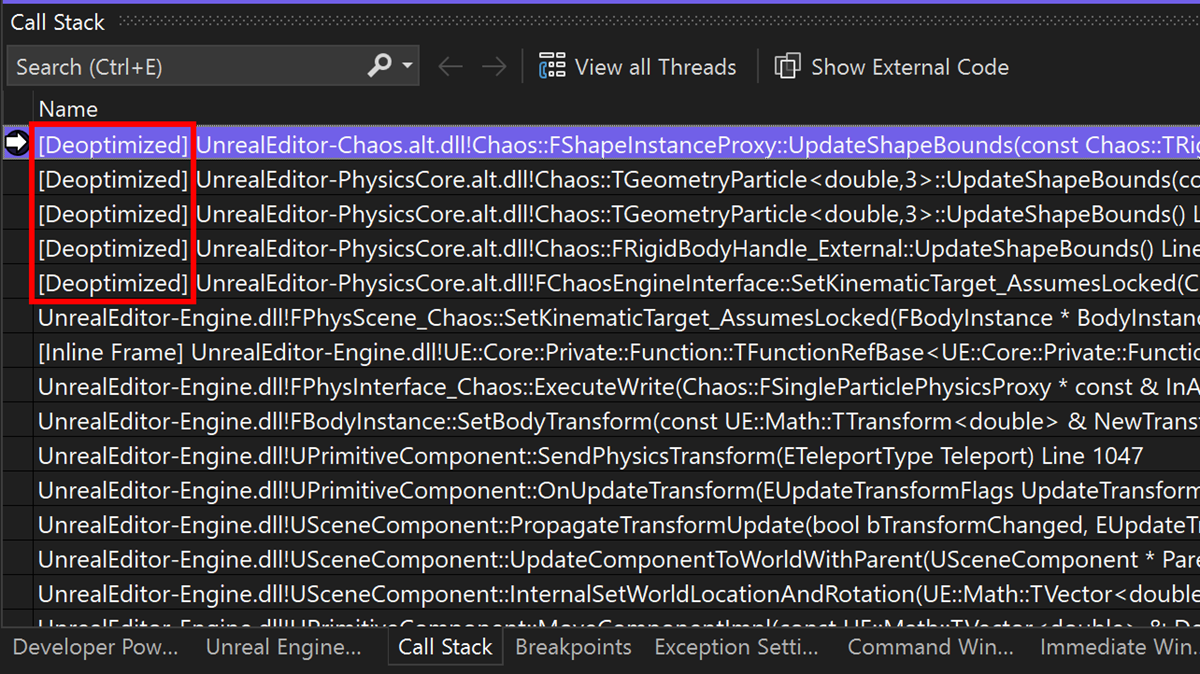
C++ Dynamic Debugging
Full debuggability for your optimized C++ code without compromising on performance.
Debugging optimized code is now easier than ever. By activating C++ Dynamic Debugging, you can debug your optimized code as if it were unoptimized. You can view all your local variables, step in anywhere, and set full-fidelity breakpoints on your optimized binaries. For more details, please read our blog post.
Populate template IntelliSense
Template IntelliSense now automatically populates template arguments by using Go To Definition (F12).
You can now automatically populate template arguments in the template bar, which displays and allows editing of template parameters, when using Go To Definition or F12.
For example, pressing F12 on
vectorwill now jump tovectorwith the template bar automatically populated, allowing developers to quickly inspect and modify template parameters.In the example below, using Go To Definition or pressing F12 will populate both the type and allocator in the template bar.
Top user-reported bug fixes
- Error with String::Format in C++ CLR Class Library (.NET) project
- False positive lifetime code analysis warning C26847: Don't return an invalid pointer
- Regression in 17.12.0: Substitution Failure Is An Error C3699 when compiling with /CLR
- Sanitizer Coverage Produces Bad Codegen
- Compilation error in lambda expressions in hierarchies with virtual inheritance
- Installer fails update to 17.12.0 with powershell script execution error
- Solution explorer exception when changing solution
📣 See the full list of all the user-reported bug fixes that made it into this release.
Important
A breaking change has been made to Domain-Specific Language model serialization. Developers using the default serialization mechanism for their models that contain custom property types will need to add TypeConverters for those custom property types. For an example of how to do this, see Customizing File Storage and XML Serialization.
Version 17.14.9
Released July 15th, 2025
| Top bug fixes | From the community |
|---|---|
| GitHub Copilot Agent Preview can't run terminal commands after running unit tests | Feedback ticket |
| Copilot file changes preview is empty | Feedback ticket |
| Escape key doesn't close the find box in a XAML file | Feedback ticket |
| Fixed listing Android debug targets when there is an invalid Java executable in the PATH. | Feedback ticket |
| Extension update in VS 17.14 | Feedback ticket |
| Removed filtering on C++ #include completions so that full lists are shown when both typing angle brackets and quotes. | Feedback ticket |
| AI, Copilot, Agents and MCP - .mcp.json dotnet run command cannot make use of relative pathing | Feedback ticket |
| Improved user experience when provisioning a Function App using Flex Consumption by removing the option to create a Linux Consumption Function App within Visual Studio. | |
| Fixed issues where customers would need to close StandardCollector.Service.exe during installs and updates. |
Version 17.14.8
Released July 8th, 2025
| Top bug fixes | From the community |
|---|---|
| Can no longer build the net9.0-ios target of my MAUI project | Feedback ticket |
| When setting the properties of a C# or VB.NET project, the "Startup object" dropdown will correctly show the objects you can choose from. | Feedback ticket |
| Docker containers are not showing up in Visual Studio for debugging. | Feedback ticket |
| Updated the Visual Studio installer to include the latest servicing release of the 10.0.26100 Windows SDK (10.0.26100.4188). |
| Security advisories addressed | CVE | Descritpion |
|---|---|---|
| Visual Studio - Elevation Of Privilege | CVE-2025-49739 | Time-of-check to time-of-use in Standard Collector Service allows Local privilege escalation |
| Gitk Arguments Vulnerability | CVE-2025-27613 | Gitk Arguments Vulnerability |
| Gitk Abitryary Code Execution Vulnerability | CVE-2025-27614 | Gitk Abitryary Code Execution Vulnerability |
| Git Malicious Shell Vulnerability | CVE-2025-46334 | Git Malicious Shell Vulnerability |
| Git File Overwrite Vulnerability | CVE-2025-46835 | Git File Overwrite Vulnerability |
| Git Symlink Vulnerability | CVE-2025-48384 | Git Symlink Vulnerability |
| Git Protocol Injection Vulnerability | CVE-2025-48385 | Git Protocol Injection Vulnerability |
| Git Credential Helper Vulnerability | CVE-2025-48386 | Git Credential Helper Vulnerability |
Version 17.14.7
Released June 23rd, 2025
| Top bug fixes | From the community |
|---|---|
| GitHub Copilot Chat Error: "Could not parse ov" - Persistent Issue | Feedback ticket |
| Fixed an issue when an include path was quoted with whitespace between the compiler option and the path, none of the files in the path would show up in the include completion list. | Feedback ticket |
| Escape not detected in Developer PowerShell in 17.14 | Feedback ticket |
| Updated to VS 17.14 - NCrunch 5.10.0.7 breaks | Feedback ticket |
| Unable to build VB.NET app in VS2022 17.14.0 preview 1.1 | Feedback ticket |
| Implemented several changes to improve the user experience and accessibility for Inline Completions. |
Version 17.14.6
Released June 17th, 2025
| Top bug fixes | From the community |
|---|---|
| VS 17.14 regression: ASAN bad codegen with x64 Release configuration | Feedback ticket |
| Sanitizer Coverage Produces Bad Codegen | Feedback ticket |
| Fixed an issue where Razor formatting would sometimes appear to do nothing for specific syntax patterns or configurations. | Feedback ticket |
| GitHub Copilot Agent Preview can't run terminal commands after running unit tests | Feedback ticket |
| When EventTrigger's routing event is Loaded, the Storyboard cannot find the target element by name. | Feedback ticket |
| Fixed a false-positive syntax error in boost::parser | Feedback ticket |
| Copilot cannot see the difference between .xaml.cs and .xaml | Feedback ticket |
| MSVC AddressSanitizer now supports projects using a dynamically linked Universal C Runtime with a statically linked VCRuntime, frequently used in software like plugins. | Feedback ticket |
| Fixed an issue with complex trait detection code that caused a compiler crash. | Feedback ticket |
| Copilot assistant 'run_build' failed | Feedback ticket |
| Fixed a crash when using the navigate button to edit menu item for Next Edit Suggestions. | |
| Fixed ConcRT (Concurrency Runtime) initialization on multi-socket machines with modified processor affinity. |
Version 17.14.5
Released June 10th, 2025
| Top bug fixes | From the community |
|---|---|
| The remote debugger via SSH hangs before hitting a breakpoint | Feedback ticket |
| Security advisories addressed | CVE | Descritpion |
|---|---|---|
| Visual Studio Remote Code Execution Vulnerability | CVE-2025-47959 | Improper neutralization of special elements used in a command ('command injection') in Visual Studio allows an authorized attacker to execute code over a network. |
| .NET and Visual Studio Remote Code Execution Vulnerability | CVE-2025-30399 | Untrusted search path in .NET and Visual Studio allows an unauthorized attacker to execute code over a network. |
Version 17.14.4
Released June 3rd, 2025
| Top bug fixes | From the community |
|---|---|
| Type or Namespace Can't Be Found Error on the Razor's PageModel | Feedback ticket |
| VS 2022 17.14 p1.1 cannot complete a build. "error D8040: error creating or communicating with child process." | Feedback ticket |
| #include completion no longer suggests files or folders in path | Feedback ticket |
| Visual Studio kept on asking me to re-enter credential [expansion.microsoft.com tenant blocked] | Feedback ticket |
Version 17.14.3
Released May 28th, 2025
| Top bug fixes | From the community |
|---|---|
| Problem storing COleDateTime with RFX_Date | Feedback ticket |
| Android launch options are missing | Feedback ticket |
| When I create a new script in Unity and open VS again for editing, all the previously fixed tabs disappear. | Feedback ticket |
| I have to restart VS each time I change something in code (Xamarin) | Feedback ticket |
| Changing git branches causes open files to be closed | Feedback ticket |
| "Quick Action & Refactoring > Create Definition" not working in 17.14 Update (UE5) | Feedback ticket |
Version 17.14.2
Released May 22nd, 2025
| Top bug fixes | From the community |
|---|---|
| Fixed an issue where VS will crash if opening a Solution containing C++ projects via a UNC path. | Feedback ticket |
Version 17.14.1
Released May 21th, 2025
| Top bug fixes | From the community |
|---|---|
| Feature 'xxx' is currently unavailable due to an internal error. System.NotSupportedException : The given path's format is not supported. | Feedback ticket |
| Fixed an issue that occurs when creating an upload package for the Microsoft Store. | Feedback ticket |
Fixed an issue with the Razor source generator that could cause it to fail to run with a System.ArgumentOutOfRangeException. |
|
| Fixed an issue that addresses a hang that occurred when closing a resource file editor before it completed initialization. |
From our entire team, thank you for choosing Visual Studio! For the latest updates, resources, and news, check out the Visual Studio Hub and stay in touch.
Happy coding!
The Visual Studio team
Note
This update may include new Microsoft or third-party software that is licensed separately, as set out in the 3rd Party Notices or in its accompanying license.