Use Leader reports to uncover key business outcomes
Leader deep-dive reports in Viva Insights focus on customers, business operations, and agility. To access these reports, select Organizational behavior reports under More insights on the Viva Insights Home page.
With these reports, leaders can view a variety of metrics and suggested actions focused on specific business outcomes. Leaders can further drill down into the insights with custom filters such as time periods and breakdowns by group. Learn more about filters in organization insights.
Each report includes three sections:
Executive summary, which highlights the big changes compared to peers’ teams over the prior month
Key metrics, which provide a deep dive into each topic, along with a “Why it matters” interpretation and recommended actions
Metric comparison, which addresses the different business outcomes. In the trend graph, you can view the key metric averages (the key metric in the first data table column), and learn how they change over time. You can view a six-month distribution of averages for:
Your entire company
Peer organizations (if applicable)
Groups within your organization (that is, different reporting hierarchies within your company)
To add more organizations to your trend graph, under Show trend, select the eye icon. The trend graph only supports up to 20 organizations. To protect individual privacy, we don't show organizational insights if the number of new hires in your organization is smaller than the minimum group size.
You can sort by any of the headers in the Groups within your organization table.
Prerequisites
To view these reports:
Your Group Manager has given you delegate access to organization insights that include every measured employee in your tenant.
Or, you’ve been assigned the Group Manager role, and you have a number of direct and indirect reports that meets or exceeds the minimum group size your Insights admin set. With this role, you can access organization insights that include people who report to you directly or indirectly.
If you have delegate access and you're a Group Manager, you can view the relevant organization insights for either role. Learn more about insights by role.
Overview of the Leader reports
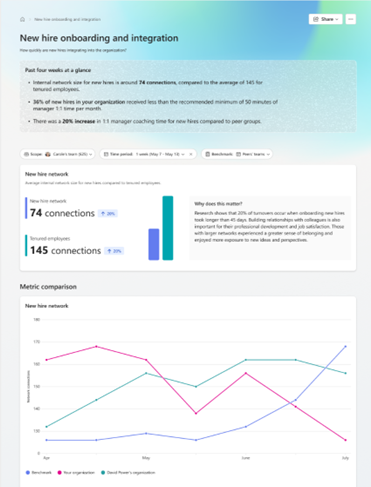
New hire onboarding and integration
Note
This report requires the HireDate attribute as a column in your organizational data file. If your admin hasn't uploaded this column, you won't be able to see the report's content. Learn more about the organization data upload process.
The New hire onboarding and integration report helps leaders understand the onboarding experience of new hires as well as the transition for employees who've started out in a new role within the company. The report also identifies opportunities to improve the onboarding and professional development experience.
Because research shows it takes new employees 12 months on average to reach their full performance potential, this report focuses on the entire 12-month period a new hire is learning, connecting, and developing in their new role.
This report can help you answer the following questions:
How are new hires developing their network, and how fast are they integrating into the organization’s network?
Are new hires getting the 1:1 coaching and support from their managers that they need?
Is the organization sufficiently encouraging new hires and employees to set aside time for learning and training?
This report is powered by the following metrics:
| Metric | Definition |
|---|---|
| Internal network size for new hires | Number of people within the organization with whom a new hire has had a reciprocal interaction in the past four weeks. |
| Calendared learning time | Number of hours blocked in a person’s calendar for learning activities. An appointment or meeting is considered a learning activity based on keywords that appear in the subject line. |
| Meeting hours with manager 1:1 for new hires | Number of meeting hours involving only the new hire and their manager. |
Note
By default, the benchmark filter for this report is set to the prior four weeks and values will only show in the table. If you change the benchmark setting to Peer or Your company, the filter displays data for the prior 12 weeks in both the table and the line chart.
About learning-related keywords
This report identifies calendar events as learning-related by using these keywords from meeting and appointment titles in Outlook:
train
learn
course
introduction
onboarding
induction
academy
education
brown bag
brownbag
Suggested actions
You can use the Pulse suggested action card to access the Pulse app and complete the following actions:
Send feedback requests to follow up on your report results using a tailored Pulse template for the Recent Hire Insights
Finish drafts of open feedback requests (previously created through the Insights app Pulse card)
See the status of an open Pulse request following up on their report
Access successfully completed Pulse requests
This card and set of deep link actions lets you gather more information on Insights reports through a follow-up Pulse survey, specifically the Recent Hires Onboarding report.
Create a Pulse survey
To create a survey from the new hire onboarding scenario page:
Navigate to the Send a pulse survey action card, then select the Get Started button. The template will open in the Pulse app.

Track a Pulse survey
The Recent pulse survey card features two statuses:
In-Progress
Survey Closed
Navigate to the Recent pulse survey card and select either Open survey for the In-Progress status or Review results for the Survey Closed status.
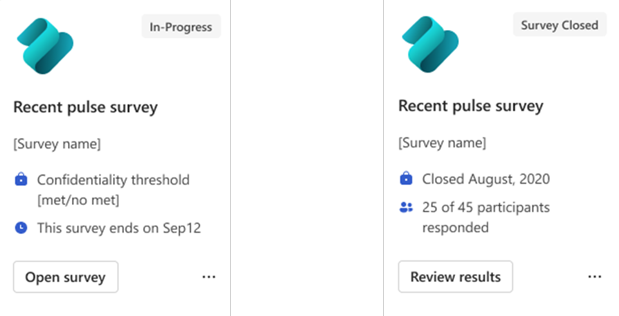
You'll find the Recent pulse survey card on the corresponding scenario page. Only the most current survey will display on the new hire onboarding page. The In-Progress status will remain until either the survey is closed or updated with the latest one. The Survey Closed status will display for up to six months after the closing date.
External focus
This report helps leaders understand how employees are managing external relationships, and how different parts of the company may have been impacted by business shifts.
Despite business changes, it’s important to ensure that relationships with customers, partners, and vendors stay strong. In times of change, internal demands can take precedence over time previously spent with external contacts. Those external contacts might also be refocusing their own priorities, and might not have time to meet with your organization.
This report can help you improve your strategies for communicating and collaborating with external groups. And for groups with increased external engagement, these insights can help you ensure these engagements don’t come at the expense of increased after-hours work.
This report is powered by the following metrics:
| Metric | Definition |
|---|---|
| External collaboration hours | Average time employees spent in meetings, emails, Teams calls, and Teams chats with at least one other person outside the company. |
| Employees' contact with external partners | Number of employees in meetings, emails, Teams calls, and Teams chats with at least one other person outside the company. |
Note
By default, the benchmark filter for this report is set to the prior four weeks and values will only show in the table. If you change the benchmark setting to Peer or Your company, the filter displays data for the prior 12 weeks in both the table and the line chart.
Meeting cost and quality
The Meeting cost and quality report helps you understand your organization’s meeting investments. You can see how much time your team spends in meetings and what share of it goes to large or long recurring meetings. If a lot of time is spent in large or long recurring meetings, then you might decide that it's worthwhile to encourage reviews of these kinds of meetings, because reviewing just one or two can impact a lot of employees' time.
This report can help you answer the following questions:
- How much time does my group spend in time-intensive meetings?
- What formats of meeting are consuming the most time for my team?
- Are there any opportunities among the meetings I’ve organized to streamline the meeting format or improve the meeting quality?
This report is powered by the following metrics:
| Metric | Definition |
|---|---|
| Time in meetings | How much time a person spends in meetings is based on accepted meetings on their Outlook calendar and excludes calendar items that are likely non-meetings, such as appointments. |
| Meeting cost | Meeting cost is estimated based on the total time in meetings multiplied by a flat hourly cost assumption. You can adjust the hourly cost assumption in your Viva Insights settings. The estimated cost of upcoming meetings uses the same hourly cost assumption multiplied by the meeting’s scheduled duration, frequency, and the number of required invitees who haven't declined. |
| Large meetings | Meetings where nine or more people are invited, including the meeting’s organizer. Large meetings can be useful for sharing information, but as meeting sizes grow, it becomes more difficult to engage all participants or drive decisions and action. |
| Long meetings | Meeting occurrences that are scheduled for more than one hour. Does not include hour-long meetings. Long meetings can be useful for covering many topics or having a deep discussion on a single topic, but organizers should be aware that beyond an hour, tired attention spans can reduce the value of the meeting. |
| Recurring meetings | Meetings that are part of a series. |
Optionally, some insights display the amount of time spent in meetings as a currency value. This can be useful for you when evaluating your organization’s time as an investment. The conversion to currency doesn't use any individual or group’s pay information. You can adjust the conversion rate and units, or choose to see these values as hours, in Insights settings.
Hybrid workplace
Important
The report described below is for private preview customers only. Features in preview might not be complete and could undergo changes before becoming available in the broader public release.
Note
To access this report, you must be assigned the Group Manager role.
The Hybrid workplace report helps leaders understand the experience of hybrid, remote, and onsite employees at their companies. The report identifies when and how employees are working in a hybrid work environment, and how the employee experience might differ depending on whether an employee works onsite, remote, or hybrid.
This report can help leaders answer the following questions:
- How many and what type of employees are working onsite, remote, and hybrid, and when?
- Are different work modes (onsite, remote, hybrid) affecting the employee experience? And, how so?
This report is available to organizations who have either:
- The Remote Work Detector signal enabled
- Or, the OnsiteDays column is populated in your organizational data file. Learn more about the organization data upload process.
This report is powered by the following metrics:
| Metric | Definition |
|---|---|
| % of organization’s employees by work mode | Percentage of your organization’s employees that work remote, hybrid, and onsite, on average. |
| Internal network size by work mode | Number of people within the organization with whom a person has had a reciprocal interaction in the past four weeks. |
| After-hours collaboration hours by work mode | Number of hours a person spent in meetings, emails, Teams chats, Teams calls, and Teams channels with at least one other person, either internal or external, after deduplication of time due to overlapping activities (for example, calls during a meeting), outside of working hours. |
| Percent of employees working flexible hours | Employees with nine or fewer active hours a day, but who spend more than five hours a week outside of typical or set working hours. |
| Meetings with manager hours | Number of hours a person spent in any meetings with their manager, including meetings with others as well as manager 1:1s. |
Privacy and engagement rates
Viva Insights respects user privacy and does not show information about individuals. Viva Insights also uses threshold values to protect privacy, and different reports use different thresholds. When necessary to protect privacy, for example, the Hybrid workplace report uses approximated values in this way:
| Number of employees | Engagement rate |
|---|---|
| 10-20 | Minimum: 25% Maximum: 75% |
| > 21 | Minimum: 10% Maximum: 90% |