Note
Access to this page requires authorization. You can try signing in or changing directories.
Access to this page requires authorization. You can try changing directories.
Advanced analytics capabilities in Viva Engage enable the following scenarios:
- All users can monitor their own engagement metrics through personal, Global Answers, and Community analytics.
- Leaders and their delegates monitor engagement for their audiences through audience analytics.
- Corporate communicators and campaign organizers manage campaign engagement through campaign analytics.
- Knowledge admins monitor Answer engagement through global Answers analytics.
- Network admins and corporate communicators track organization-wide engagement through network analytics.
Analytics features are available in all languages supported by Engage.
The Support article Monitor engagement in Viva Engage with analytics provides an overview of the various analytics dashboards, and details about metrics in each category.
View analytics
Note
To use all analytics features, users must have Viva Engage Premium, which is bundled with the Viva Suite and Employee Communications and Communities (C&C) licenses. Users without those licenses can still access conversations, live events, and some community analytics without the Viva Suite or C&C license. Audience analytics are viewable by leaders that have at least one primary assigned audience, and by their delegates. Engage admins and network admins have access to all Analytics tabs.
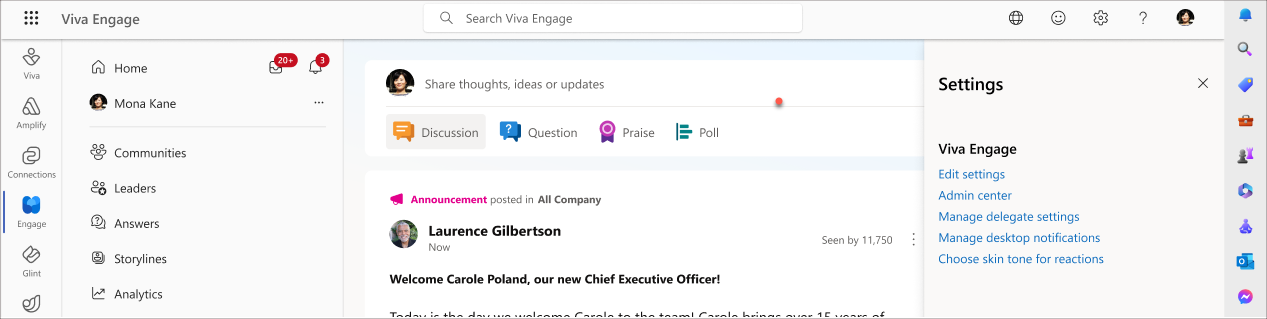
To open analytics, select the Analytics icon on the top navigation bar in Viva Engage.
Most analytics data refreshes every 24 hours. Conversation and community analytics update in near real time. If you don’t see changes reflected immediately, check back the next day.
Manage analytics
Holders of Network admin roles activate analytics features from the Manage analytics interface of the Viva Engage admin center. Take the following steps:
From Viva Engage on the web, select the gear icon in the top navigation menu and choose Admin center. From the Viva Engage Teams app, select the ellipses button from the top navigation menu, and then select Admin.
Select the Setup & configuration tab, and select Manage analytics.
Activate AI-related features from the Analytics settings page > Feature access management. AI features include sentiment analysis and theme extraction in Microsoft 365. See Manage AI Summarization in Microsoft 365 for details.
Community analytics
Note
Access community analytics from the Analytics icon in any Community header. Community admins and Engage network admins see a Community analytics summary card on the community's right panel.
All licensed users have access to public community analytics, while community members see analytics for their private communities. Community admins and corporate communicators can view some advanced metrics, including time saved, people helped, and community optimizer tips.
To change community analytics feature settings, Engage network admins use the Analytics and AI page in the Engage admin center.
Manage AI Summarization in Microsoft 365
Viva Engage uses AI Summarization to support network theme extraction, conversation summarization, and sentiment analysis. The AI Summarization service processes Viva Engage threads in the background to provide a richer data experience for AI features in advanced analytics. To learn more, see Sentiment and theme analysis in Viva Engage.
Admins can configure AI Summarization for specific users and groups in the tenant through Viva Feature access management in the Microsoft 365 admin center, offering a more flexible approach to deployment. To learn more, see Viva Feature access management and AI Summarization enablement states.
Network analytics
Note
For a visible Network analytics dashboard, at least 50% of the network’s users must be licensed for Viva Suite or Employee Communications and Communities, or for the Viva Engage premium license.
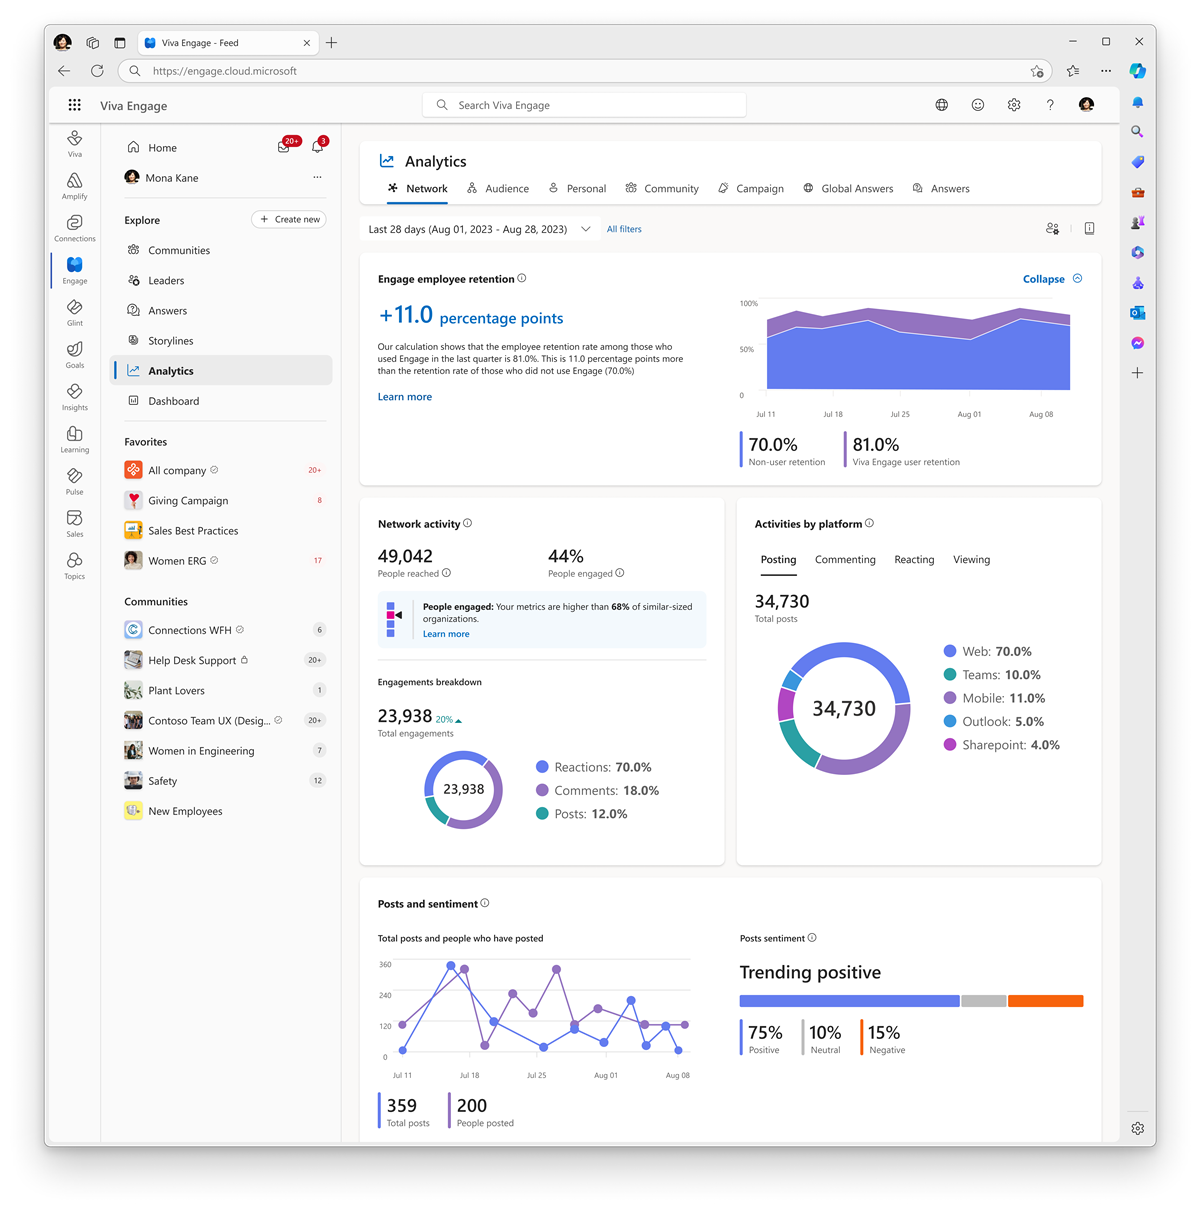
Network analytics provide valuable insights into employee engagement and communication across your organization through activation, sentiment, retention, and community activity data. Use organizational attributes as data filters to help Network admins and corporate communicators make more informed decisions about network health.
Employee retention shows the difference in the 28-day employee retention rates of employees who do or who don't use Engage. For details, see Measure employee retention with Viva Engage.
Learn more about Network analytics in Track engagement in Viva Engage with analytics.
Audience analytics
Note
Audience analytics are visible for leaders with one or more primary assigned audiences (minimum audience size of 5), and for their delegates.
Engage admins can adjust the level of sentiment analysis for leaders and their delegates in the Manage analytics > Audience analytics interface. This functionality enables unique levels of sentiment collection at the audience, theme, or conversation level.
View Audience analytics through the analytics icon on the top navigation bar or on the leader's Storyline page.
Audience analytics helps leaders and delegates monitor audience engagement on Viva Engage. It shows the most actively engaged communities with at least 50 members and one active member. An active community shows reactions and replies from at least 5% of its membership. An idle community has reactions and replies from less than 5% of its membership.
Note
If you designate a leader for the entire organization, but don't assign them an audience, the leader (and their delegates, if any) doesn't see any data under audience analytics. Leaders with several audiences might also be designated as the leader for the entire organization. In this case, audience analytics shows engagement trends across the organization, because audience analytics show aggregate counts across all of a leader's audiences.
Learn more about Audience analytics in Track engagement in Viva Engage with analytics.
Global Answers analytics
Engage admins can manage metrics for Answers in their organization. Answers analytics are specific to questions asked in communities; global answers provides metrics for questions asked and answered across the organization.
Open Viva Engage admin center > Manage analytics to enable or disable advanced metrics such as time saved and people helped.
Learn more about the metrics for Global Answers analytics and Answers-specific actions for admins, and in Track engagement in Viva Engage with analytics.
Personal analytics
All licensed users have access to personal analytics that help monitor engagement on any of their storylines or community posts in Viva Engage.

Learn more about Personal analytics in Track engagement in Viva Engage with analytics.
Campaign analytics
Use campaign analytics to monitor engagement for insights to improve future campaigns. Find them on the Campaign management dashboard, the campaign landing page, or through the analytics icon on the main navigation menu of Viva Engage.
Use the Manage analytics interface to enable or disable the top content creator feature for the organization. This feature displays employees and leaders who create the most campaign posts.
Learn more about Campaign analytics in Track engagement in Viva Engage with analytics.