你当前正在访问 Microsoft Azure Global Edition 技术文档网站。 如果需要访问由世纪互联运营的 Microsoft Azure 中国技术文档网站,请访问 https://docs.azure.cn。
教程:使用笔记本分析 Azure Monitor 日志中的数据
笔记本是集成环境,允许创建和共享具有实时代码、公式、可视化效果和文本的文档。 通过将笔记本与 Log Analytics 工作区集成可创建多步骤流程,它在每个步骤中根据上一步的结果运行代码。 可以使用这种简化的流程来构建机器学习管道、高级分析工具、针对支持需求的故障排除指南 (TSG) 等。
将笔记本与 Log Analytics 工作区集成还可以:
- 以任何语言运行 KQL 查询和自定义代码。
- 引入新的分析和可视化效果功能,如新的机器学习模型、自定义时间线和流程树。
- 集成 Azure Monitor 日志之外的数据集,例如本地数据集。
- 与 Azure 门户相比,使用查询 API 限制可以利用增加的服务限制。
在本教程中,你将了解如何执行以下操作:
- 使用 Azure Monitor 查询客户端库和 Azure 标识客户端库将笔记本与 Log Analytics 工作区集成
- 在笔记本中浏览和可视化 Log Analytics 工作区中的数据
- 将笔记本中的数据导入 Log Analytics 工作区中的自定义表(可选)
有关如何使用笔记本构建机器学习管道以分析 Azure Monitor 日志中的数据的示例,请参阅此示例笔记本:使用机器学习技术检测 Azure Monitor 日志中的异常。
提示
要解决与 API 相关的限制,请将较大的查询拆分为多个较小的查询。
必备条件
对于本教程的内容,你需要:
带有 CPU 计算实例的 Azure 机器学习工作区,具有:
- 笔记本。
- 设置为 Python 3.8 或更高版本的内核。
以下角色和权限:
在 Azure Monitor 日志中:Log Analytics 参与者角色,用于从 Log Analytics 工作区读取数据并向其发送数据。 有关详细信息,请参阅管理对 Log Analytics 工作区的访问权限。
Azure 机器学习:
- 资源组级别的所有者或参与者角色,可根据需要创建新的 Azure 机器学习工作区。
- 运行笔记本的 Azure 机器学习工作区上的参与者角色。
有关详细信息,请参阅管理对 Azure 机器学习工作区的访问。
工具和笔记本
在本教程中,将使用以下工具:
| 工具 | 说明 |
|---|---|
| Azure Monitor 查询客户端库 | 允许对 Azure Monitor 日志中的数据运行只读查询。 |
| Azure 标识客户端库 | 可让 Azure SDK 客户端使用 Microsoft Entra ID 进行身份验证。 |
| Azure Monitor 引入客户端库 | 允许使用日志引入 API 将自定义日志发送到 Azure Monitor。 需要将分析的数据引入到 Log Analytics 工作区中的自定义表中(可选) |
| 数据收集规则、数据收集终结点和已注册的应用程序 | 需要将分析的数据引入到 Log Analytics 工作区中的自定义表中(可选) |
可以使用的其他查询库包括:
- Kqlmagic 库允许直接在笔记本中运行 KQL 查询,方法与从 Log Analytics 工具中运行 KQL 查询相同。
- MSTICPY 库提供调用内置 KQL 时间序列和机器学习功能的模板查询,并在 Log Analytics 工作区中提供了高级可视化工具和数据分析。
用于高级分析的其他 Microsoft 笔记本体验包括:
1. 将 Log Analytics 工作区与笔记本集成
设置笔记本以查询 Log Analytics 工作区:
安装 Azure Monitor 查询、Azure 标识和 Azure Monitor 引入客户端库以及 Pandas 数据分析库、Plotly 可视化效果库:
import sys

!{sys.executable} -m pip install --upgrade azure-monitor-query azure-identity azure-monitor-ingestion

!{sys.executable} -m pip install --upgrade pandas plotly
将下面的
LOGS_WORKSPACE_ID变量设置为 Log Analytics 工作区的 ID。 变量当前设置为使用 Azure Monitor 演示工作区,可以使用该工作区演示笔记本。LOGS_WORKSPACE_ID = "DEMO_WORKSPACE"设置
LogsQueryClient以验证和查询 Azure Monitor 日志。此代码设置
LogsQueryClient以使用DefaultAzureCredential进行身份验证:from azure.core.credentials import AzureKeyCredential from azure.core.pipeline.policies import AzureKeyCredentialPolicy from azure.identity import DefaultAzureCredential from azure.monitor.query import LogsQueryClient if LOGS_WORKSPACE_ID == "DEMO_WORKSPACE": credential = AzureKeyCredential("DEMO_KEY") authentication_policy = AzureKeyCredentialPolicy(name="X-Api-Key", credential=credential) else: credential = DefaultAzureCredential() authentication_policy = None logs_query_client = LogsQueryClient(credential, authentication_policy=authentication_policy)LogsQueryClient通常仅支持使用 Microsoft Entra 令牌凭据进行身份验证。 然而,可以传递自定义身份验证策略以启用 API 密钥的使用。 这允许客户端查询演示工作区。 此演示工作区的可用性和访问权限可能会更改,因此建议使用自己的 Log Analytics 工作区。定义名为
query_logs_workspace的 helper 函数,以在 Log Analytics 工作区中运行给定的查询,并将结果作为 Pandas DataFrame 返回。import pandas as pd import plotly.express as px from azure.monitor.query import LogsQueryStatus from azure.core.exceptions import HttpResponseError def query_logs_workspace(query): try: response = logs_query_client.query_workspace(LOGS_WORKSPACE_ID, query, timespan=None) if response.status == LogsQueryStatus.PARTIAL: error = response.partial_error data = response.partial_data print(error.message) elif response.status == LogsQueryStatus.SUCCESS: data = response.tables for table in data: my_data = pd.DataFrame(data=table.rows, columns=table.columns) except HttpResponseError as err: print("something fatal happened") print (err) return my_data
2. 在笔记本中浏览和可视化 Log Analytics 工作区中的数据
通过从笔记本运行查询来查看工作区中的一些数据:
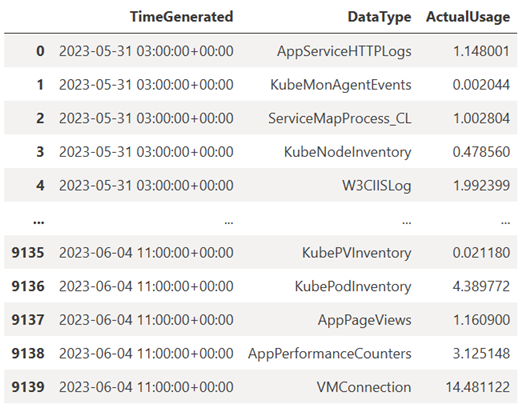
此查询检查在过去一周中,每小时在 Log Analytics 工作区的每个表(数据类型)中引入的数据量(以 MB 表示):
TABLE = "Usage"

QUERY = f"""
let starttime = 7d; // Start date for the time series, counting back from the current date
let endtime = 0d; // today
{TABLE} | project TimeGenerated, DataType, Quantity
| where TimeGenerated between (ago(starttime)..ago(endtime))
| summarize ActualUsage=sum(Quantity) by TimeGenerated=bin(TimeGenerated, 1h), DataType
"""

df = query_logs_workspace(QUERY)
display(df)
生成的 DataFrame 显示了 Log Analytics 工作区中每个表的每小时引入量:
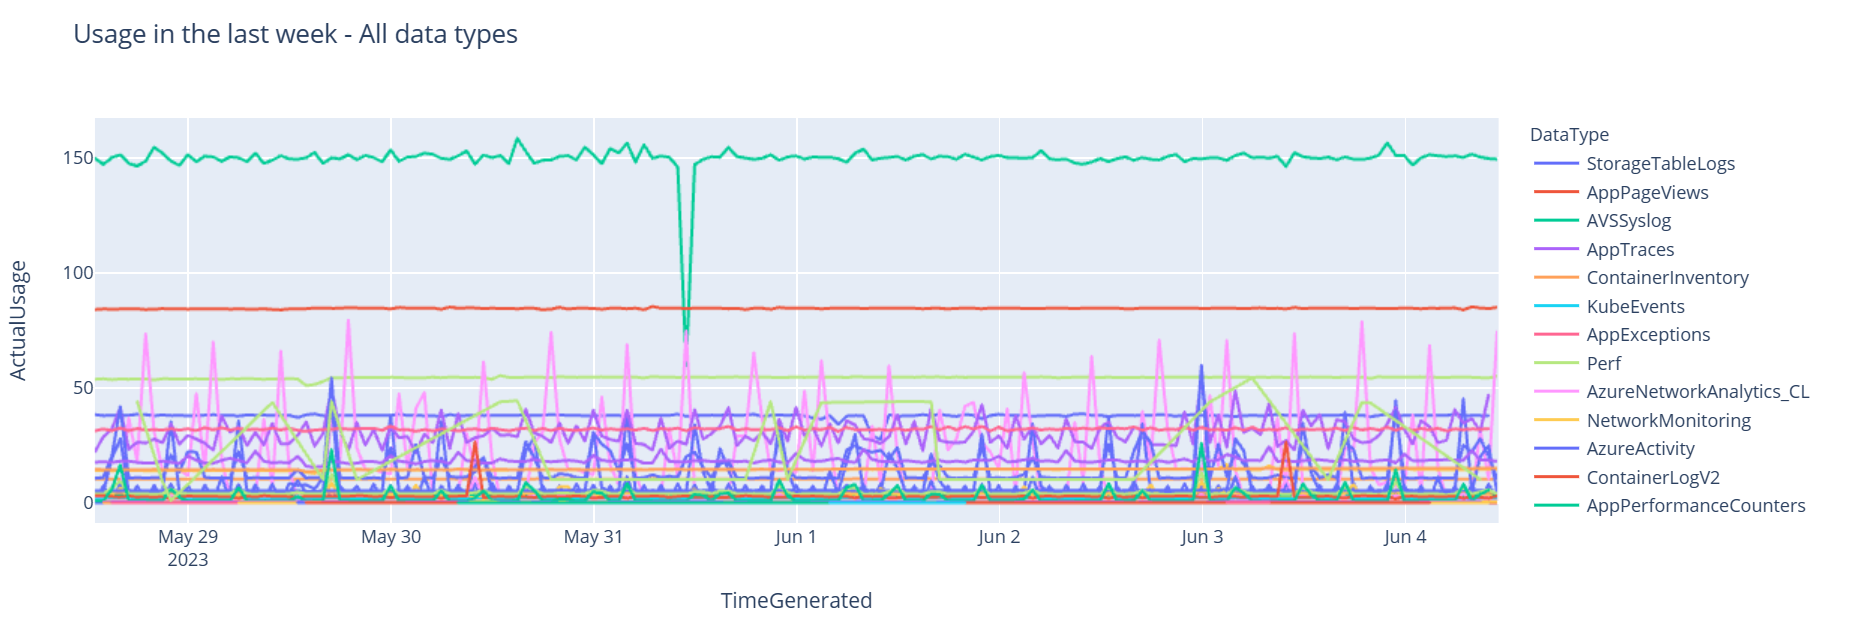
现在,以图形式查看数据,该图基于 Pandas DataFrame 显示了各种数据类型随时间的每小时使用情况:
df = df.sort_values(by="TimeGenerated")
graph = px.line(df, x='TimeGenerated', y="ActualUsage", color='DataType', title="Usage in the last week - All data types")
graph.show()
结果图如下所示:
已成功在笔记本中查询并可视化来自 Log Analytics 工作区的日志数据。

3. 分析数据
作为简单的例子,以前五行为例:
analyzed_df = df.head(5)
有关如何实现机器学习技术来分析 Azure Monitor 日志中的数据示例,请参阅此示例笔记本:使用机器学习技术检测 Azure Monitor 日志的异常。
4. 将分析的数据引入 Log Analytics 工作区中的自定义表(可选)
分析结果发送到 Log Analytics 工作区中的自定义表,以触发警报或使其可用于进一步分析。
要将数据发送到 Log Analytics 工作区,需要自定义表、数据收集终结点、数据收集规则和具有使用数据收集规则权限的已注册 Microsoft Entra 应用程序,如教程:使用日志引入 API 将数据发送到 Azure Monitor 日志(Azure 门户)中所述。
创建自定义表时:
上传此示例文件以定义表架构:
[
  {
    "TimeGenerated": "2023-03-19T19:56:43.7447391Z",
    "ActualUsage": 40.1,
    "DataType": "AzureDiagnostics"
  }
]
定义日志引入 API 所需的常数:
os.environ['AZURE_TENANT_ID'] = "<Tenant ID>"; #ID of the tenant where the data collection endpoint resides
os.environ['AZURE_CLIENT_ID'] = "<Application ID>"; #Application ID to which you granted permissions to your data collection rule
os.environ['AZURE_CLIENT_SECRET'] = "<Client secret>"; #Secret created for the application


os.environ['LOGS_DCR_STREAM_NAME'] = "<Custom stream name>" ##Name of the custom stream from the data collection rule
os.environ['LOGS_DCR_RULE_ID'] = "<Data collection rule immutableId>" # immutableId of your data collection rule
os.environ['DATA_COLLECTION_ENDPOINT'] =  "<Logs ingestion URL of your endpoint>" # URL that looks like this: https://xxxx.ingest.monitor.azure.com
将数据引入 Log Analytics 工作区中的自定义表:
from azure.core.exceptions import HttpResponseError
from azure.identity import ClientSecretCredential
from azure.monitor.ingestion import LogsIngestionClient
import json


credential = ClientSecretCredential(
    tenant_id=AZURE_TENANT_ID,
    client_id=AZURE_CLIENT_ID,
    client_secret=AZURE_CLIENT_SECRET
)

client = LogsIngestionClient(endpoint=DATA_COLLECTION_ENDPOINT, credential=credential, logging_enable=True)

body = json.loads(analyzed_df.to_json(orient='records', date_format='iso'))

try:
   response =  client.upload(rule_id=LOGS_DCR_RULE_ID, stream_name=LOGS_DCR_STREAM_NAME, logs=body)
   print("Upload request accepted")
except HttpResponseError as e:
    print(f"Upload failed: {e}")
注意
在 Log Analytics 工作区中创建表时,引入的数据可能最多需要 15 分钟才能显示在表中。
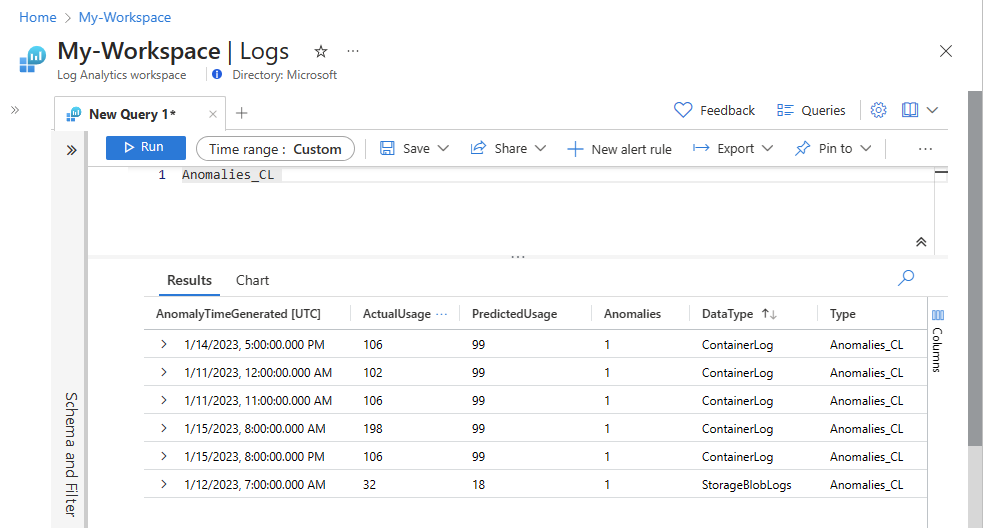
验证数据现在是否显示在自定义表中。

后续步骤
详细了解如何执行以下操作: