Configure Microsoft Cloud App Security to Analyze SonicWall Logs
One of the greatest dangers for any network today is not knowing what applications are running within its boundaries and how the data could be leaking externally. These applications are often installed by users not knowing the potential hazards these applications may cause, malicious applications that have somehow entered the network, or a combination of both. These unknown applications are called Shadow IT. For an Information Technology (IT) department, it is their role to provide productivity applications that meet an organization's security requirements and required industry regulations (HIPPA, SOX, etc.) among many other goals of the business. A data breach is just as concerning as a malware, ransomware, or virus attack. How to effectively monitor, research, and prevent these constantly evolving threats is what keeps any technical leader up at night.
Microsoft Cloud App Security offers unparalleled capabilities to monitor what we call Shadow IT services using logs from over 20 (and growing!) of the most popular firewall manufacturers and models. This cloud based service enables a network administrator to import a specific date range of logs for graphically detailed analysis or to stream logs for constant monitoring, alerting, and actionable items. While importing a date range of logs involves just a few steps and is a great way to start, configurating the service to receive a stream of logs has a few additional steps. In my Microsoft role as a Partner Technical Architect I am often asked how to configure the streaming log capability for a variety of firewalls that are supported such as Sonicwall, WatchGuard, Palo Alto, Cisco, Fortigate, Blue Coat and many others (see this site for an updated list of supported manufacturers and models). For models not specifically listed, there is a custom import option as well. To help guide the customers I work with as well as you, I documented the setup and configuration steps below I use for Sonicwall models.
The approach below is fairly simple - to provide the capability to stream Sonicwall Syslog entries from a business network into Cloud App Security for ongoing analysis. To enable this configuration, we need to define a syslog server in the Sonicwall, prepare Cloud Application Security to receive the syslog files, and setup a Cloud Application Security Log Collector to receive the local files and transmit them to Cloud App Security. If you would like information about how to import a timeframe of logs, please review this blog
For more information on the Cloud App Security service, see the following sites:
- Microsoft Cloud App Security
- Microsoft Cloud App Security blog
- Microsoft Mechanics: Introducing Microsoft Cloud App Security
Below are the configuration instructions specific to a Sonicwall TZ400 running SonicOS Enhanced 6.2.9.2. Additional information from the CAS product group about this configuration (not specific to a firewall manufacturer or model) is available in this site. Please leave questions and suggestions for additional content on this topic in the comments section below.
Part I: Configure Cloud App Security to Receive Logs
Be sure you have the correct Office 365 license assigned to the user you will be logging in with to configure the service.
Note: As of March 7, 2018, licensing options were outlined on this link in the first Note section at the top of the site.
Logon to portal.cloudappsecurity.com
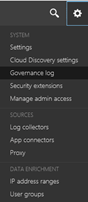
Select the Settings icon in the upper right and then the Settings option.
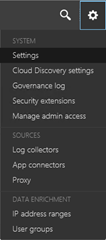
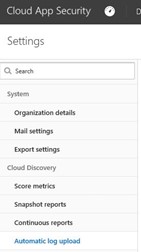
In the Settings area, select Automatic Log Upload
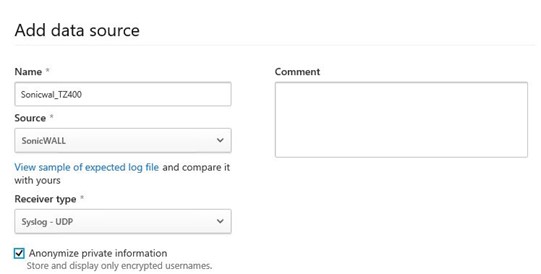
Select the Data Sources tab. Here, we will define the type of firewall the logs will be coming from.
Name: Provide a name for the data source (the firewall that you will be receiving logs from)
Source: Using the drop down option, select the model of firewall. If unlisted, select the Custom Log Format option at the bottom of the list.
Receiver type: I chose Syslog-UDP in this example, but there are multiple options to use.
Select the Log Collector tab.
Name: Choose a unique name
Host IP or FQDN IP: Internal firewall IP address
Data Source: Choose the Data Source defined in the previous step. Additional Data Sources can be created and defined here as well.
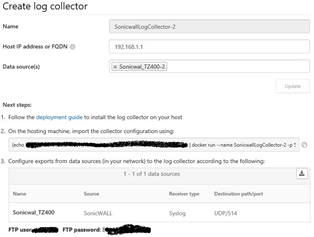
Important Note: Be sure to copy the command as indicated to a Notepad or other area. You will need this information later in the setup.
Part II: Setup and Configure Ubuntu on Local Hyper-V Server
In this section, we will begin to setup the environment needed for the log collector to be hosted on-premises. There is an option to host this server in Microsoft Azure as well. One of the many great things about the Microsoft Hyper-V server is that it is readily available on Windows systems. You can host the server below with Hyper-V on your Windows 8.1 or 10 desktop/laptops, or of course Windows servers. You need to make sure you have the system resources available.
Download the Ubuntu 64bit desktop ISO file for version 16.04 (per the documentation, there is no stable version of Docker to support Ubuntu 17.10 as of March 5, 2018). The Desktop version provides a GUI interface that is a bit easier to configure if you are new to Linux.
Setup the Hyper-V system as a Generation 1 system (Generation 2 gave me some issues). As per the technical guidelines in this link, define a hard drive of 250GB or more, 2 CPUs, and 4GB or more memory.
Mount the Ubuntu 16.04 ISO to boot from and start the new virtual environment.
The installation steps are very straight forward, so I will not rehash all of the steps.
After the installation has completed, reboot the server to begin configuration.
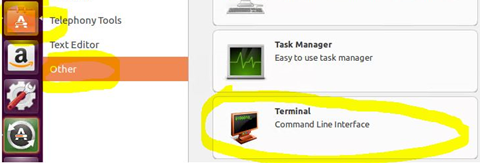
When in Ubuntu virtual desktop, install the Terminal Command Line Interface. This can be done by selecting the Ubuntu Software icon on the left, then Utilities(category at bottom), Other, then Terminal.
Part III: Configure the Cloud App Security Collector Image
Logon to the Ubuntu virtual desktop.
Open the Terminal Command Line Interface that now appears on the left index.
Enter sudo -i to access root privileges.
Typically, curl is not installed by default. This is needed to transfer the Docker software to the Ubuntu virtual desktop. To install this capability, on the command line enter: sudo apt install curl
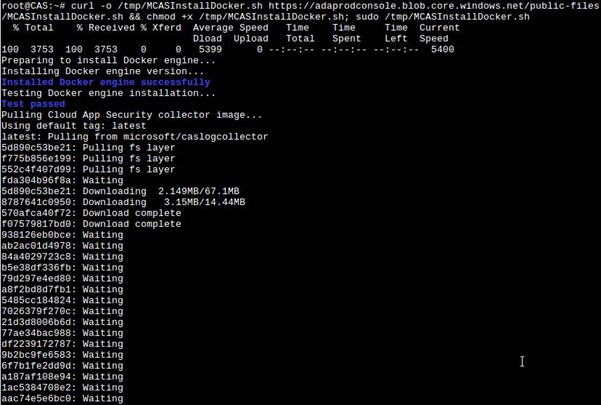
Install Docker CE with the command line below (remember, these commands are case sensitive).
curl -o /tmp/MCASInstallDocker.sh https://adaprodconsole.blob.core.windows.net/public-files/MCASInstallDocker.sh && chmod +x /tmp/MCASInstallDocker.sh; sudo /tmp/MCASInstallDocker.sh
Note 1: The command line in the documentation is missing the "sudo" command to install the engine after it is downloaded. The command above is correct.
Note 2: Once executed, it may take 10-15 minutes to download and extract the Cloud App Security collector image.
Below is a screen capture of the download and extraction process
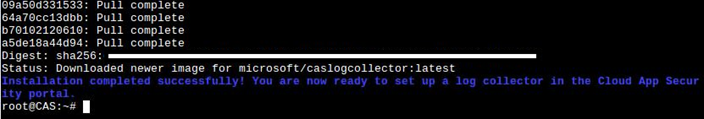
When complete, this is what will be seen:
Because your Ubuntu virtual desktop is now setup with prerequisites needed for this configuration, I suggest you take a Snapshot of the running image. This will save you time if any of the remaining steps have issues and you need to revert back to this point.
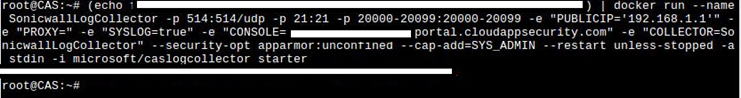
With the installation successful, we will now import the collector configuration. When we created the Log Collector in the portal above, it generated a command to run in step 6 beginning with " (echo…" In the terminal session on the Ubuntu system, paste this entire command line and press Enter. Unfortunately for me, the copy/paste option would not work, so I had to manually retype the command into the terminal session. Remember these are case sensitive commands that must match exactly. Below is an example of the command being run (with sensitive data blocked out).
Next, enter: sudo docker logs (yourlogcollectorname)
Part IV: Configure the Sonicwall to Send Logs to the Ubuntu Log Collector:
Logon to the Sonicwall Administrator site
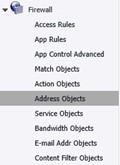
On the left, expand Firewall and then select Address Objects
Select Add
Create the new Address Object.
Define the Name, Zone Assignment, Type, and IP Address (of your Sonicwall internal address)
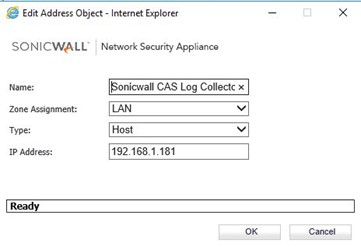
Click OK to save the new Address Object
Part V: Setup a SysLog Server in the Sonicwall
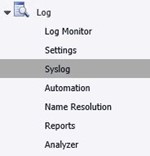
Log into In the Sonicwall index, expand the Log area on the lower left.
Select Syslog
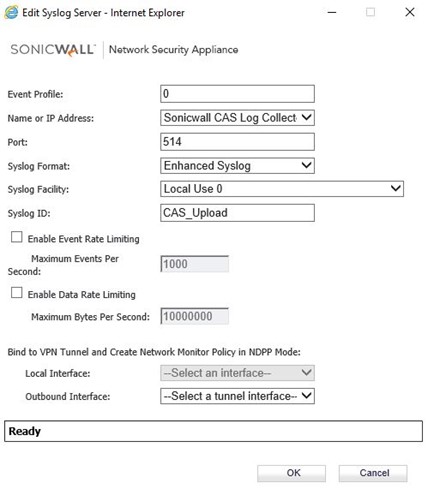
Click Add and edit the fields below
Name or IP Address: Select the Address Object name you created above.
Port: 514 (standard)
SysLog Format: Enhanced Syslog
Note: The more information sent to Cloud App Security, the richer the reporting. The log collector compresses the data received before it is uploaded. The result is a 90% reduction in log size transmitted for analysis. See reference article.
SysLog ID: CAS_Upload
Note: This will allow you to easily identify this traffic in your logs
Click OK to save the new profile
Example screen is below:
In the Syslog Servers area, you will now see the new SysLog Server defined.

Part VI: Verify Logs are Being Received
While logged into portal.cloudappsecurity.com you can verify logs are being received in several places.
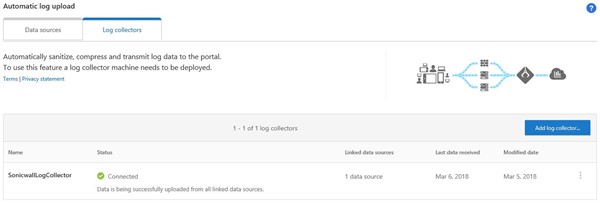
- Option One: Verify in Automatic Log Upload
- On the left, click on Automatic Log Upload
- Click on the Log Collectors tab
- Verify the Collector name has a Connected status displayed along with a green circle with a check mark on it.
- For troubleshooting this area, see Part VIII in this blog.
- Option Two: Verify in Governance Log
- Click the Settings icon in the upper right
- Click on Governance Log
- In the Status column, verify you see a green circle and check mark next to Successful.
- For troubleshooting this area, see Part VIII in this blog.
Part VII: View and Action on Information in the Cloud App Security Reports:
With logs now successfully being transmitted and analyzed by Cloud App Security, you can begin reviewing the findings for suspicious behavior. The dynamic ways in how the log analysis can be performed is outside of the scope of this article, but I have placed several links below for more information. Based on personal experience in helping many Microsoft partners and customers set this up for the first time that they are amazed at what is discovered and the amount of network traffic from otherwise unknown applications contacting cloud services. Once there is an understanding of what is happening on the network, the detailed reports are designed to enable administrators to quickly track and mitigate the sources.
Always keep in mind that an organization's security posture should never be considered a finish line to cross. Rather, this is a cat and mouse game with thousands of new cloud services appearing each day and constantly evolving attack vectors. To further help monitor for these evolving threats, be sure to setup the alerting and automatic mitigation efforts available in Cloud App Security.
Below are links to learn much more about how to configure this service:
Part VIII: Troubleshooting the Configuration
This troubleshooting link has several topics to review if you are not seeing the Connected status with a green circle/check mark that indicates logs are being received.
If you see a Connect status with a yellow triangle next to it, this could be:
- You need to wait a little longer to start receiving logs from your Sonicwall device. I had to wait about five minutes for this to change once I made the final configuration changes and after this status wen from Configured to Connected.
- Check the basics of your configuration. If your configuration is like mine and you did not statically assign the Ubuntu IP address, it could've changed on a reboot. Be sure to double check it with the ifconfig command in the terminal session. If it has changed, edit the IP Address for the Firewall->Address Object defined earlier in the Sonicwall.
- Check the Sonicwall logs to see if these outbound logs are being transmitted. You may have a block rule in place or a Sonicwall service is capturing and preventing these logs from being transmitted. If so, follow the network documentation on this site to create a white list for these services.
Summary:
As stated earlier, not knowing what applications are contacting the cloud to host unknown and unsanctioned applications or to start "phoning home" an organization's data is a daily concern. This unknown is what keeps technical people up at night. Configuring Microsoft Cloud App Security to constantly monitor firewall logs and display them in a graphical format based on risk level and numerous other criteria is just the first part of the solution. Using the service to monitor for suspicious behavior such as a sudden increase in data exports or impossible logons is key to keeping the environment safe.