IoT Project for Anyone – Power BI Streaming Dataset Setup
IoT Project for Anyone Blog Series:
This is one of a series of blogs developed as part of an overall IoT implementation project for beginners. The project will walk through the hardware needed, operating system installation, data collection and a Power BI dashboard to view the data. These blogs can be reviewed in sequence as part of the overall project or on their own if looking for information on a particular IoT topic.
Project Blog Index:
IoT for Anyone - Materials and Connections
IoT for Anyone - Windows 10 IoT Core Operating System Installation
IoT for Anyone - Raspbian Operating System Installation
IoT for Anyone - Power BI Streaming Dataset Setup (this blog)
IoT for Anyone - Collecting and Streaming Data from Windows 10 IoT (coming soon)
IoT for Anyone - Collecting and Streaming Data from Raspbian Operating System
IoT for Anyone - Designing IoT Microsoft Power BI Dashboard
Introduction:
Microsoft Power Business Intelligence (Power BI) is an incredibly agile product that enables us to analyze and display data in a variety of different ways. This flexibility gives us the capability to understand data in ways never before possible. The good news is that you do not need to be a data scientist or power user to effectively use Power BI.
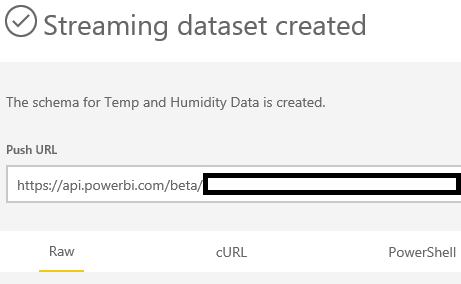
Staying with the theme of this blog series, the goal of the IoT project is to collect data from IoT sensors and stream it directly to the cloud where it is then displayed on a live Power BI Dashboard. This blog will enable us to pre-stage the Power BI area to receive data that is streamed in later articles. Once the steps below have been completed, you will receive a "Push URL" that will be used in our Python scripts to collect and send data to a Microsoft Azure streaming data set. These instructions will be used for setting up either an IoT device running Windows 10 IoT Core or the Raspbian operating system. Be sure to copy the long "Push URL" to reference later.
Prepare Microsoft Power BI:
Before we get started configuring the Raspberry Pi temperature and humidity sensor, we will first prepare the Power BI environment to receive the streaming data. Several of these steps are found with additional detail in Sirui Sun's blog post.
- Logon to PowerBI.Microsoft.com. A Start Free option is on the home screen. Because we are using streaming data in this example, we must use the Cloud collaboration and sharing option on this page. Streaming data for a dashboard is not supported at this time in the On-Premise option.
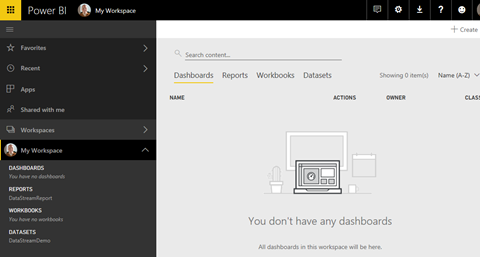
- After signing up or signing in to your Power BI dashboard, you should now be able to access the Power BI space.
- Click on the My Workspace area. Because this is a new workspace, no Dashboards should be seen.
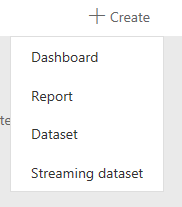
- Click on the +Create option on the upper right to being the creation of a new Power BI dashboard. In the drop down window, select Dashboard.
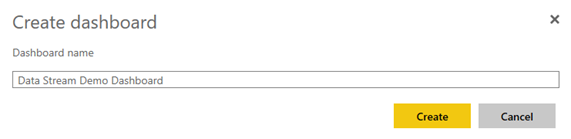
- Give your new dashboard a name.
- Under the Datasets tab, click on the +Create option. Then click on the "Streaming dataset" option.
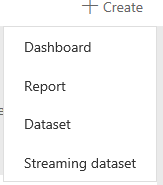
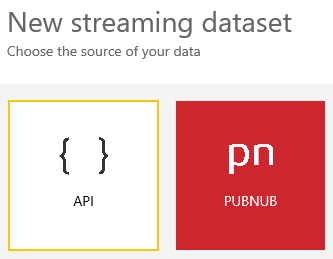
- Select the "{ } API option" and select "Next."
- From here, we will use the datasets defined in Sirui's blog in the screen capture below:
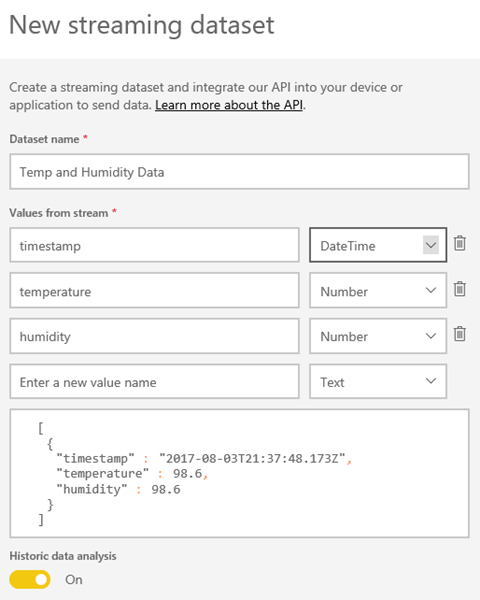
- Once ready, click on "Create."

- Once completed, locate the "Push URL" field and copy the URL listed. This link will be used later in the data collection Python script in a different blog.