How to analyse IIS logs using LogParser / LogParser Studio
In a previous blog article I've detailed how to analyse IIS Logs using Excel. However, when you get very huge logs or when you want to automate this operation, Excel is not the best way to do. It's where LogParser 2.2 takes over. It allows you to parse any kind of logs (IIS, HTTPErr, Event Logs…) using a programming language similar to SQL. LogParser 2.2 is great but you just get the command-line tool and then… You've got to find the queries yourself.
Of course, many web sites on Internet are sharing LogParser requests like:
- https://support.microsoft.com/kb/910447/en-us
- https://blogs.msdn.com/b/mmcintyr/archive/2009/07/20/analyzing-iis-log-files-using-log-parser-part-1.aspx
- …
Once you get all the queries you need, you can automate them by using a batch file or a PowerShell script.
However, when you start to use LogParser, it's not really easy to know how to look at what you want in the IIS Logs and sometimes, it's even difficult to know what to look at.
LogParser Studio is implementing several pre-built queries which is great to start or to give ideas to go further and develop your own queries.
Then you'll be able to copy those requests to use it directly with LogParser 2.2 using command-lines if you're not interested in the UI.
First of all, install LogParser Sutdio which is available here: https://gallery.technet.microsoft.com/Log-Parser-Studio-cd458765
Then, launch it. You'll be able to see the Library tab with the pre-built queries:
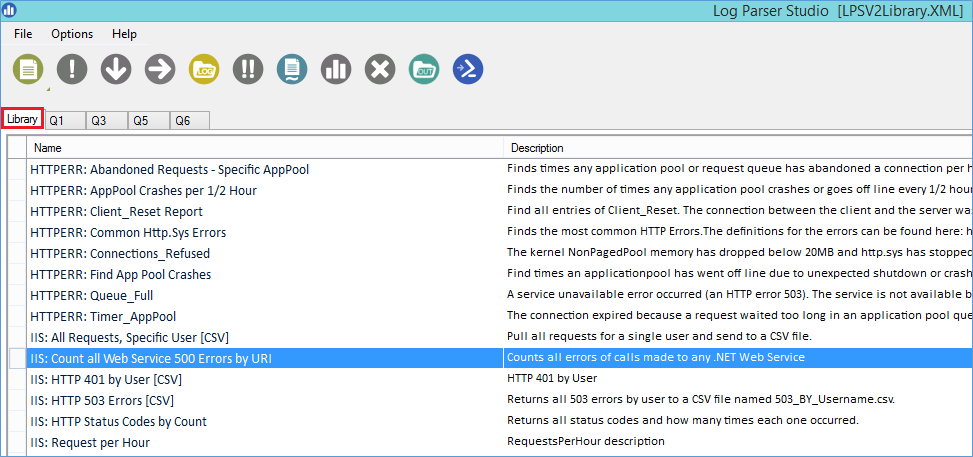
Every entry that starts with IIS is, of course, to analyze IIS Logs. I'll show you an example using "IIS: Top 25 Slow URLs", however, don't hesitate to play with the other queries.
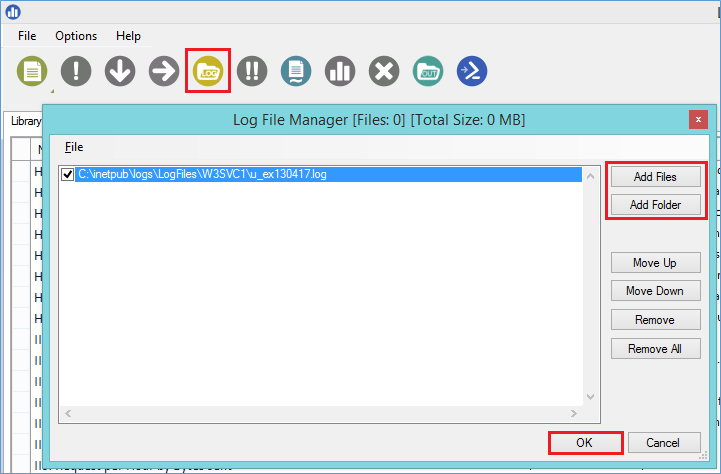
- Add a log file to analyze:
- Click on the fifth icons "Choose log files/folder to query"
- Click on "Add Files" or "Add Folder" and select the IIS log file to analyze or the folder containing IIS logs
- Click on OK
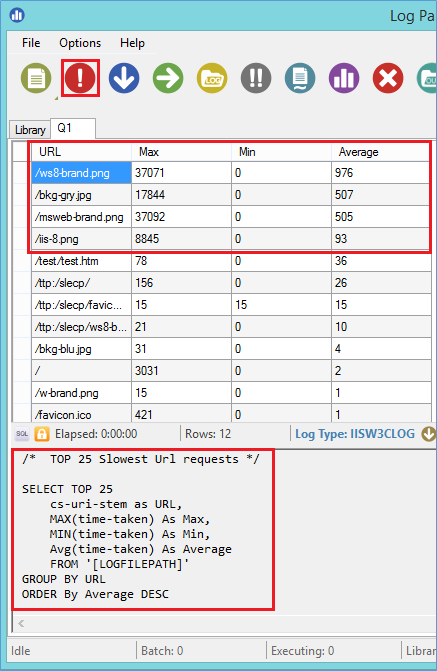
- Select the rule to execute by double clicking on "IIS: Top 25 Slow URLs"
- You should be able to see the detail of the LogParser query at the bottom of the window
- Then, click on the red circle with the exclamation mark to execute the query. In few seconds you should see the results:
It's as simple as this.
Then, some nice features are included in LogParser Studio:
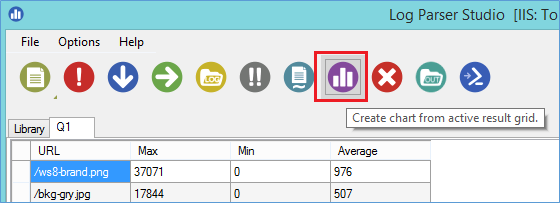
- Automatically generate graphs from the results:
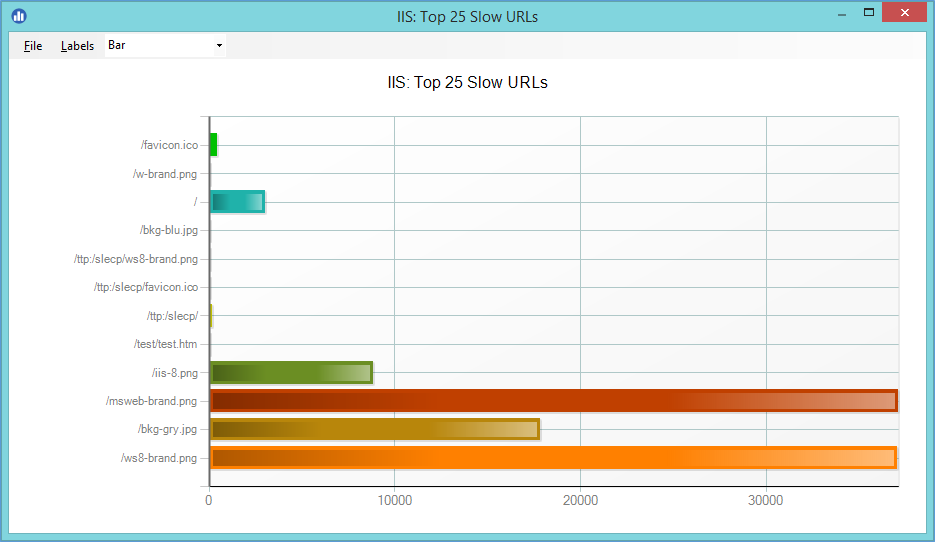
Just click on the Chart icons to generate a graph:
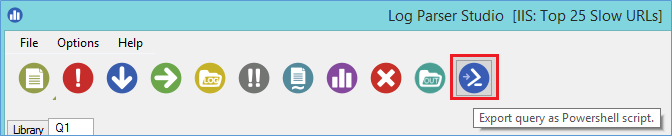
- Export the query as a PowerShell script:
And more. Just have a look at this tool it's really great.
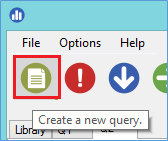
Once you'll be at ease with the tool and the queries, you'll surely want to develop your own queries.
Just press the New Query button and you'll be able to execute what you want:
To give you some ideas:
Sort out the entries between two specific times. Really useful when the log size is huge and you know when the issue occurred.
This will allow you to reduce the size of the data to analyze by only viewing data during a specific time:
Select TO_TIMESTAMP(TO_DATE(date), TO_TIME(time)) AS Timestamp, sc-status as Status, sc-substatus as Sub-Status, cs-method as Method, cs-uri-stem as URL, time-taken as Time-Taken FROM '[LOGFILEPATH]' where to_time(time) between timestamp('07:43:55','hh:mm:ss') and timestamp('07:44:21','hh:mm:ss') group by Timestamp, sc-status, sc-substatus, cs-method, cs-uri-stem, time-taken order by Timestamp, sc-status, sc-substatus, cs-uri-stem, time-taken asc
Sort out every error messages from the HTTPErr log file except the Timer_ConnectionIdle which is generally not an issue:
Select TO_TIMESTAMP(TO_DATE(date), TO_TIME(time)) AS Timestamp, c-ip, c-port, s-ip, s-port, cs-version, cs-method, cs-uri, sc-status, s-siteid, s-reason, s-queuename FROM '[LOGFILEPATH]' where s-reason <> 'Timer_ConnectionIdle'
In addition, LogParser can be used to detect or check if you're facing an attack.
The two following articles are very good articles to look at:
- DoS Attacks: https://technet.microsoft.com/en-us/magazine/2006.03.insidemscom.aspx
- Checking for intrusions: https://www.symantec.com/connect/articles/forensic-log-parsing-microsofts-logparser
I hope this article will be useful.
Sylvain Lecerf and the French Microsoft Support Team
Comments
Anonymous
May 16, 2014
Thank you - good summary!Anonymous
May 03, 2015
Nice work thanks!Anonymous
May 22, 2015
This is really good. Where and how i can run query manually like the one mentioned in your post? any other help full queries ?- Anonymous
January 03, 2017
The comment has been removed
- Anonymous
Anonymous
June 03, 2015
When i launch the Parser studio, i see loading library... and it stays like that for a while.Anonymous
June 11, 2015
Hi, Anything new about getteing fixed parsing logs from the Advanced Log module? Still not working.- Anonymous
January 03, 2017
You should try using the Enhanced Logging feature from IIS 8.5 and above. This replaces the Advanced Logging module and provides a much more reliable way to log requests that the Advanced Logging module could have given you: https://www.iis.net/learn/get-started/whats-new-in-iis-85/enhanced-logging-for-iis85
- Anonymous
Anonymous
March 07, 2016
any clue how to know who stopped and started a particular service on windows 2008 server using LOG PARSER tool- Anonymous
January 03, 2017
@Vikas: sorry, we don't do a lot of event log parsing in the team, it is mostly IIS and ASP.net stuff.
- Anonymous
Anonymous
November 14, 2016
does not work for me- Anonymous
January 03, 2017
What exactly does not work? The sample log parser queries or the Log Parser Studio UI itself? Can you provide an error message?
- Anonymous
Anonymous
February 02, 2017
The comment has been removed- Anonymous
May 04, 2017
Not sure how you could go about doing this. As mentioned before, the log parsing we are doing with Log Parser Studio is for IIS logs
- Anonymous
Anonymous
May 08, 2018
useful toolAnonymous
September 08, 2018
The comment has been removed