Concurrency Visualizer: Linking Visualizations to Application Phases
In my PDC 2008 presentation, I showed how the Concurrency Visualizer in Visual Studio 2010 allows users the option of instrumenting their code in order to link the visualizations with application constructs or phases of execution. The Concurrency Visualizer does not require any instrumentation to function, but for some complex application scenarios, it is often difficult to identify the regions of execution that are of interest to us. This is because a common performance investigation is usually focused on a certain "problem" that manifests itself during a portion of an application's execution.
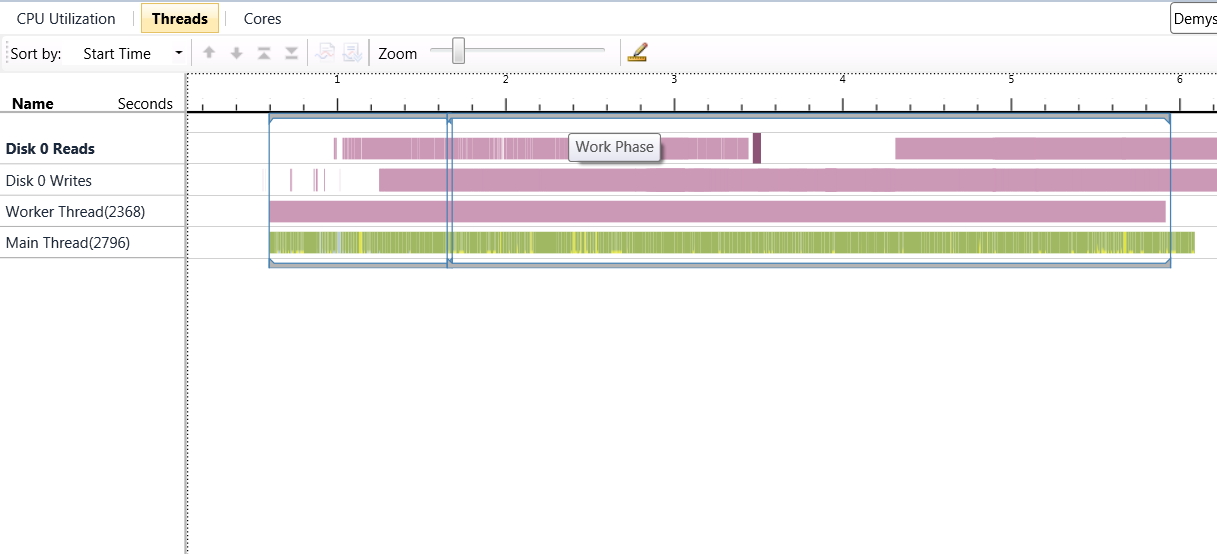
For VS2010 Beta 2, we have released a simple API that can be used for this purpose. This API is called the Scenario and is available for download for free from https://code.msdn.microsoft.com/Scenario. There are both native and managed implementations of this API, depending on the application that you are dealing with. The Scenario API includes many features that may be of interest to the user, so I urge you to read the documentation to learn about it. For our purposes, the Scenario API encapsulates the work necessary to generate ETW events that are consumed by the Concurrency Visualizer. In order to use it, you need to instantiate a Scenario object, and then mark the phases that are important to you by invoking the Begin and End APIs. When you do so, the Concurrency Visualizer will mark these regions with vertical markers in the CPU Utilization view, or rectangular regions in the Threads and Cores views. Each Scenario has an associated string describing it and these strings are shown in tooltips in the views. In the CPU Utilization view, the strings are shown when you hover on the vertical markers. In the other views, they show up when you hover on the horizontal connectors of the Scenario rectangles. If you're interested in analyzing work that happens in one of these regions, you can just zoom in on it and then switch among the various view and examine reports or interact with the UI to get your work done. You can also use the measurement tool in the Threads view toolbar to measure the time it takes to execute the various phases/scenarios. Here's a simple example that you can use to try out this functionality in VS2010 Beta 2 after downloading the appropriate bits from the above website.
#include "stdafx.h"
#include "Scenario.h"
int _tmain(int argc, _TCHAR* argv[])
{
double *testarray = (double *) malloc(100000000*sizeof(double));
// Initialize the Scenario object that we will use to mark phases
Scenario *myScenario = new Scenario(0, L"Scenario Example", (LONG) 0);
// Mark the start of initialization phase
myScenario->Begin(0, TEXT("Initialization"));
// Initialization
for (int i=0; i<100000000; i++)
testarray[i] = 0.0;
// Mark end of initialization
myScenario->End(0, TEXT("Initialization"));
// Mark start of work phase
myScenario->Begin(0, TEXT("Work Phase"));
// Work
srand(31);
for (int i=0; i<100000000; i++)
testarray[i] = rand()/RAND_MAX * 10000.0;
// Mark end of work phase
myScenario->End(0, TEXT("Work Phase"));
exit(0);
}
When you profile this app, you'll notice rectangular regions such as the ones depicted below that correspond to each Scenario Begin/End pair in the application. If you hover the mouse on the horizontal bars, you'll get a tooltip containing the text string that you associated with the Scenario phases. You can now zoom in on a phase that interests you, make timing measurements with the measurement tool etc. The Cores view has a similar UI as shown, but the CPU Utilization view shows vertical bars for the begin and end markers instead of rectangular regions. Unfortunately, in Beta 2 the bars use a shade of grey that's hard to see. You can also hover on those vertical markers to get the Scenario text.
Now go give this a try!

Comments
Anonymous
December 10, 2009
Hi Hazim, This looks cool. Is there an easy way to access the scenario api from managed code? Thanks, BrienAnonymous
December 10, 2009
Oops... disregard last comment... i see the managed api now. sorry.