Getting Insights from Data in Real Time : Azure Stream Analytics
Data analytics provides insights into data which help’s business take it to the next level. There are scenarios where you may want to analyze the data in real time, even before it’s saved into the database and perform analytics on it. Making decisions quickly in certain scenarios facilitate to have an edge over others and take the experience of your products to the next level. Also with Internet of things gaining momentum where billion of devices and sensors are connected to Internet, there is a need of processing these events in real time to perform appropriate actions.
What is the difference between traditional big data analytics and real time analytics?
To understand the difference between traditional big data analysis and real time analytics let’s explore the concept of data at rest and data in motion
This can be understood by the analogy of water, consider water in a lake to represent static data, similarly water falling through a fall is similar to the data in motion. So here we have to consider analytics with reference to time. Another interesting example to understand this consider you have to count the no. of cars in parking lot, you can count the cars in the entire lot. Now let’s say you need to calculate the number of cars passing a crossing, you have to analyses this data in a windows of time and analyses it in real time. The main idea that the analytics is carried out without storing the data
One of the biggest challenges in real time data analytics is time, effort and expertise needed to develop complex real time analytics solutions. Azure stream analytics helps overcome this entry barrier and allows to provision a solution for processing millions of events using familiar SQL queries with a few clicks.
Azure Stream Analytics is a fully managed service by Microsoft Azure which allows you to position a streaming solution for complex event processing and analytics within minutes as we will see in the example in the last section of this article.
Architecture of Azure Stream Analytics is given below:
- You can define input streams to be Data streams which can be coming through two sources currently
- Event Hub
- Azure Storage Blob
- Alternately input can also be from a reference data source which could be in a Blob
- You can write SQL like queries within windows which are discussed below to perform analysis on this data
- You can output this data to a SQL database , event hub or blob
- From this SQL database you could create solutions for presenting using Power BI dashboards or predictive analysis using Machine Learning
- Through the Even hub perform some actions with the sensors

Concept of Windows in Azure Stream Analytics Queries
To be able to write the queries for Stream Analytics, you need to understand the concepts of Windows there are three different kinds of windows which you can define with your SQL queries .Windows are nothing but time intervals within which events are analyzed.
- Tumbling Window
It’s a fixed length, non –overlapping time interval
- Hopping Window
The next windows overlaps with the previous windows by a certain fixed amount of time interval.
- Sliding Window
In case you want the overlap of the new next windows to be at every time duration we have sliding windows.
Getting Started with Azure Stream Analytics
Currently Azure stream analytics in Public Preview. To be able to try Azure Stream Analytics you must have an Azure subscription. In case you don’t have an Azure subscription you can sign up for a free one month trial here
We will implement a sample toll both, cars continuously keep on entering the toll and exiting the toll. We would be assuming sensors have been installed at the entry and exit which are continuously sending data to event hub and a vehicle registration data which is available for lookup. Using Stream Analytics we would calculate no. of cars which pass through this toll in every five minutes using the data available from the input stream. Then we would calculate the average time taken by a car at the toll, this analysis would help in increasing the efficiency of the Toll Booth.
To get started you would need to provision the following:
- Event Hubs: You would need to provision two event hubs “Entry” and “Exit“
- SQL Database: You would provision a SQL Database for storing the output results from Stream Analytics jobs
- Azure Storage: To store reference data about Vehicle registration.
In case you are new to Azure , detailed steps for setting up the above can be found here.(https://1drv.ms/1ARJcxl)
Create Stream Analytics Job
- In Azure Portal navigate to Stream Analytics and click on the “New” button at the bottom to create a new analytics job. Currently the service is in preview and is available in limited regions

2. “QuickCreate”, select either Western Europe or “Central US” as the region. For regional monitoring storage account, create a new storage account. Azure Stream analytics would use this account to store monitoring information for all your future jobs.

3. Define Input sources.
3.1 We need to define input sources for Stream Analytics, we would be using Event hubs for input
Steps to add Input Sources
- Click on the created Stream Analytics job à Click on the Input tab
- Select “Data Stream “, as an input job.

3. 1Select “Event Hub” as the input source

4. Add input alias as “EntryStream”. Choose the event hub name you have created for this demo from the dropdown
5. Move to the next page select default values for all Serialization settings on this page.
6. Repeat the above steps for creating an Exit Stream and choosing the “exit” hub as the event hub this time
3.2 Adding Vehicle Registration Data as reference as another input Source
Steps to be followed
- Click on Add Input at bottom.

2. Add reference data to your input job

3.Select the storage account you had created while setting up the lab environment. Container name should be “tolldata” and blob name should be “registration.csv”

4. Choose the existing serialization settings and Click Ok
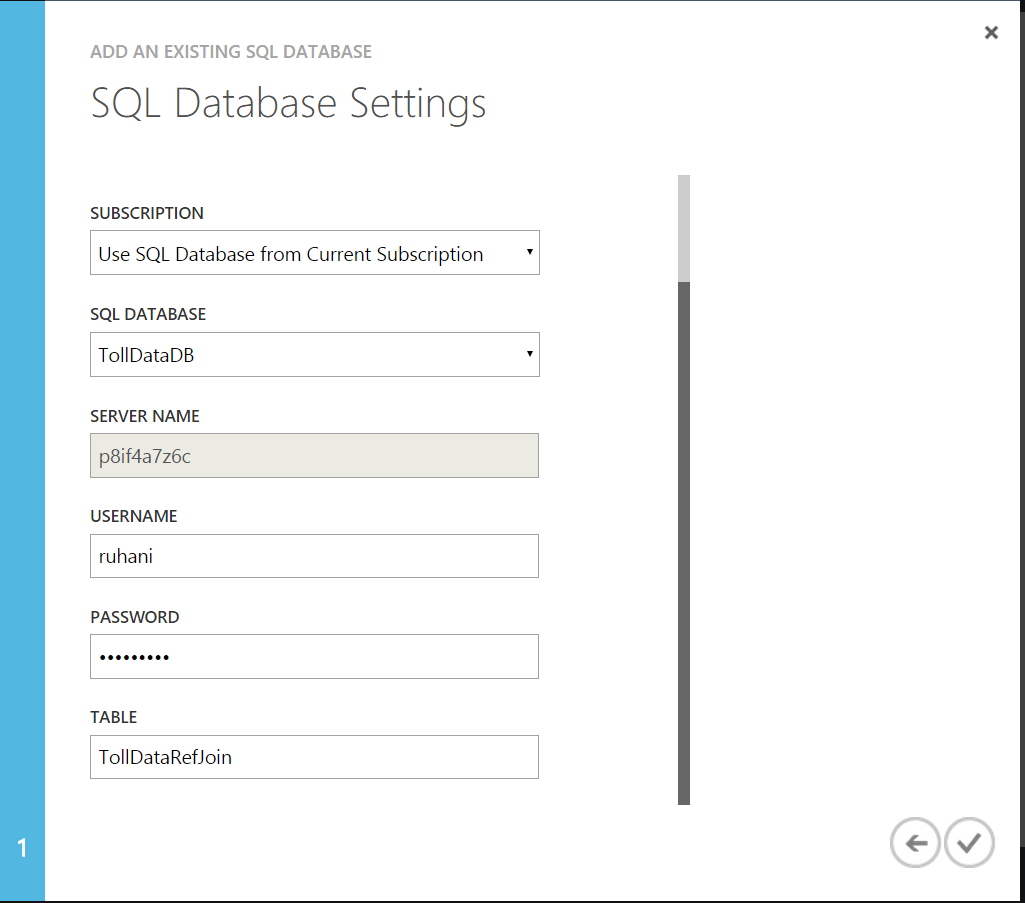
3.3 Output Data
- Go to “Output” tab and click “Add an output”

- Choose SQL databaseà Choose the SQL server database from the drop down, that you created while setting up the lab. Enter the username and password for this server.
Table name would be “TollDataRefJoin”
AZURE STREAM ANALYTICS QUERIES
In the Query tab you can write in the familiar SQL syntax itself, which would perform the transformation over the incoming data streams.

Download and extract TollAppData.zip to your local machine. This contains the following files:
1. Entry.json
2. Exit.json
3. Registration.json
Now we will attempt to answer several business questions related to Toll data and construct Stream Analytics queries that can be used in Azure Stream Analytics to provide a relevant answer.
QUESTION 1 - NUMBER OF VEHICLES ENTERING A TOLL BOOTH
For testing this query we upload sample data representing data from a stream. You can find this sample JSON data file in TollData zip folder located here.
Steps
- Open the Azure Management portal and navigate to your created Azure Stream Analytic job. Open the Query tab and copy paste Query below
|
To validate this query against sample data, click the Test button. In the dialog that opens, navigate to Entry.json (downloaded on your local system in Data folder) with sample data from the EntryTime event stream.
QUESTION 2 - REPORT TOTAL TIME FOR EACH CAR TO PASS THROUGH THE TOLL BOOTH
We want to find average time required for the car to pass the toll to assess efficiency and customer experience.
|
Click test and specify sample input files for EntryTime and ExitTime.
Click the checkbox to test the query and view output:
QUESTION 3 – REPORT ALL COMMERCIAL VEHICLES WITH EXPIRED REGISTRATION
Azure Stream Analytics can use static snapshots of data to join with temporal data streams. To demonstrate this capability we will use the following sample question.
If a commercial vehicle is registered with the Toll Company, they can pass through the toll booth without being stopped for inspection. We will use Commercial Vehicle Registration lookup table to identify all commercial vehicles with expired registration.
Note that testing a query with Reference Data requires that an input source for the Reference Data is defined.
To test this query, paste the query into the Query tab, click Test, and specify the 2 input sources
Following results would appear as shown below
|
START THE STREAM ANALYTICS JOB
Now as we have written our first Azure Stream Analytics query, it is time to finish the configuration and start the job.
Save the query from Question 3, which will produce output that matches the schema of our output table TollDataRefJoin.
Navigate to the job Dashboard and click Start.

Starting the job can take a few minutes. You will be able to see the status on the top-level page for Stream Analytics.

View the Table data in the SQL Database to view the results of the above query :)
References:
https://azure.microsoft.com/en-in/documentation/services/stream-analytics/
https://azure.microsoft.com/en-in/documentation/services/stream-analytics/
Comments
Anonymous
October 13, 2015
thanx its very helpful :)Anonymous
December 03, 2015
Thanks avi