The Console developer tool in Microsoft Edge logs information that's associated with a webpage, such as JavaScript, network requests, and security errors. You can use the Console for interactive debugging and ad hoc testing.
To open the Console tool in Microsoft Edge, press the F12 key to access the developer tool window (or right-click on the page, and then select Inspect Element). Then, select the Console tab at the top of the window.
You can also use the Console tool to communicate to and from a running webpage. You can use the Console to:
- Post standard error and status codes and informational messages as your code runs.
- Generate custom debug logs from the Console API calls you include in your code.
- Provide a command line and interactive tree view for inspecting current return values of key variables and functions.
Parts of the Console
The following image shows the key parts of the Console:
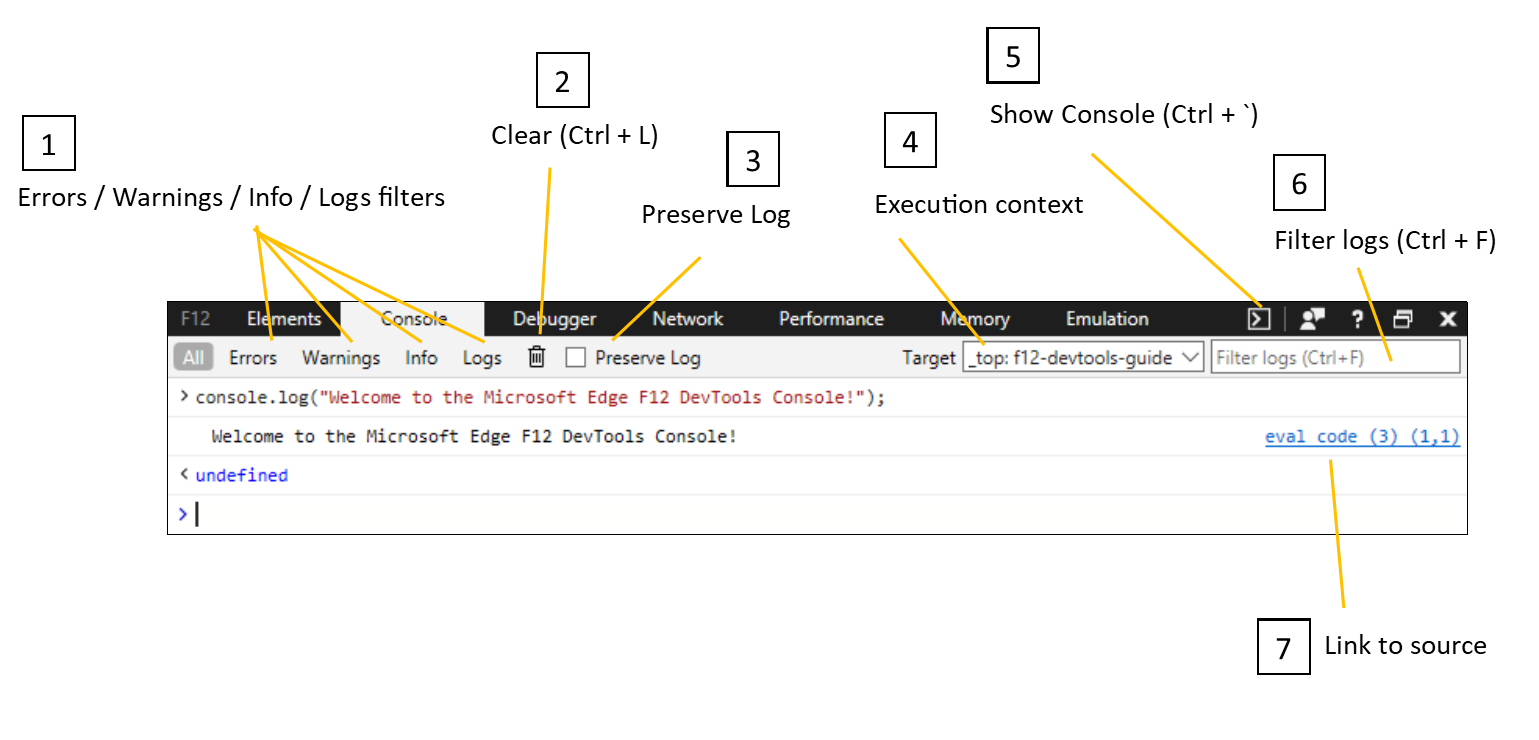
Errors / Warnings / Info / Logs buttons: Filter console output by the specified type. You can multi-select buttons by holding down the Ctrl key. The All button clears all filters.
Clear button (Ctrl+L): The Clear button clears the current console display.
Preserve Log check box: Selecting the Preserve Log check box persists your console output across page refreshes and closing and reopening DevTools. The Console history clears only when the tab is closed or you manually clear the Console.
Target: Use the Target drop-down menu to switch to a different execution context, such as an
<iframe>in your page or a running extension. By default, the top-level frame of your page is selected. Hovering over a selected frame displays a tooltip that shows the full URL for that resource.Show Console / Hide Console button (Ctrl+ ` ): In addition to the Console panel, you can use the console from the bottom of any other DevTools panel by pressing the Show Console / Hide Console button. The button has no effect when DevTools is open to the Console panel.
Filter logs (Ctrl+F) : You can also filter logs by using a specific text string in the search box.
Debugger: Select any blue source link to open the DevTools Debugger to that particular line of code for further inspection.
Shortcuts
| Action | Shortcut |
|---|---|
| Launch DevTools with Console in focus | Ctrl + Shift + J |
| Switch to the Console | Ctrl + 2 |
| Show/hide the Console from another DevTools tab | Ctrl + ` (back tick) |
| Execute (single-line command) | Enter |
| Line break without executing (multi-line command) | Shift + Enter or Ctrl + Enter |
| Clear the Console of all messages | Ctrl + L |
| Filter logs (set focus to search box) | Ctrl + F |
| Accept auto-completion suggestion (when in focus) | Enter or Tab |
| Previous/next auto-completion suggestion | Up arrow key/Down arrow key |