你当前正在访问 Microsoft Azure Global Edition 技术文档网站。 如果需要访问由世纪互联运营的 Microsoft Azure 中国技术文档网站,请访问 https://docs.azure.cn。
风力发电是可以替代化石燃料的,有助于应对气候变化的一种能源。 因为风天生就不稳定,所以风力发电运营商需要建立机器学习 (ML) 模型来预测风力发电能力。 为满足电力需求,保证电网稳定运行,需要进行此预测。 本教程逐步讲解如何将 Azure Maps 天气预报数据与用于天气读数的演示数据结合使用。 可以通过调用 Azure Maps 天气服务来请求天气预报数据。
在本教程中,将:
- 创建并运行 VS Code 中的 Jupyter Notebook。
- 从该文件加载演示数据。
- 在 Python 中调用 Azure Maps REST API。
- 在地图上呈现位置数据。
- 使用 Azure Maps 的每日预报天气数据来扩充演示数据。
- 在图中绘制预报数据。
注意
可以从 天气图 Jupyter Notebook 存储库下载此项目的 Jupyter Notebook 文件。
先决条件
如果没有 Azure 订阅,请在开始之前创建一个免费帐户。
- Azure Maps 帐户
- 订阅密钥
- Visual Studio Code
- VS Code 中的 Jupyter Notebook 的实践知识
- 已为在 Jupyter Notebook 中使用 Python 设置了环境。 有关详细信息,请参阅设置环境。
注意
有关 Azure Maps 中身份验证的详细信息,请参阅在 Azure Maps 中管理身份验证。
安装项目级包
“EV 路由和可抵达范围”项目依赖于 aiohttp 和 IPython python 库。 可使用 pip 在 Visual Studio 终端中安装这些项:
pip install aiohttp
pip install ipython
pip install pandas
在 Visual Studio Code 中打开 Jupyter Notebook
下载并打开本教程中使用的 Notebook:
在 GitHub 的 AzureMapsJupyterSamples 存储库中打开文件 weatherDataMaps.ipynb。
选择屏幕右上角的“下载原始文件”按钮,在本地保存文件。

通过右键单击下载的 Notebook,然后选择“打开方式”>“Visual Studio Code”以在 Visual Studio Code 中打开该文件,或通过 VS Code 文件资源管理器打开该文件。
加载所需的模块和框架
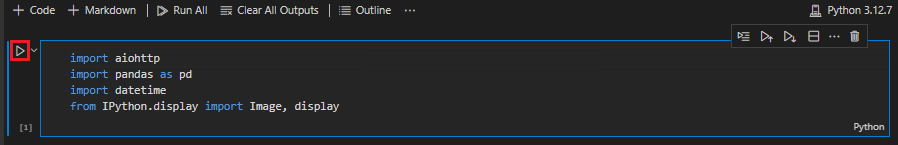
添加代码后,可使用单元格左侧的“运行”图标运行单元格,输出显示在代码单元格下方。
运行以下脚本,加载全部所需的模块和框架。
import aiohttp
import pandas as pd
import datetime
from IPython.display import Image, display
导入天气数据
本教程使用安装在四个不同风力涡轮机上的传感器发送的天气数据。 示例数据包含 30 天的天气读数。 这些读数是从每个涡轮机位置附近的天气数据中心收集的。 演示数据包含温度、风速和风向的数据读数。 可以从 GitHub 下载 weather_dataset_demo.csv 中包含的演示数据。 以下脚本将演示数据导入 Azure 笔记本。
df = pd.read_csv("./data/weather_dataset_demo.csv")
请求每日预报数据
在我们的方案中,我们希望请求每个传感器位置的每日预报数据。 以下脚本调用 Azure Maps 天气服务的每日预报 API。 此 API 返回每个风力涡轮机在未来 15 天(自当前日期算起)的每日天气预报。
subscription_key = "Your Azure Maps key"

# Get a lists of unique station IDs and their coordinates
station_ids = pd.unique(df[['StationID']].values.ravel())
coords = pd.unique(df[['latitude','longitude']].values.ravel())

years,months,days = [],[],[]
dates_check=set()
wind_speeds, wind_direction = [], []

# Call azure maps Weather service to get daily forecast data for 15 days from current date
session = aiohttp.ClientSession()
j=-1
for i in range(0, len(coords), 2):
    wind_speeds.append([])
    wind_direction.append([])

    query = str(coords[i])+', '+str(coords[i+1])
    forecast_response = await(await session.get("https://atlas.microsoft.com/weather/forecast/daily/json?query={}&api-version=1.0&subscription-key={}&duration=15".format(query, subscription_key))).json()
    j+=1
    for day in range(len(forecast_response['forecasts'])):
            date = forecast_response['forecasts'][day]['date'][:10]
            wind_speeds[j].append(forecast_response['forecasts'][day]['day']['wind']['speed']['value'])
            wind_direction[j].append(forecast_response['forecasts'][day]['day']['windGust']['direction']['degrees'])

            if date not in dates_check:
                year,month,day= date.split('-')
                years.append(year)
                months.append(month)
                days.append(day)
                dates_check.add(date)

await session.close()
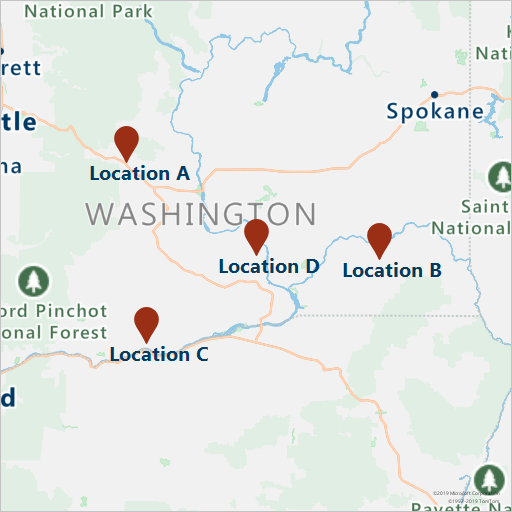
以下脚本通过调用获取地图图像服务在地图上呈现涡轮机位置。
# Render the turbine locations on the map by calling the Azure Maps Get Map Image service
session = aiohttp.ClientSession()
pins="default|la-25+60|ls12|lc003C62|co9B2F15||'Location A'{} {}|'Location B'{} {}|'Location C'{} {}|'Location D'{} {}".format(coords[1],coords[0],coords[3],coords[2],coords[5],coords[4], coords[7],coords[6])
image_response = "https://atlas.microsoft.com/map/static?subscription-key={}&api-version=2024-04-01&layer=basic&style=main&zoom=6¢er={},{}&pins={}".format(subscription_key,coords[7],coords[6],pins)
static_map_response = await session.get(image_response)
poi_range_map = await static_map_response.content.read()
await session.close()
display(Image(poi_range_map))
基于站点 ID 将预报数据与演示数据整合。 工作站 ID 适用于天气数据中心。 此分组使用预报数据补充了演示数据。
# Group forecasted data for all locations
df = df.reset_index(drop=True)
forecast_data = pd.DataFrame(columns=['StationID','latitude','longitude','Year','Month','Day','DryBulbCelsius','WetBulbFarenheit','WetBulbCelsius','DewPointFarenheit','DewPointCelsius','RelativeHumidity','WindSpeed','WindDirection'])

for i in range(len(station_ids)):
    loc_forecast = pd.DataFrame({'StationID':station_ids[i], 'latitude':coords[0], 'longitude':coords[1], 'Year':years, 'Month':months, 'Day':days, 'WindSpeed':wind_speeds[i], 'WindDirection':wind_direction[i]})
    forecast_data = pd.concat([forecast_data,loc_forecast], axis=0, sort=False)

combined_weather_data = pd.concat([df,forecast_data])
grouped_weather_data = combined_weather_data.groupby(['StationID'])
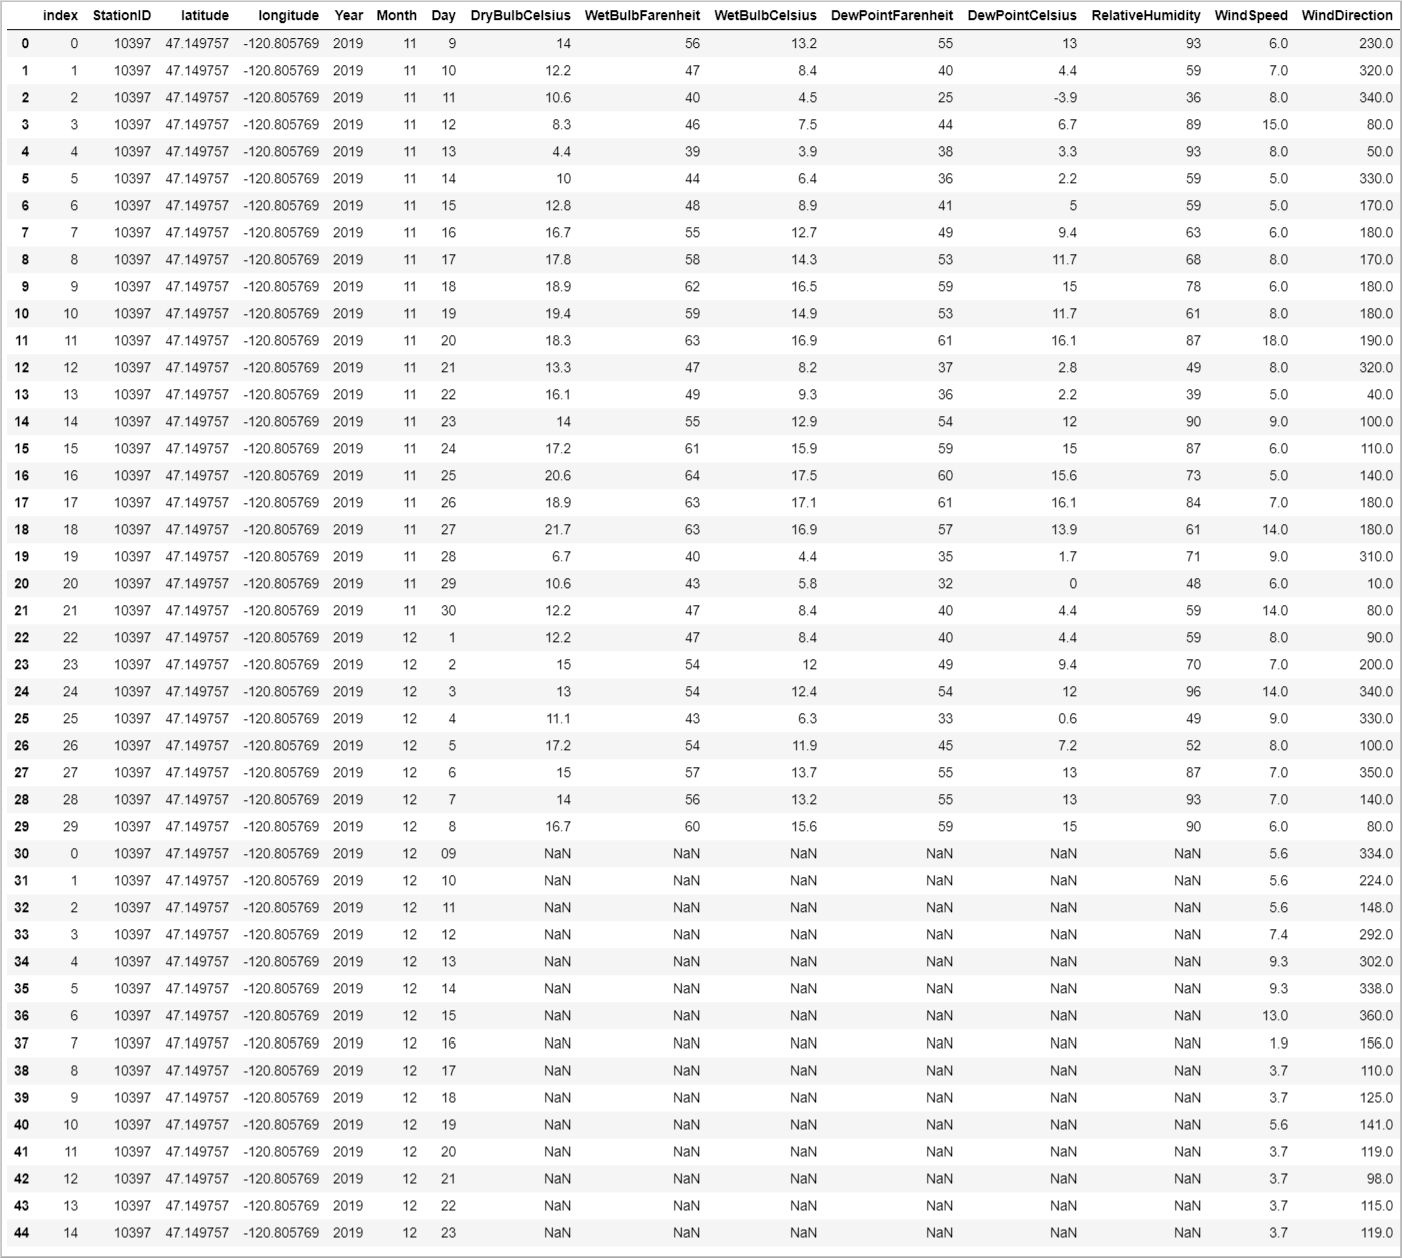
下表显示了某个涡轮机位置的、合并后的历史数据和预报数据。
# Display data for first location
grouped_weather_data.get_group(station_ids[0]).reset_index()
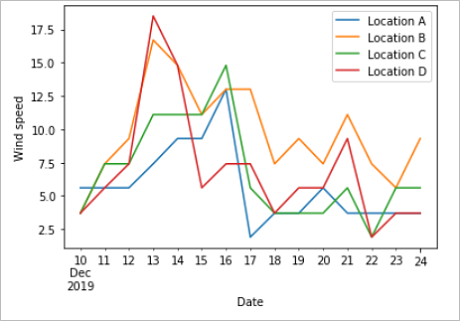
绘制预报数据
针对所预报的日期来绘制预报值。 此绘图可以让我们看到未来 15 天风速和风向的变化。
# Plot wind speed
curr_date = datetime.datetime.now().date()
windsPlot_df = pd.DataFrame({ 'Location A': wind_speeds[0], 'Location B': wind_speeds[1], 'Location C': wind_speeds[2], 'Location D': wind_speeds[3]}, index=pd.date_range(curr_date,periods=15))
windsPlot = windsPlot_df.plot.line()
windsPlot.set_xlabel("Date")
windsPlot.set_ylabel("Wind speed")
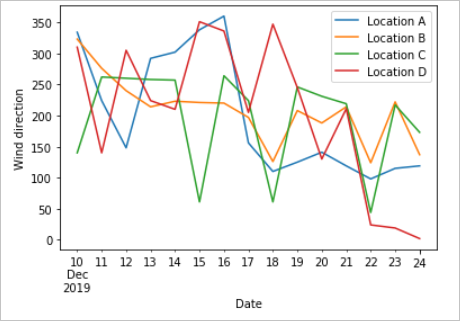
#Plot wind direction
windsPlot_df = pd.DataFrame({ 'Location A': wind_direction[0], 'Location B': wind_direction[1], 'Location C': wind_direction[2], 'Location D': wind_direction[3]}, index=pd.date_range(curr_date,periods=15))
windsPlot = windsPlot_df.plot.line()
windsPlot.set_xlabel("Date")
windsPlot.set_ylabel("Wind direction")
下图直观显示了预报数据。 风速变化见左图。 风向变化见右图。 此数据是从请求数据之日起的未来 15 天的预测。
在本教程中,你已了解了如何调用 Azure Maps REST API 来获取天气预报数据。 你还了解了如何在图表上将数据可视化。
若要了解本教程中使用的 Azure Maps API,请参阅:
有关 Azure Maps REST API 的完整列表,请参阅 Azure Maps REST API。