你当前正在访问 Microsoft Azure Global Edition 技术文档网站。 如果需要访问由世纪互联运营的 Microsoft Azure 中国技术文档网站,请访问 https://docs.azure.cn。
教程:创建地理空间可视化效果
本教程适用于想要使用 Kusto 查询语言 (KQL) 进行地理空间可视化的用户。 地理空间聚类是基于地理位置组织和分析数据的一种方式。 KQL 提供多种用于执行地理空间聚类分析的方法和用于地理空间可视化的工具。
本教程介绍以下操作:
在地图上绘制点
若要将地图上的点可视化,请使用 project 选择包含经度的列,并选择包含纬度的列。 然后,使用 render 在 kind 设置为 map 的散点图中查看结果。
StormEvents
| take 100
| project BeginLon, BeginLat
| render scatterchart with (kind = map)
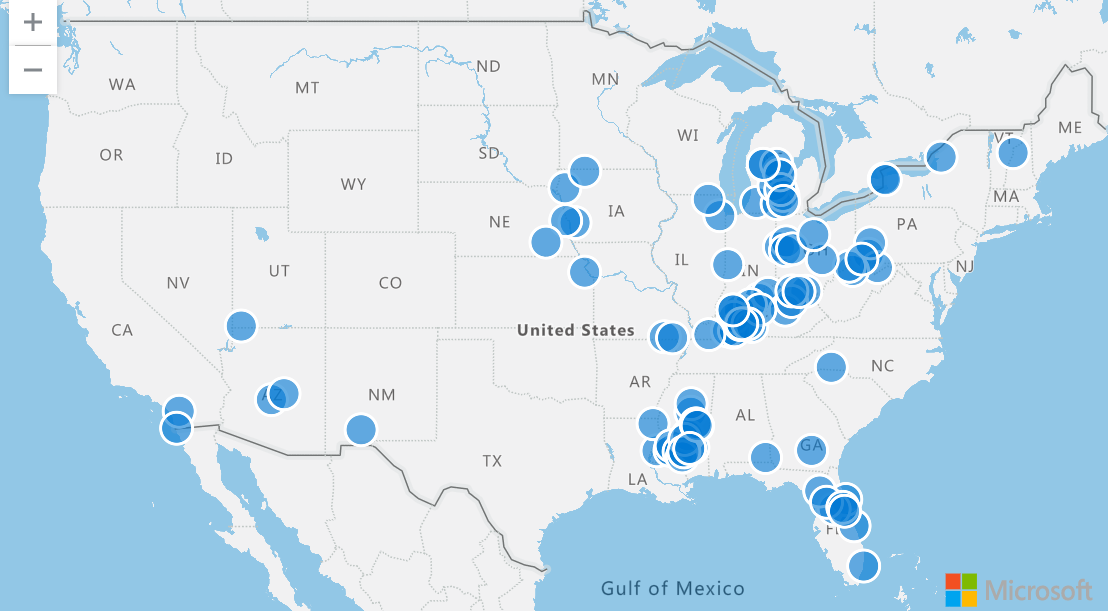
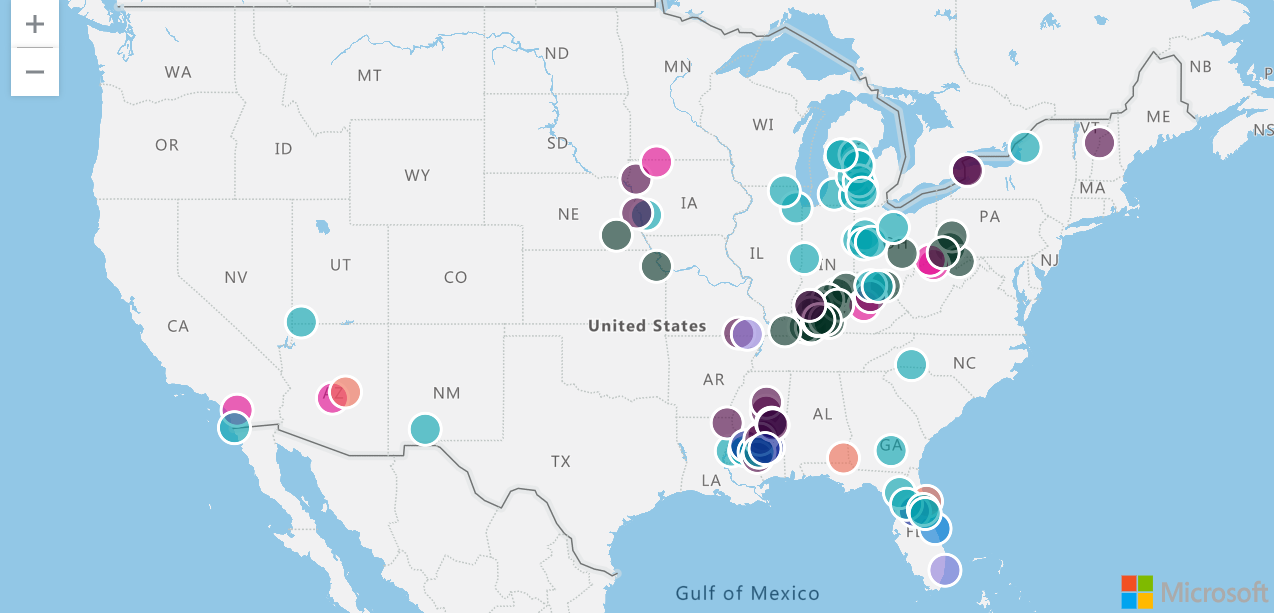
绘制多个点系列
若要将多个点系列可视化,请使用 project 选择经度和纬度,以及用于定义系列的第三列。
在以下查询中,系列为 EventType。 这些点根据其 EventType以不同的颜色显示,选择时会显示列的内容 EventType 。
StormEvents
| take 100
| project BeginLon, BeginLat, EventType
| render scatterchart with (kind = map)
还可以在执行 render 时显式指定 xcolumn(经度)、ycolumn(纬度)和 series。 当结果中的列多于经度、纬度和序列列时,此规范是必需的。
StormEvents
| take 100
| render scatterchart with (kind = map, xcolumn = BeginLon, ycolumns = BeginLat, series = EventType)
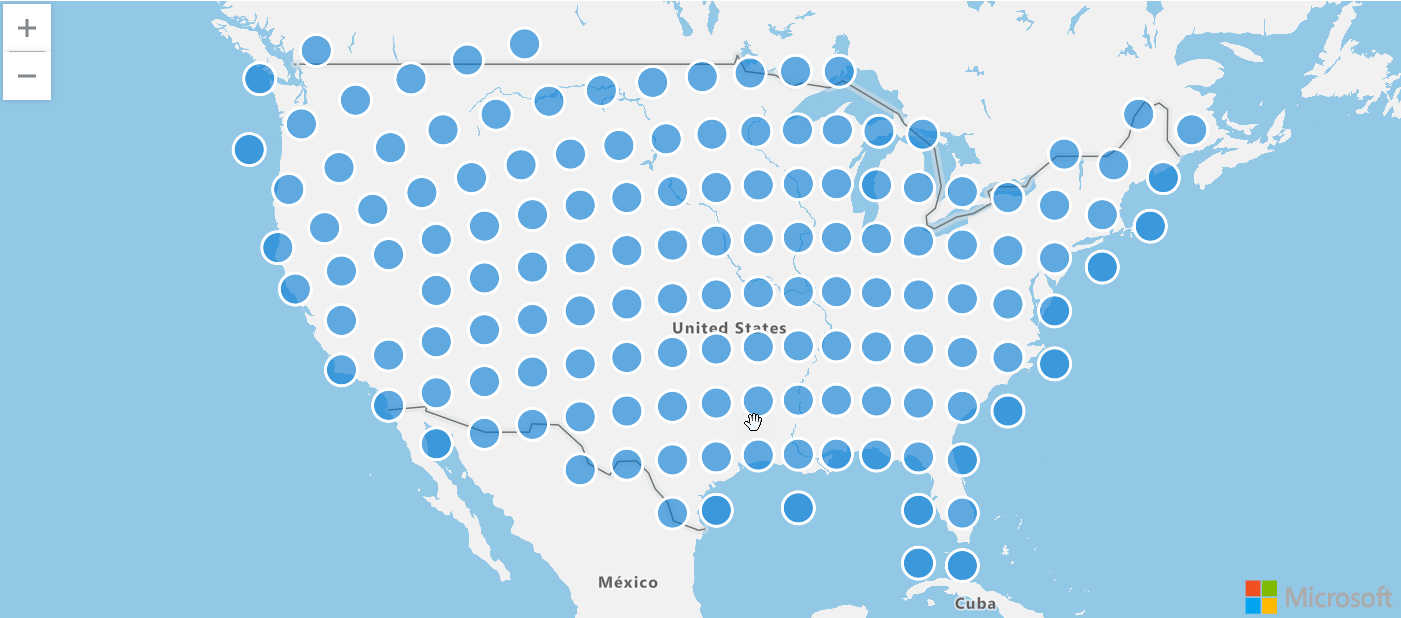
使用 GeoJSON 值在地图上绘制点
动态 GeoJSON 值可以更改或更新,通常用于实时地图应用程序。 使用动态 GeoJSON 值在地图上绘制点可以获得更高的灵活性,并可以更好地控制地图上数据的表示,而使用普通的纬度和经度值做不到这一点。
以下查询使用 geo_point_to_s2cell 和 geo_s2cell_to_central_point 在散点图中绘制风暴事件。
StormEvents
| project BeginLon, BeginLat
| summarize by hash=geo_point_to_s2cell(BeginLon, BeginLat, 5)
| project point = geo_s2cell_to_central_point(hash)
| project lng = toreal(point.coordinates[0]), lat = toreal(point.coordinates[1])
| render scatterchart with (kind = map)
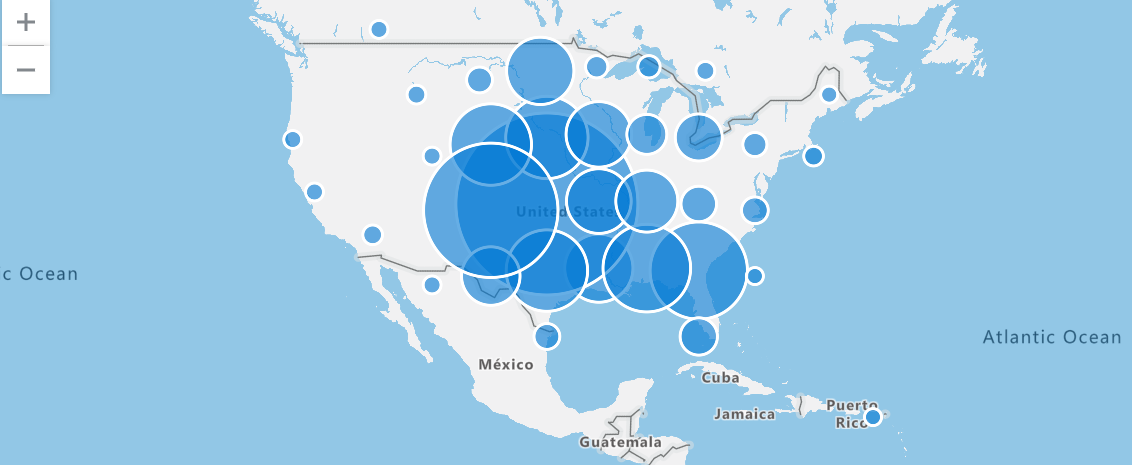
使用大小可变的气泡表示数据点
通过在每个聚类中执行聚合然后绘制聚类的中心点,来可视化数据点的分布。
例如,以下查询筛选“龙卷风”(Tornado) 事件类型的所有风暴事件。 然后它根据事件的经度和纬度将事件分组为聚类,统计每个聚类中的事件数,投影聚类的中心点,然后呈现地图以可视化结果。 根据较大的气泡,可以清楚地看到龙卷风发生次数最多的区域。
StormEvents
| where EventType == "Tornado"
| project BeginLon, BeginLat
| where isnotnull(BeginLat) and isnotnull(BeginLon)
| summarize count_summary=count() by hash = geo_point_to_s2cell(BeginLon, BeginLat, 4)
| project geo_s2cell_to_central_point(hash), count_summary
| extend Events = "count"
| render piechart with (kind = map)
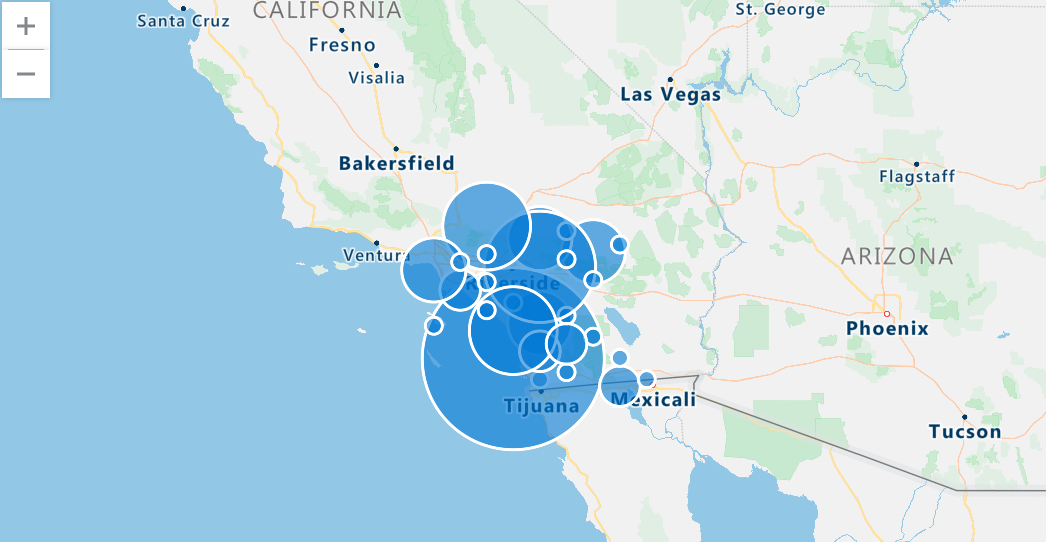
显示特定区域中的点
使用多边形定义区域,并使用 geo_point_in_polygon 函数筛选该区域中发生的事件。
以下查询定义一个表示南加州区域的多边形,并筛选该区域中的风暴事件。 然后它将事件分组为聚类,统计每个聚类中的事件数,投影聚类的中心点,然后呈现地图以可视化聚类。
let southern_california = dynamic({
    "type": "Polygon",
    "coordinates": [[[-119.5, 34.5], [-115.5, 34.5], [-115.5, 32.5], [-119.5, 32.5], [-119.5, 34.5]]
    ]});
StormEvents
| where geo_point_in_polygon(BeginLon, BeginLat, southern_california)
| project BeginLon, BeginLat
| summarize count_summary = count() by hash = geo_point_to_s2cell(BeginLon, BeginLat, 8)
| project geo_s2cell_to_central_point(hash), count_summary
| extend Events = "count"
| render piechart with (kind = map)
显示 LineString 上的附近点
以下查询查找沿指定的 LineString(表示已定义路径)发生的附近风暴事件。 在本例中,LineString 是通往 Key West 的道路。 geo_distance_point_to_line () 函数用于根据风暴事件与定义的 LineString 的邻近性来筛选这些事件。 如果事件距离 LineString 不到 500 米,则在地图上呈现该事件。
let roadToKeyWest = dynamic({
"type":"linestring",
"coordinates":[
          [
            -81.79595947265625,
            24.56461038017685
          ],
          [
            -81.595458984375,
            24.627044746156027
          ],
          [
            -81.52130126953125,
            24.666986385216273
          ],
          [
            -81.35650634765625,
            24.66449040712424
          ],
          [
            -81.32354736328125,
            24.647017162630366
          ],
          [
            -80.8099365234375,
            24.821639356846607
          ],
          [
            -80.62042236328125,
            24.93127614538456
          ],
          [
            -80.37872314453125,
            25.175116531621764
          ],
          [
            -80.42266845703124,
            25.19251511519153
          ],
          [
            -80.4803466796875,
            25.46063471847754
          ]
        ]});
StormEvents
| where isnotempty(BeginLat) and isnotempty(BeginLon)
| project BeginLon, BeginLat, EventType
| where geo_distance_point_to_line(BeginLon, BeginLat, roadToKeyWest) < 500
| render scatterchart with (kind=map)

在多边形中显示附近的点
以下查询查找指定多边形中发生的附近风暴事件。 在本例中,多边形是通往基韦斯特的道路。 geo_distance_point_to_polygon () 函数用于根据风暴事件与定义的多边形的邻近性来筛选这些事件。 如果事件位于多边形的 500 米范围内,则会在地图上呈现该事件。
let roadToKeyWest = dynamic({
"type":"polygon",
"coordinates":[
          [
            [
              -80.08209228515625,
              25.39117928167583
            ],
            [
              -80.4913330078125,
              25.517657429994035
            ],
            [
              -80.57922363281249,
              25.477992320574817
            ],
            [
              -82.188720703125,
              24.632038149596895
            ],
            [
              -82.1942138671875,
              24.53712939907993
            ],
            [
              -82.13104248046875,
              24.412140070651528
            ],
            [
              -81.81243896484375,
              24.43714786161562
            ],
            [
              -80.58746337890625,
              24.794214972389486
            ],
            [
              -80.08209228515625,
              25.39117928167583
            ]
          ]
        ]});
StormEvents
| where isnotempty(BeginLat) and isnotempty(BeginLon)
| project BeginLon, BeginLat, EventType
| where geo_distance_point_to_polygon(BeginLon, BeginLat, roadToKeyWest) < 500
| render scatterchart with (kind=map)

根据地理空间数据查找异常
以下查询对特定状态下发生的风暴事件执行分析。 查询使用 S2 单元格和临时聚合来调查损坏模式。 结果是一个可视异常图表,该图表描绘了随时间推移风暴引起的破坏中的任何不规则或偏差,提供对指定州边界内风暴影响的详细透视图。
let stateOfInterest = "Texas";
let statePolygon = materialize(
    US_States
    | extend name = tostring(features.properties.NAME)
    | where name == stateOfInterest
    | project geometry=features.geometry);
let stateCoveringS2cells = statePolygon
    | project s2Cells = geo_polygon_to_s2cells(geometry, 9);
StormEvents
| extend s2Cell = geo_point_to_s2cell(BeginLon, BeginLat, 9)
| where s2Cell in (stateCoveringS2cells)
| where geo_point_in_polygon(BeginLon, BeginLat, toscalar(statePolygon))
| make-series damage = avg(DamageProperty + DamageCrops) default = double(0.0) on StartTime step 7d
| extend anomalies=series_decompose_anomalies(damage)
| render anomalychart with (anomalycolumns=anomalies)

相关内容
- 查看地理空间聚类分析的用例:汽车测试车队的数据分析
- 了解用于地理空间数据处理和分析的 Azure 体系结构
- 阅读白皮书以全面了解 Azure 数据资源管理器
反馈
即将发布:在整个 2024 年,我们将逐步淘汰作为内容反馈机制的“GitHub 问题”,并将其取代为新的反馈系统。 有关详细信息,请参阅:https://aka.ms/ContentUserFeedback。
提交和查看相关反馈