在 Microsoft Fabric 中将示例数据复制到湖屋,然后使用数据工厂数据流对其进行转换
在本教程中,我们提供了一个常见方案的端到端步骤,即使用管道以高性能副本将源数据加载到湖屋中,然后通过数据流转换数据,使用户可以轻松加载和转换数据。
先决条件
已启用 Microsoft Fabric 的工作区。 如果还没有工作区,请参阅创建工作区一文。
创建数据管道
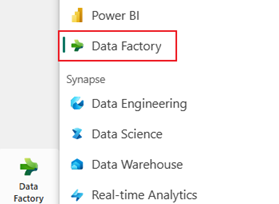
切换到数据工厂体验。
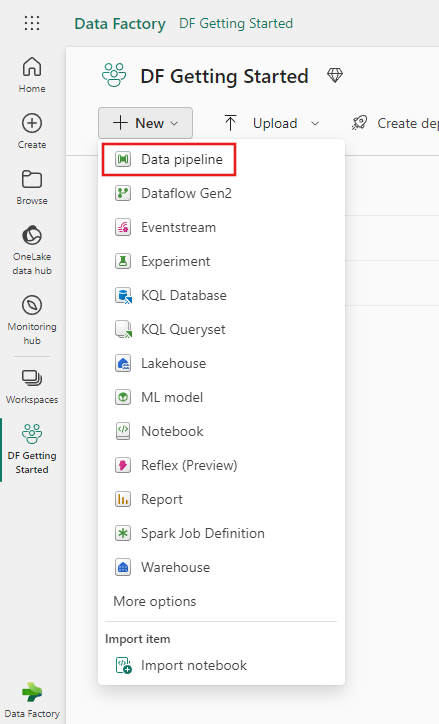
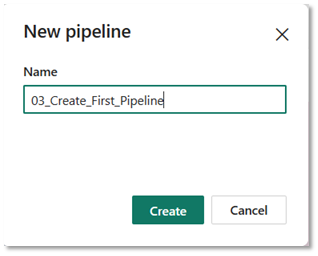
选择“新建”,然后选择“数据管道”,再输入管道的名称。
使用管道将示例数据加载到湖屋
按照以下步骤将示例数据加载到湖屋。
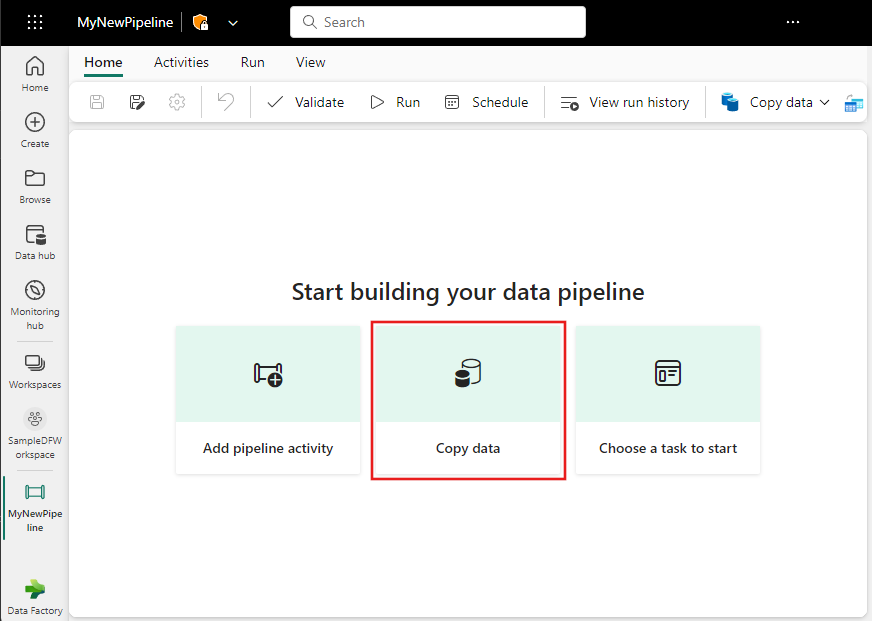
步骤 1:从复制助手开始
选择画布上的“复制数据”,打开“复制助手”工具以开始使用。
步骤 2:配置源
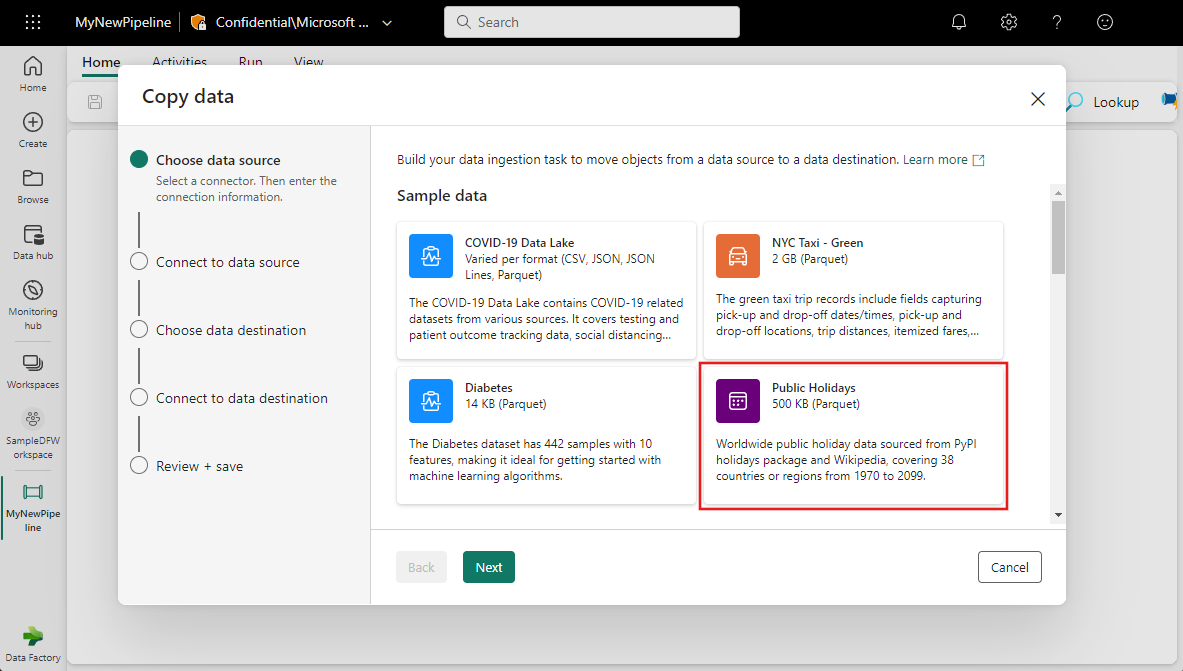
从数据源的“示例数据”选项中选择“公共节假日”,然后选择“下一步”。
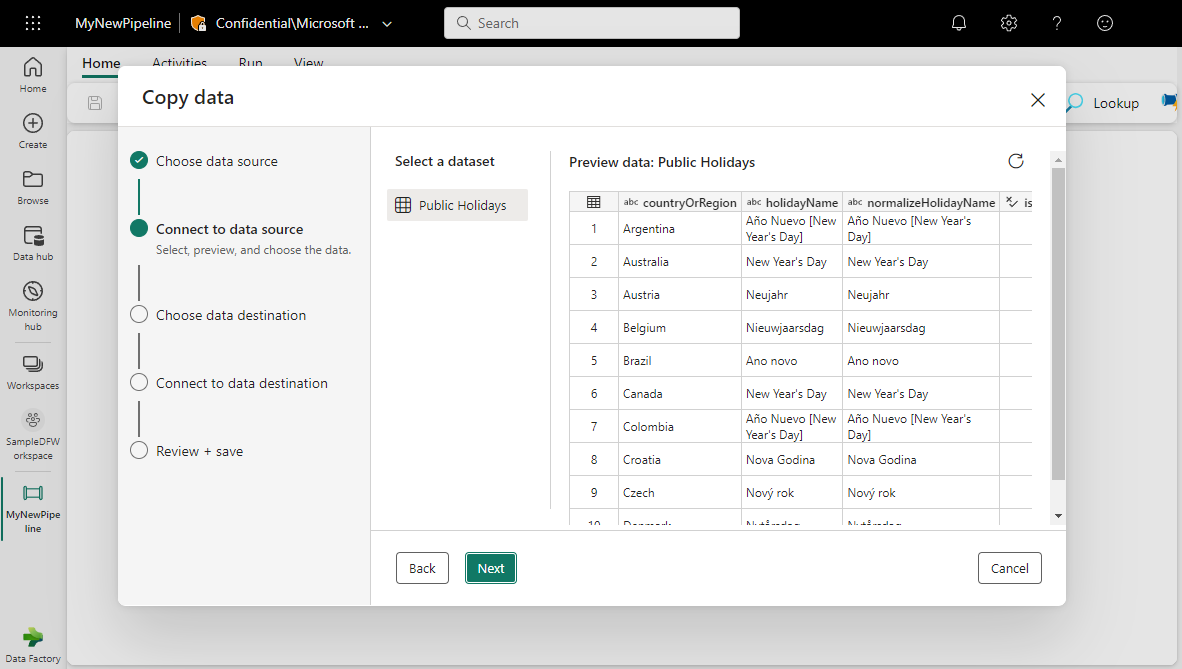
在复制数据助手的“连接到数据源”部分中,将显示示例数据的预览。 选择“下一步”转到数据目标。
步骤 3:配置目标
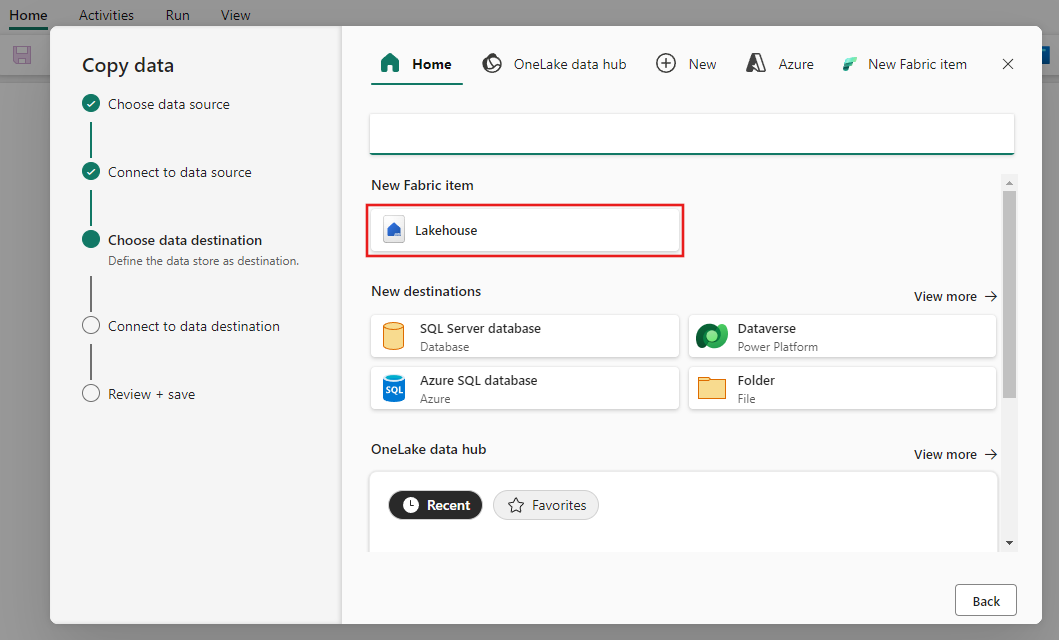
选择“工作区”选项卡,然后选择“湖屋”。 然后,选择“下一步”。
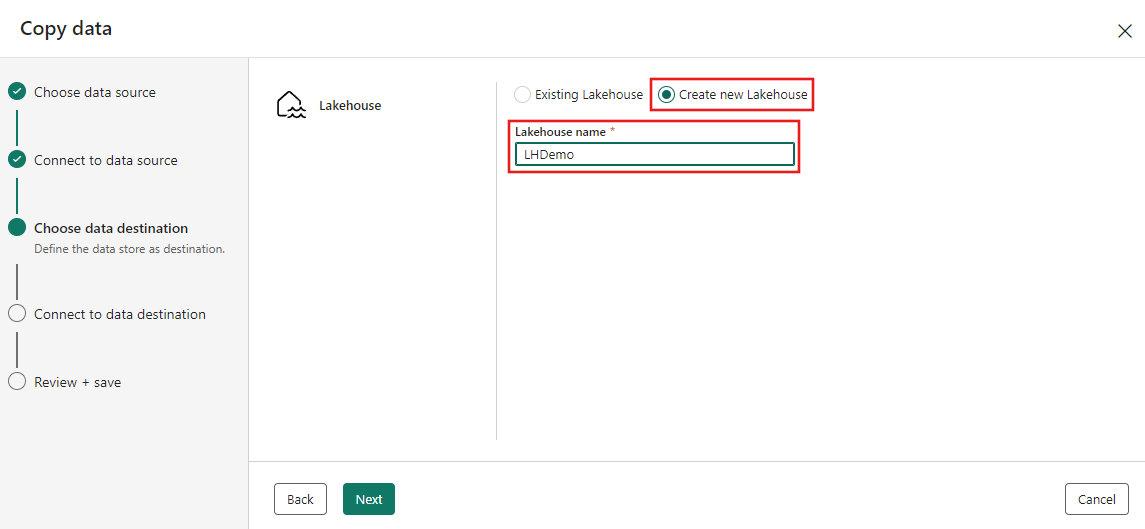
选择“新建湖屋”,输入 LHDemo 作为名称,然后选择“下一步”。
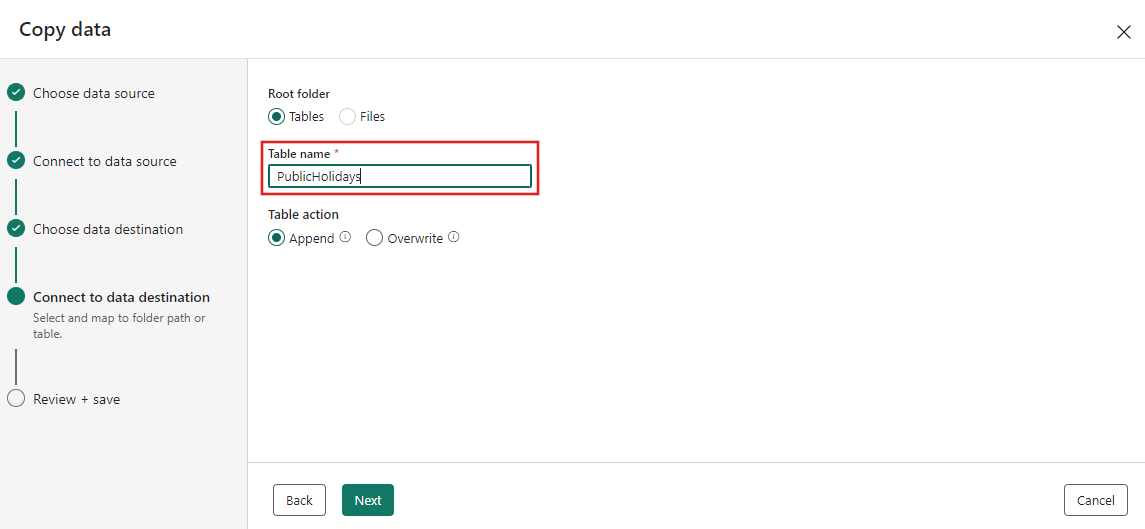
通过输入表名称来配置源数据并将其映射到目标湖屋表,然后再选择“下一步”。
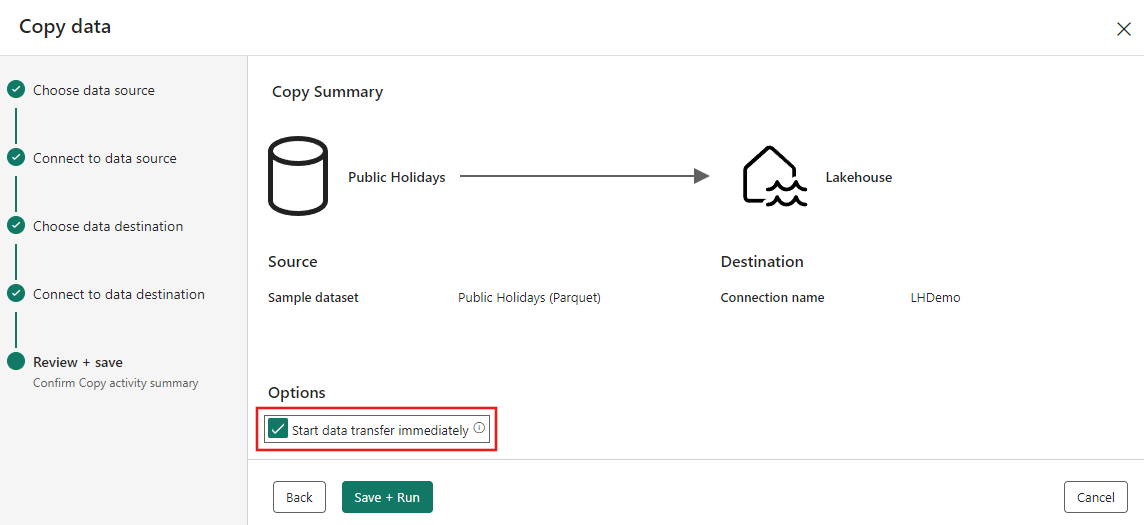
步骤 4:查看和创建复制活动
在前面的步骤中查看复制活动设置,然后选择“立即开始数据传输”。 然后选择“保存 + 运行”以运行新管道。
完成后,复制活动将添加到新的数据管道画布,管道会自动运行以将数据加载到湖屋中。
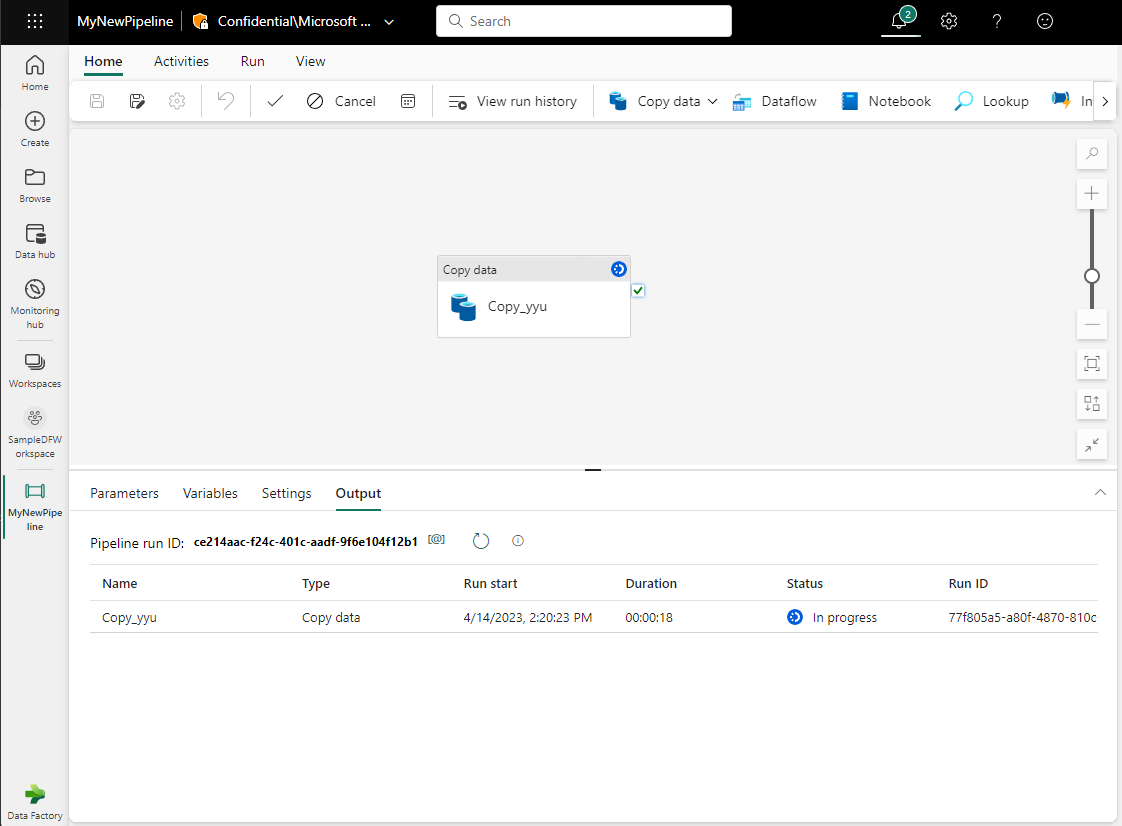
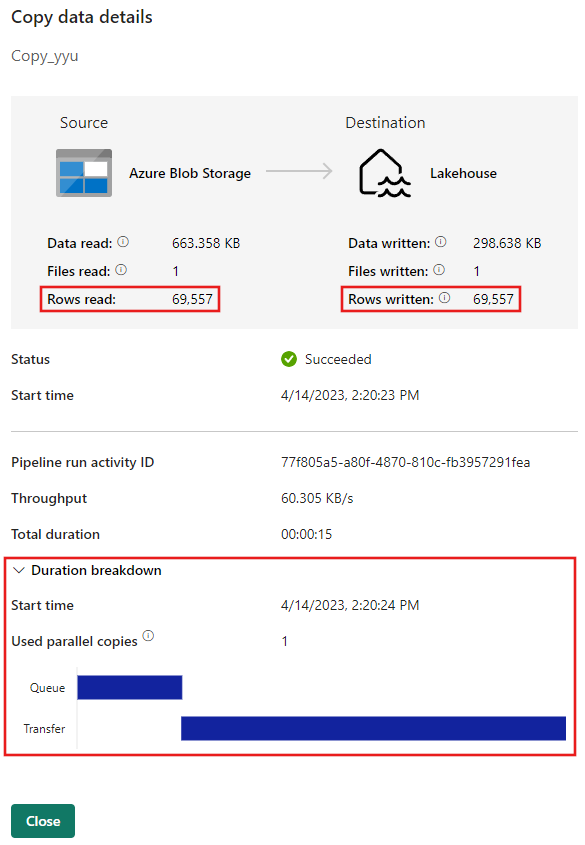
可以监视正在运行的进程,并在管道画布下方的“输出”选项卡上检查结果。 将鼠标悬停在输出行中的名称上,可以看到“运行详细信息”按钮(一副眼镜的图标,突出显示),用于查看运行详细信息。
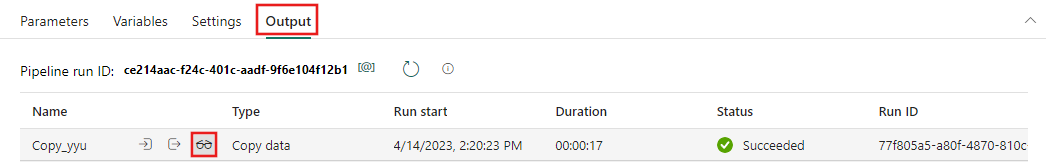
运行详细信息显示读取和写入了 69,557 行,以及有关运行的其他各种详细信息,包括持续时间明细。
使用数据流 gen2 转换湖屋中的数据
现在,你有一个加载了示例数据的湖屋。 接下来,你将使用数据流来转换数据。 数据流是大规模转换数据的一种无代码方式。
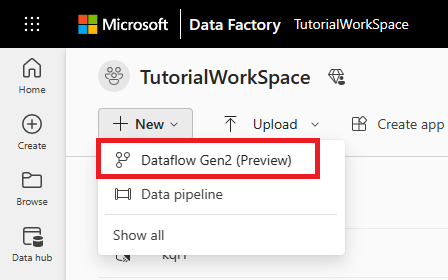
选择“新建”,然后选择“数据流 Gen2”。
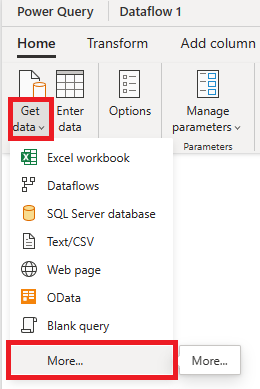
单击“获取数据”下拉列表,然后选择“更多...”。
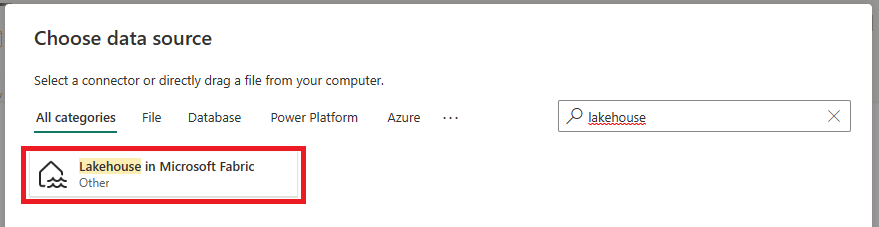
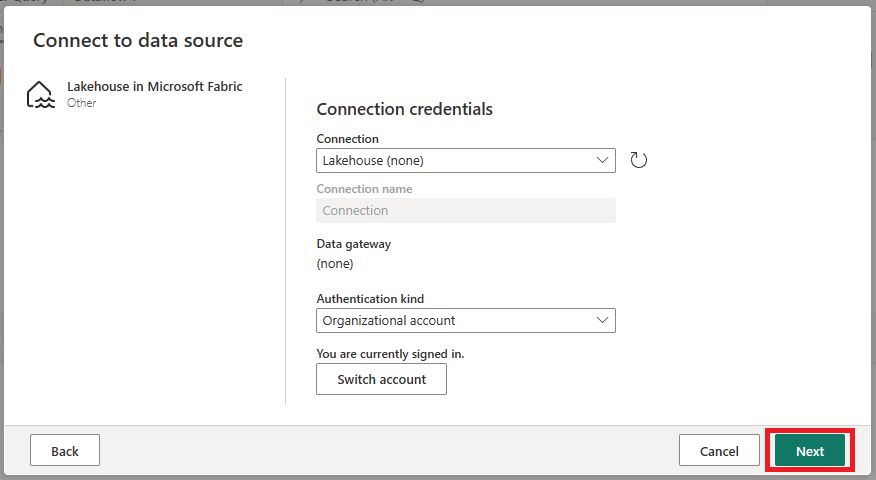
搜索湖屋并选择“Microsoft Fabric 中的湖屋”。
登录并单击“下一步”继续。
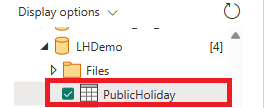
选择在上一步中创建的表,然后单击“创建”。
在编辑器中查看数据预览。

对数据流应用筛选器,以便仅包含 Countryorregion 列等于 Belgium 的行。

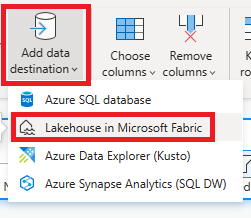
选择“添加数据目标”,然后选择“Microsoft Fabric 中的湖屋”,将数据目标添加到查询中。
登录并单击“下一步”继续。
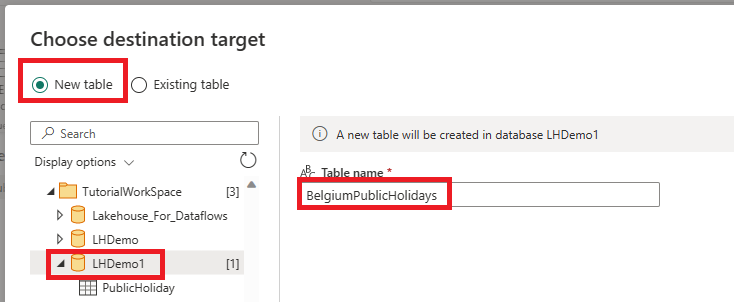
创建名为 BelgiumPublicHolidays 的新表,然后单击“下一步”。
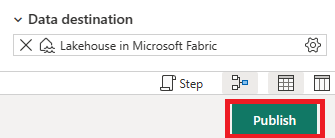
检查设置,然后单击“保存设置”。

单击“发布”发布数据流。
发布数据流后,单击“立即刷新”以运行数据流。


刷新完成后,可以在湖屋表中查看数据。 现在还可以使用此数据来创建报表、仪表板等。
相关内容
此示例演示如何在 Microsoft Fabric 中使用数据工厂将示例数据复制到湖屋并使用数据流转换数据。 你已了解如何执行以下操作:
- 创建数据管道。
- 使用管道将示例数据加载到湖屋。
- 使用数据流转换湖屋中的数据。
接下来,请继续了解有关监视管道运行的详细信息。
反馈
即将发布:在整个 2024 年,我们将逐步淘汰作为内容反馈机制的“GitHub 问题”,并将其取代为新的反馈系统。 有关详细信息,请参阅:https://aka.ms/ContentUserFeedback。
提交和查看相关反馈