使用数据透视表 API 在工作簿中汇总数据、分组字段、筛选和应用计算。
主要概念
- 四个层次结构类别:行、列、数据和筛选器。
- 将层次结构添加到新类别会将其从旧类别中删除。
-
PivotLayout提供输出范围 (例如getDataBodyRange) 。 - 筛选选项:代码 (PivotFilters) 或 UI (切片器) 。
- 添加多个层次结构,然后调用
context.sync()一次以获取速度。
如果作为最终用户不熟悉数据透视表,请查看 创建数据透视表以分析工作表数据。
重要
目前不支持使用 OLAP 创建的数据透视表。 也不支持 Power Pivot。
对象模型
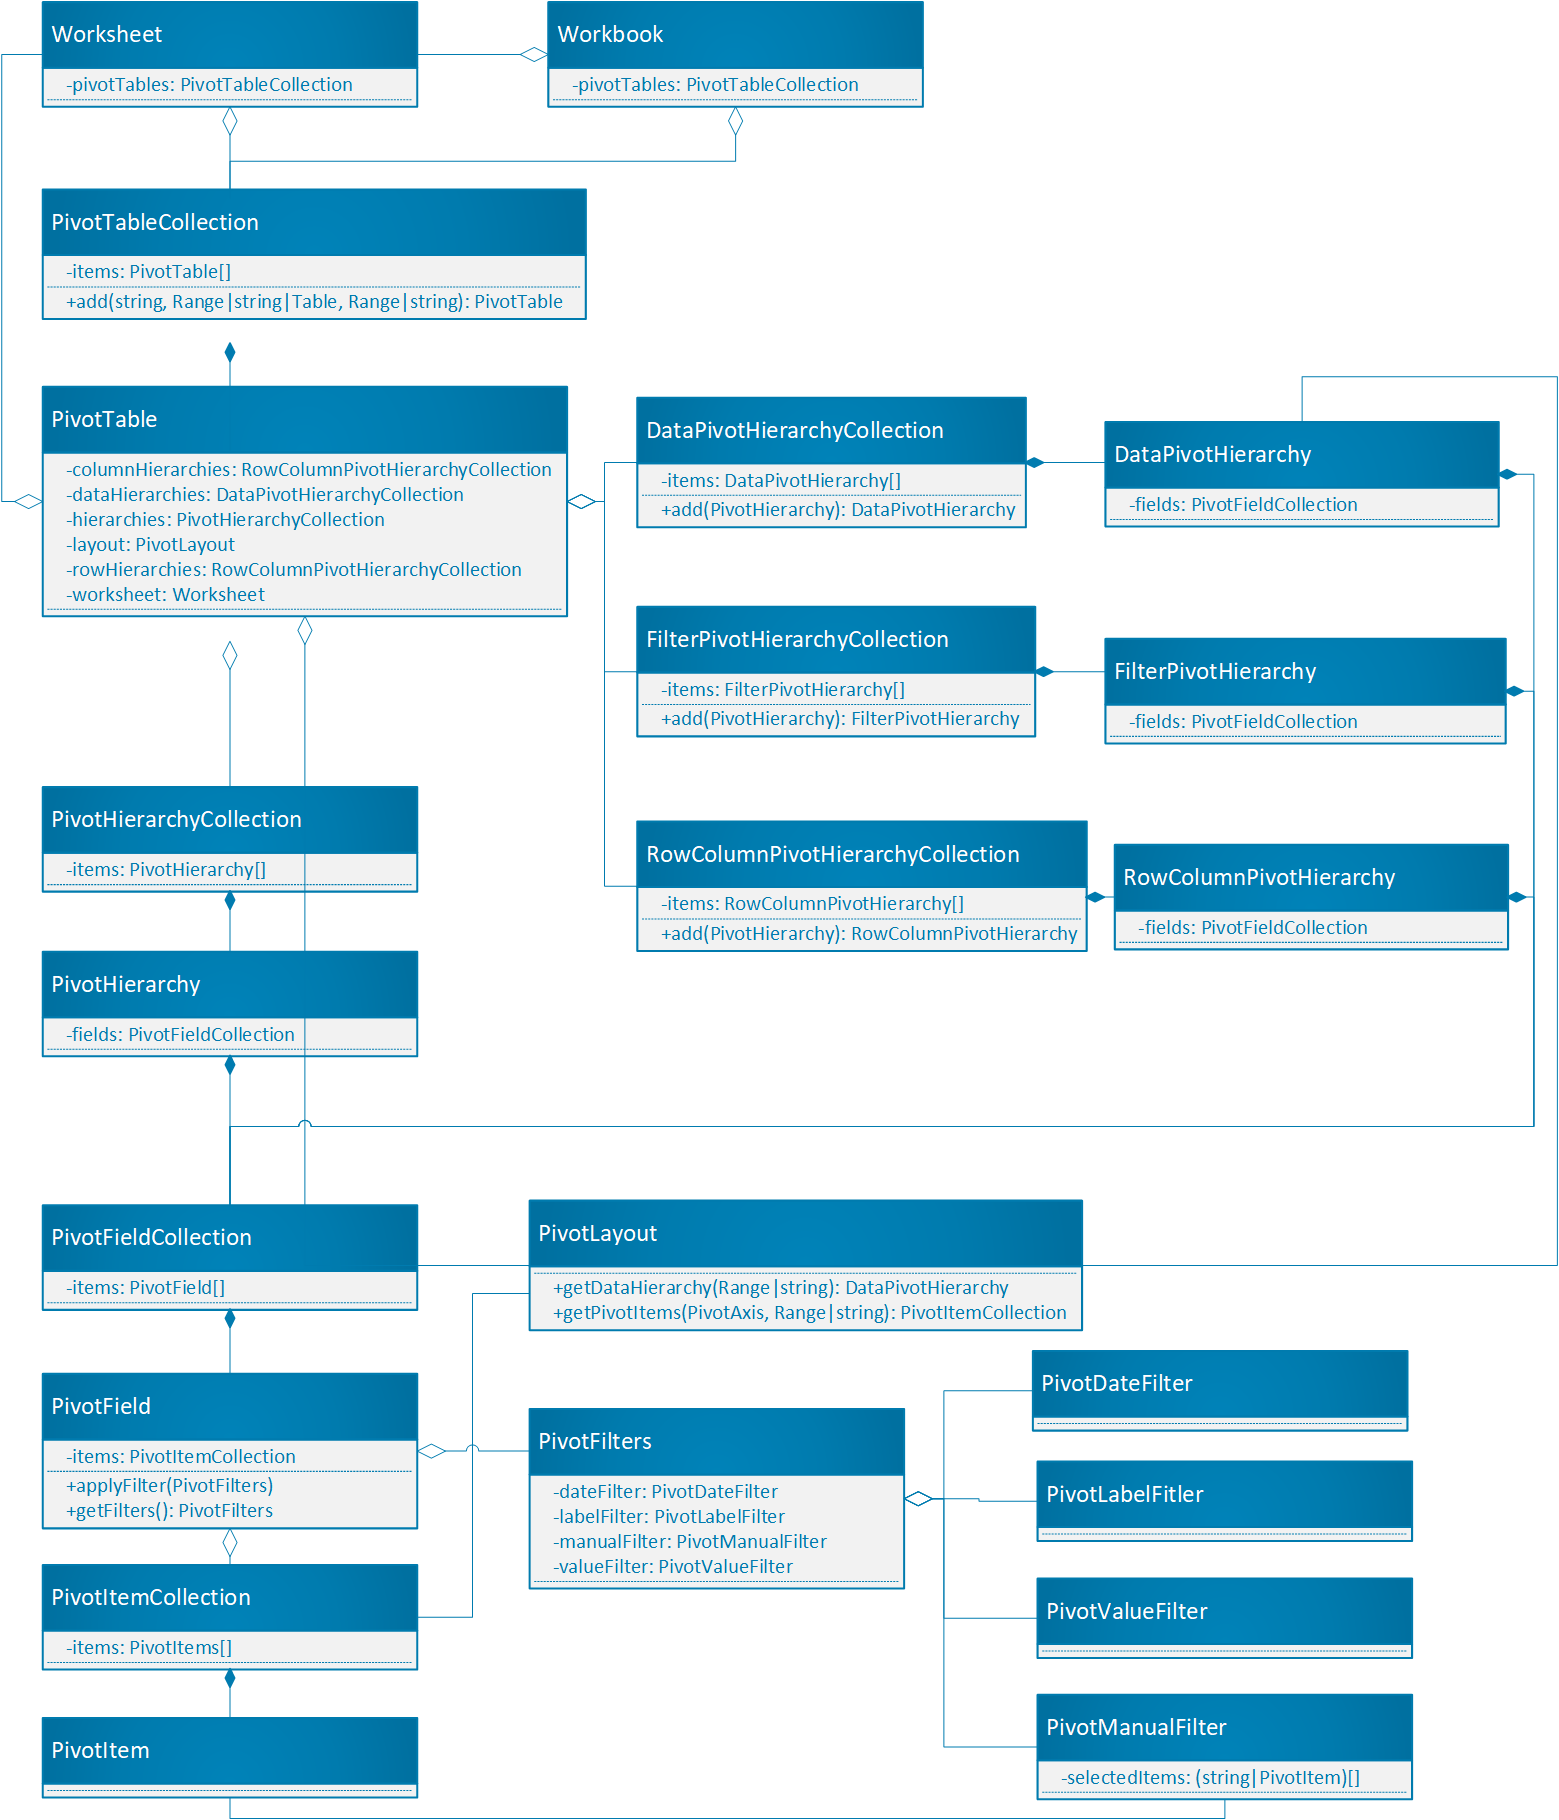
数据透视表是 Office JavaScript API 中数据透视表的中心对象。
-
Workbook.pivotTables和Worksheet.pivotTables是包含工作簿和工作表中数据透视表的数据透视表Collections。 - 数据透视表具有具有多个 PivotHierarchyCollection。
- PivotHierarchies 可以添加到特定的层次结构集合中,以定义数据透视表数据的方式。
- PivotHierarchy 包含只有一个 PivotField 的 PivotFieldCollection。 如果设计扩展为包含 OLAP 数据透视表,则这可能会更改。
- 只要将字段的 PivotHierarchy 分配给层次结构类别,透视字段就可以应用一个或多个 PivotFilters。
- PivotField 包含具有多个 PivotItemCollection 的 PivotItemCollection。
- 数据透视表包含一个 PivotLayout,用于定义透视字段和透视项在工作表中的显示位置。 布局还控制数据透视表的一些显示设置。
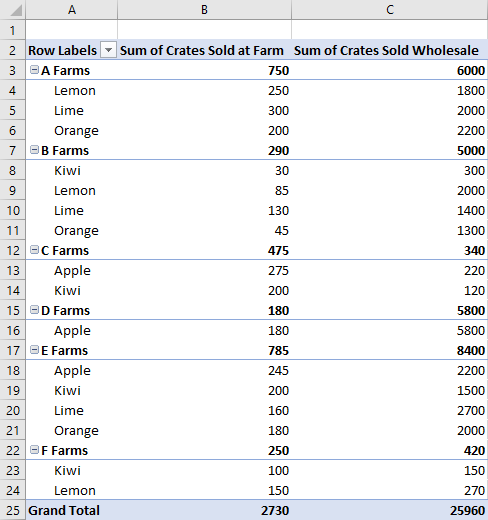
让我们看看这些关系如何应用于一些示例数据。 以下数据描述了不同农场的水果销售情况。 它将是本文中的示例。
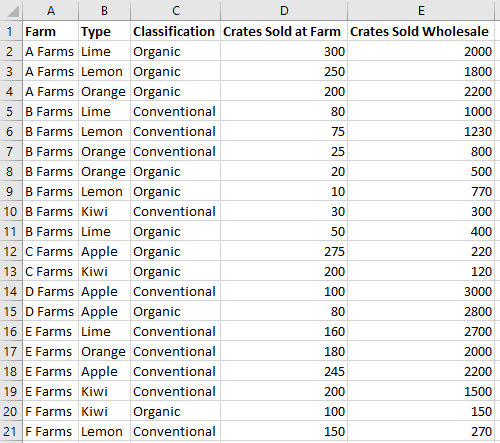
此果园销售数据将用于创建数据透视表。 每个列(如类型)都是 。PivotHierarchy
“类型”层次结构包含“类型”字段。 “ 类型” 字段包含 “Apple”、“ Kiwi”、“ 柠檬”、“ 石灰”和 “橙色”项。
Hierarchies
我们的服务器场数据有五个层次结构: 农场、 类型、 分类、 在农场销售的箱子和 箱销售批发。 每个层次结构只能存在于四个类别之一。 如果将 Type 添加到列层次结构,则它不能也位于行、数据或筛选器层次结构中。 如果随后将 Type 添加到行层次结构,则会将其从列层次结构中删除。 无论是通过 Excel UI 还是 Excel JavaScript API 完成层次结构分配,此行为都是相同的。
行层次结构和列层次结构定义数据的分组方式。 例如, 场 的行层次结构会将同一场中的所有数据集组合在一起。 行层次结构和列层次结构之间的选择定义数据透视表的方向。
数据层次结构是根据行层次结构和列层次结构聚合的值。 数据透视表的行层次结构为 场 ,数据层次结构为 Crates Sold Wholesale ,默认情况下显示每个场的所有不同水果) 的总和 (。
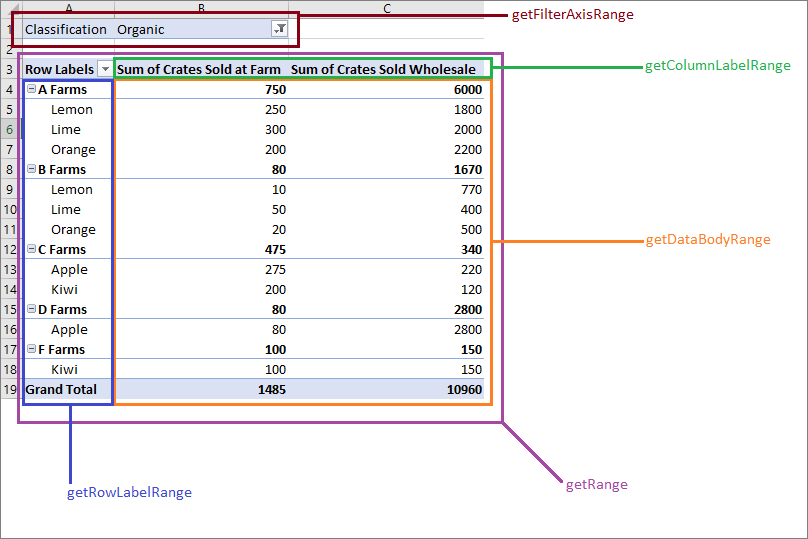
筛选器层次结构基于该筛选类型中的值从透视表包含或排除数据。 选择了“有机”类型的“分类”筛选器层次结构仅显示有机水果的数据。
下面是服务器场数据,以及数据透视表。 数据透视表使用 场 和 类型 作为行层次结构,使用 场销售箱 和 箱销售批发 作为数据层次结构 (默认聚合函数和 总和) ,分类作为筛选器层次结构 (与 有机 选择) 。
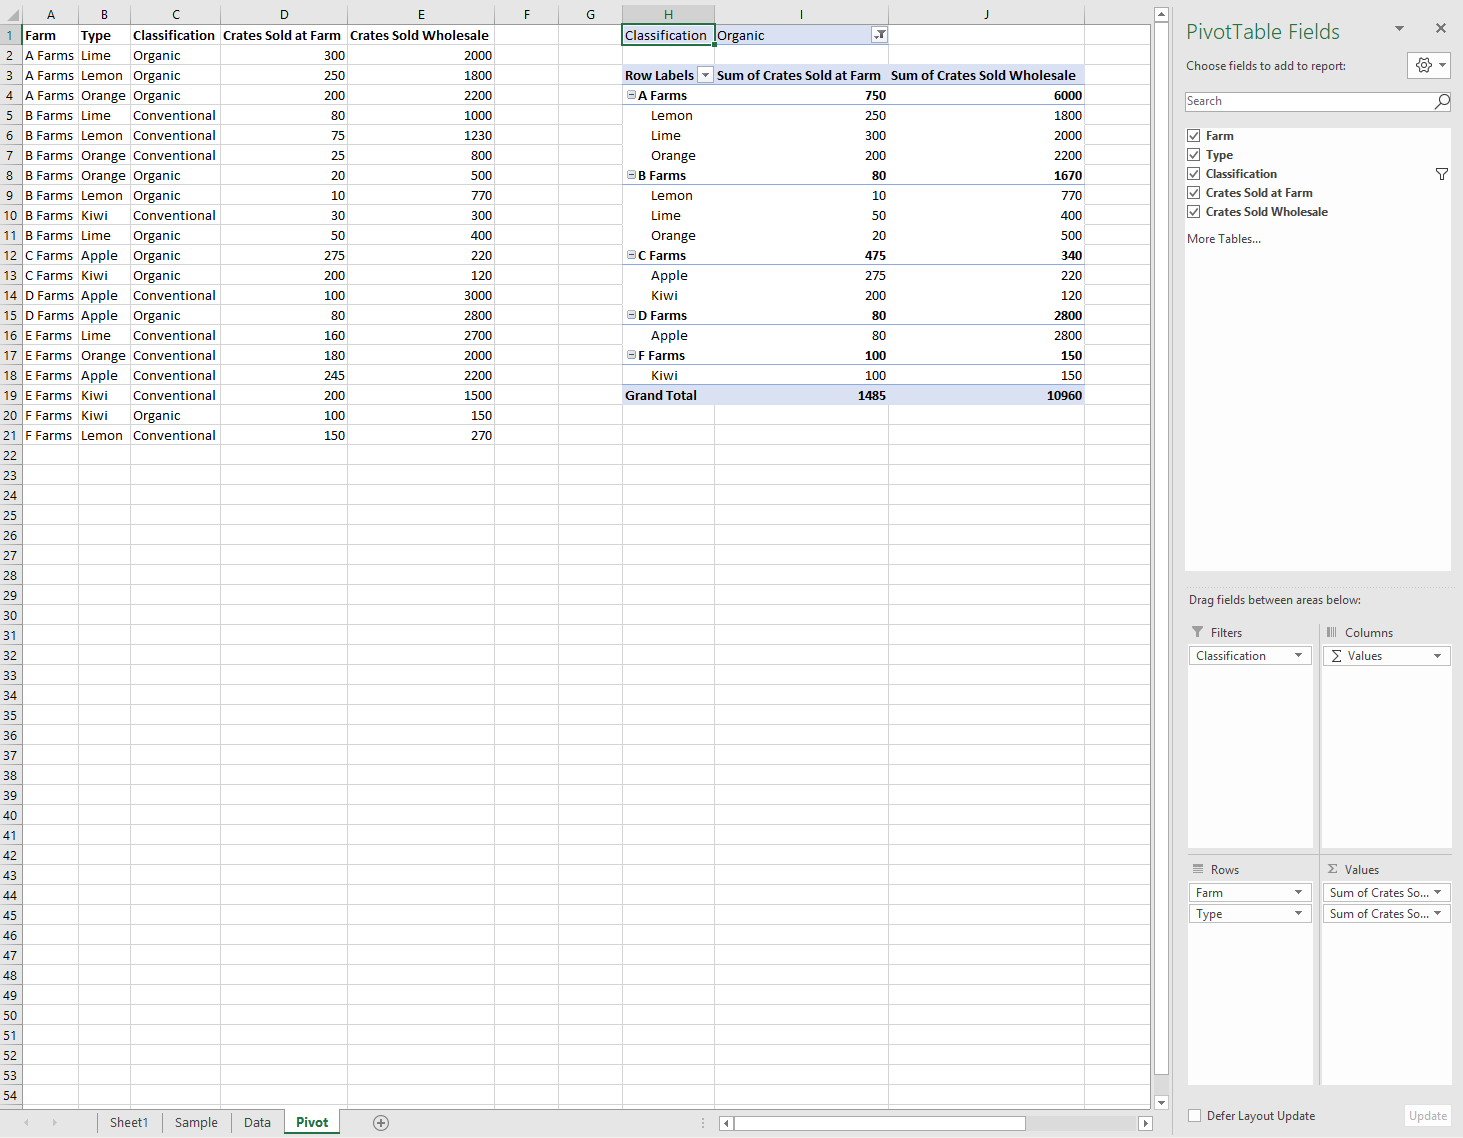
此数据透视表可以通过 JavaScript API 或 Excel UI 生成。 这两个选项都允许通过加载项进一步作。
创建数据透视表
提供名称、源和目标。 源可以是范围地址或表名, (以 Range、 string或 Table 类型) 传递。 目标是一个范围地址, (以 或 string) 的形式Range提供。
以下示例显示了各种数据透视表创建技术。
创建包含范围地址的数据透视表
await Excel.run(async (context) => {
    // Create a PivotTable named "Farm Sales" on the current worksheet at cell
    // A22 with data from the range A1:E21.
    context.workbook.worksheets.getActiveWorksheet().pivotTables.add(
      "Farm Sales", "A1:E21", "A22");

    await context.sync();
});
使用 Range 对象创建数据透视表
await Excel.run(async (context) => {
    // Create a PivotTable named "Farm Sales" on a worksheet called "PivotWorksheet" at cell A2
    // the data comes from the worksheet "DataWorksheet" across the range A1:E21.
    let rangeToAnalyze = context.workbook.worksheets.getItem("DataWorksheet").getRange("A1:E21");
    let rangeToPlacePivot = context.workbook.worksheets.getItem("PivotWorksheet").getRange("A2");
    context.workbook.worksheets.getItem("PivotWorksheet").pivotTables.add(
      "Farm Sales", rangeToAnalyze, rangeToPlacePivot);

    await context.sync();
});
在工作簿级别创建数据透视表
await Excel.run(async (context) => {
    // Create a PivotTable named "Farm Sales" on a worksheet called "PivotWorksheet" at cell A2
    // the data is from the worksheet "DataWorksheet" across the range A1:E21.
    context.workbook.pivotTables.add(
        "Farm Sales", "DataWorksheet!A1:E21", "PivotWorksheet!A2");

    await context.sync();
});
使用现有数据透视表
手动创建的数据透视表也可通过工作簿或单个工作表的数据透视表集合进行访问。 以下代码从工作簿中获取名为 “我的透视表” 的数据透视表。
await Excel.run(async (context) => {
    let pivotTable = context.workbook.pivotTables.getItem("My Pivot");
    await context.sync();
});
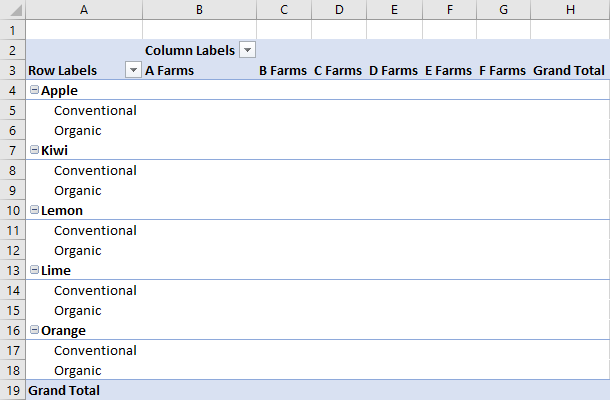
向数据透视表添加行和列
行和列定义数据的分组方式。 添加“ 场 ”列将每个场周围的所有销售额分组。 添加 “类型 ”和 “分类” 行会进一步根据销售的水果以及是否为有机水果来进一步细分数据。
await Excel.run(async (context) => {
    let pivotTable = context.workbook.worksheets.getActiveWorksheet().pivotTables.getItem("Farm Sales");

    pivotTable.rowHierarchies.add(pivotTable.hierarchies.getItem("Type"));
    pivotTable.rowHierarchies.add(pivotTable.hierarchies.getItem("Classification"));

    pivotTable.columnHierarchies.add(pivotTable.hierarchies.getItem("Farm"));

    await context.sync();
});
还可以使用仅包含行或列的数据透视表。
await Excel.run(async (context) => {
    let pivotTable = context.workbook.worksheets.getActiveWorksheet().pivotTables.getItem("Farm Sales");
    pivotTable.rowHierarchies.add(pivotTable.hierarchies.getItem("Farm"));
    pivotTable.rowHierarchies.add(pivotTable.hierarchies.getItem("Type"));
    pivotTable.rowHierarchies.add(pivotTable.hierarchies.getItem("Classification"));

    await context.sync();
});
将数据层次结构添加到数据透视表
数据层次结构使用要基于行和列合并的信息填充数据透视表。 添加“ 在农场销售的箱” 和“ 销售批发 箱”的数据层次结构会为每个行和每列提供这些数字的总和。
在此示例中, Farm 和 Type 都是行,以箱销售额作为数据。
await Excel.run(async (context) => {
    let pivotTable = context.workbook.worksheets.getActiveWorksheet().pivotTables.getItem("Farm Sales");

    // "Farm" and "Type" are the hierarchies on which the aggregation is based.
    pivotTable.rowHierarchies.add(pivotTable.hierarchies.getItem("Farm"));
    pivotTable.rowHierarchies.add(pivotTable.hierarchies.getItem("Type"));

    // "Crates Sold at Farm" and "Crates Sold Wholesale" are the hierarchies
    // that will have their data aggregated (summed in this case).
    pivotTable.dataHierarchies.add(pivotTable.hierarchies.getItem("Crates Sold at Farm"));
    pivotTable.dataHierarchies.add(pivotTable.hierarchies.getItem("Crates Sold Wholesale"));

    await context.sync();
});
数据透视表布局和获取透视数据
PivotLayout 定义层次结构及其数据的位置。 访问布局以确定数据的存储范围。
下图显示了哪些布局函数调用对应于数据透视表的哪些范围。
从数据透视表获取数据
布局定义数据透视表在工作表中的显示方式。 这意味着对象 PivotLayout 控制用于数据透视表元素的区域。 使用布局提供的范围获取数据透视表收集和聚合的数据。 具体而言,使用 PivotLayout.getDataBodyRange 访问数据透视表生成的数据。
以下代码演示了如何通过浏览布局来获取数据透视表的最后一行数据, (前面示例中的“场销售箱总和”和“销售的箱数总和”列) 。 然后,这些值汇总在数据透视表) 外部的 单元格 E30 (中。
await Excel.run(async (context) => {
    let pivotTable = context.workbook.worksheets.getActiveWorksheet().pivotTables.getItem("Farm Sales");

    // Get the totals for each data hierarchy from the layout.
    let range = pivotTable.layout.getDataBodyRange();
    let grandTotalRange = range.getLastRow();
    grandTotalRange.load("address");
    await context.sync();

    // Sum the totals from the PivotTable data hierarchies and place them in a new range, outside of the PivotTable.
    let masterTotalRange = context.workbook.worksheets.getActiveWorksheet().getRange("E30");
    masterTotalRange.formulas = [["=SUM(" + grandTotalRange.address + ")"]];
    await context.sync();
});
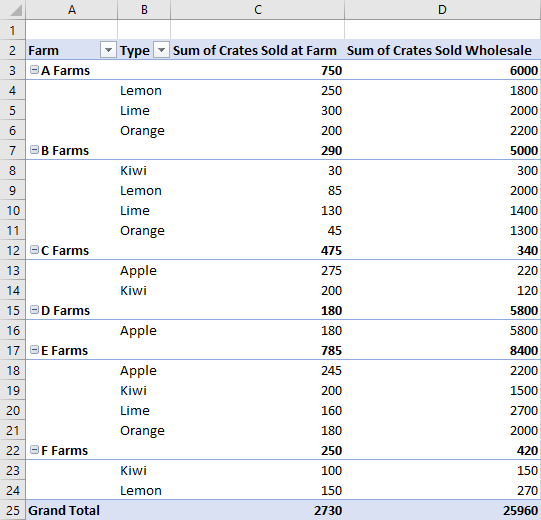
布局类型
数据透视表有三种布局样式:“压缩”、“大纲”和“表格”。 在前面的示例中,我们看到了紧凑样式。
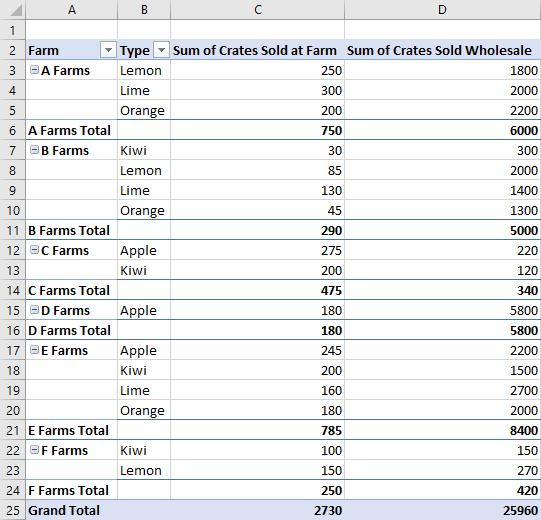
以下示例分别使用大纲样式和表格样式。 代码示例演示如何在不同布局之间循环。
大纲布局
表格布局
PivotLayout 类型切换代码示例
await Excel.run(async (context) => {
    // Change the PivotLayout.type to a new type.
    let pivotTable = context.workbook.worksheets.getActiveWorksheet().pivotTables.getItem("Farm Sales");
    pivotTable.layout.load("layoutType");
    await context.sync();

    // Cycle between the three layout types.
    if (pivotTable.layout.layoutType === "Compact") {
        pivotTable.layout.layoutType = "Outline";
    } else if (pivotTable.layout.layoutType === "Outline") {
        pivotTable.layout.layoutType = "Tabular";
    } else {
        pivotTable.layout.layoutType = "Compact";
    }

    await context.sync();
});
其他 PivotLayout 函数
默认情况下,数据透视表根据需要调整行大小和列大小。 刷新数据透视表时会发生这种情况。
PivotLayout.autoFormat 指定该行为。 当 为 时 autoFormat ,外接程序所做的任何行或列大小更改将 false保留。 此外,数据透视表的默认设置在数据透视表中保留任何自定义格式 (如填充和字体更改) 。 设置为 PivotLayout.preserveFormatting 以 false 在刷新时应用默认格式。
PivotLayout还控制标题和总行设置、空数据单元格的显示方式以及替换文字选项。
PivotLayout 参考提供了这些功能的完整列表。
下面的代码示例使空数据单元格显示字符串 "--",将正文区域的格式设置为一致的水平对齐方式,并确保即使在刷新数据透视表之后,格式更改也保持不变。
await Excel.run(async (context) => {
    let pivotTable = context.workbook.pivotTables.getItem("Farm Sales");
    let pivotLayout = pivotTable.layout;

    // Set a default value for an empty cell in the PivotTable. This doesn't include cells left blank by the layout.
    pivotLayout.emptyCellText = "--";

    // Set the text alignment to match the rest of the PivotTable.
    pivotLayout.getDataBodyRange().format.horizontalAlignment = Excel.HorizontalAlignment.right;

    // Ensure empty cells are filled with a default value.
    pivotLayout.fillEmptyCells = true;

    // Ensure that the format settings persist, even after the PivotTable is refreshed and recalculated.
    pivotLayout.preserveFormatting = true;
    await context.sync();
});
删除数据透视表
使用数据透视表名称删除数据透视表。
await Excel.run(async (context) => {
    context.workbook.worksheets.getItem("Pivot").pivotTables.getItem("Farm Sales").delete();
    await context.sync();
});
筛选数据透视表
筛选数据透视表数据的主要方法是使用 PivotFilters。 切片器提供另一种不太灵活的筛选方法。
数据透视筛选器 根据数据透视表的四个 层次结构类别 筛选数据, (筛选器、列、行和值) 。 透视筛选器有四种类型,允许基于日历日期的筛选、字符串分析、数字比较和基于自定义输入进行筛选。
切片器 可以应用于数据透视表和常规 Excel 表。 应用于数据透视表时,切片器的作用类似于 PivotManualFilter ,并允许基于自定义输入进行筛选。 与 PivotFilters 不同,切片器具有 Excel UI 组件。
Slicer使用 类,可以创建此 UI 组件、管理筛选并控制其视觉外观。
使用 PivotFilters 进行筛选
数据透视筛选器 允许基于四个 层次结构类别 筛选数据透视表数据, (筛选器、列、行和值) 。 在数据透视表对象模型中, PivotFilters 应用于 透视字段,并且每个 PivotField 数据透视表都可以分配 PivotFilters一个或多个 。 若要将 PivotFilters 应用于 PivotField,必须将字段的相应 PivotHierarchy 分配给层次结构类别。
PivotFilter 的类型
| 筛选器类型 | 筛选器用途 | Excel JavaScript API 参考 |
|---|---|---|
| DateFilter | 基于日历日期的筛选。 | PivotDateFilter |
| LabelFilter | 文本比较筛选。 | PivotLabelFilter |
| ManualFilter | 自定义输入筛选。 | PivotManualFilter |
| ValueFilter | 数字比较筛选。 | PivotValueFilter |
创建 PivotFilter
若要使用 Pivot*Filter) 等 PivotDateFilter (筛选数据透视表数据,请将筛选器应用于 数据透视字段。 以下四个代码示例演示如何使用四种类型的 PivotFilter。
PivotDateFilter
第一个代码示例将 PivotDateFilter 应用于 Date Updated PivotField,隐藏 2020-08-01 之前的任何数据。
重要
Pivot*Filter除非将该字段的 PivotHierarchy 分配给层次结构类别,否则无法应用于 PivotField。 在以下代码示例中, dateHierarchy 必须先将 添加到数据透视表的 rowHierarchies 类别中,然后才能将其用于筛选。
await Excel.run(async (context) => {
    // Get the PivotTable and the date hierarchy.
    let pivotTable = context.workbook.worksheets.getActiveWorksheet().pivotTables.getItem("Farm Sales");
    let dateHierarchy = pivotTable.rowHierarchies.getItemOrNullObject("Date Updated");
    await context.sync();

    // PivotFilters can only be applied to PivotHierarchies that are being used for pivoting.
    // If it's not already there, add "Date Updated" to the hierarchies.
    if (dateHierarchy.isNullObject) {
        dateHierarchy = pivotTable.rowHierarchies.add(pivotTable.hierarchies.getItem("Date Updated"));
    }

    // Apply a date filter to filter out anything logged before August.
    let filterField = dateHierarchy.fields.getItem("Date Updated");
    let dateFilter = {
        condition: Excel.DateFilterCondition.afterOrEqualTo,
        comparator: {
        date: "2020-08-01",
        specificity: Excel.FilterDatetimeSpecificity.month
        }
    };
    filterField.applyFilter({ dateFilter: dateFilter });

    await context.sync();
});
注意
以下三个代码片段仅显示特定于筛选器的摘录,而不是完整 Excel.run 调用。
PivotLabelFilter
第二个代码片段演示如何将 PivotLabelFilter 应用于 Type PivotField,并使用 LabelFilterCondition.beginsWith 属性排除以字母 L 开头的标签。
    // Get the "Type" field.
    let filterField = pivotTable.hierarchies.getItem("Type").fields.getItem("Type");

    // Filter out any types that start with "L" ("Lemons" and "Limes" in this case).
    let filter: Excel.PivotLabelFilter = {
      condition: Excel.LabelFilterCondition.beginsWith,
      substring: "L",
      exclusive: true
    };

    // Apply the label filter to the field.
    filterField.applyFilter({ labelFilter: filter });
PivotManualFilter
第三个代码片段将具有 PivotManualFilter 的 手动筛选器应用于 “分类 ”字段,筛选出不包括分类 “有机”的数据。
    // Apply a manual filter to include only a specific PivotItem (the string "Organic").
    let filterField = classHierarchy.fields.getItem("Classification");
    let manualFilter = { selectedItems: ["Organic"] };
    filterField.applyFilter({ manualFilter: manualFilter });
PivotValueFilter
若要比较数字,请将值筛选器与 PivotValueFilter 结合使用,如最终代码片段中所示。 将PivotValueFilter场数据透视字段中的数据与箱销售批发数据透视字段中的数据进行比较,仅包括其销售箱总和超过值 500 的场。
    // Get the "Farm" field.
    let filterField = pivotTable.hierarchies.getItem("Farm").fields.getItem("Farm");

    // Filter to only include rows with more than 500 wholesale crates sold.
    let filter: Excel.PivotValueFilter = {
      condition: Excel.ValueFilterCondition.greaterThan,
      comparator: 500,
      value: "Sum of Crates Sold Wholesale"
    };

    // Apply the value filter to the field.
    filterField.applyFilter({ valueFilter: filter });
删除 PivotFilters
若要删除所有 PivotFilters,请将 clearAllFilters 方法应用于每个 PivotField,如以下代码示例所示。
await Excel.run(async (context) => {
    // Get the PivotTable.
    let pivotTable = context.workbook.worksheets.getActiveWorksheet().pivotTables.getItem("Farm Sales");
    pivotTable.hierarchies.load("name");
    await context.sync();

    // Clear the filters on each PivotField.
    pivotTable.hierarchies.items.forEach(function (hierarchy) {
        hierarchy.fields.getItem(hierarchy.name).clearAllFilters();
    });
    await context.sync();
});
使用切片器进行筛选
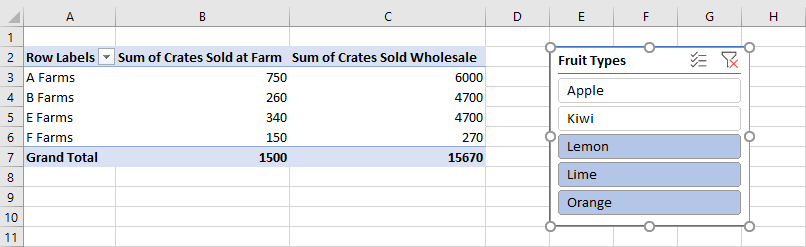
切片器 允许从 Excel 数据透视表筛选数据。 切片器使用指定列或 PivotField 中的值来筛选相应的行。 这些值作为 SlicerItem 对象存储在 中 Slicer。 加载项可以调整这些筛选器,用户也可以 通过 Excel UI) (。 切片器位于绘图层工作表的顶部,如以下屏幕截图所示。
注意
本部分中介绍的技术重点介绍如何使用连接到数据透视表的切片器。 相同的技术也适用于使用连接到表的切片器。
创建切片器
使用 slicers.add 方法在工作簿或工作表中创建切片器。 这会向指定 Workbook 或 Worksheet 对象的 SlicerCollection 添加切片器。 方法 SlicerCollection.add 有三个参数:
-
slicerSource:新切片器所基于的数据源。 它可以是PivotTable、 或 字符串,表示 或 的名称或 IDPivotTableTable。Table -
sourceField:数据源中要按其进行筛选的字段。 它可以是PivotField、 或 字符串,表示 或 的名称或 IDPivotFieldTableColumn。TableColumn -
slicerDestination:将在其中创建新切片器的工作表。 它可以是Worksheet对象,也可以是 的名称或 IDWorksheet。 通过Worksheet.slicers访问 时SlicerCollection,不需要此参数。 在这种情况下,集合的工作表用作目标。
以下代码示例将新的切片器添加到 透视 表。 切片器的源是 场销售 数据透视表,并使用 类型 数据筛选。 切片器也称为 水果切片器 ,供将来参考。
await Excel.run(async (context) => {
    let sheet = context.workbook.worksheets.getItem("Pivot");
    let slicer = sheet.slicers.add(
        "Farm Sales" /* The slicer data source. For PivotTables, this can be the PivotTable object reference or name. */,
        "Type" /* The field in the data to filter by. For PivotTables, this can be a PivotField object reference or ID. */
    );
    slicer.name = "Fruit Slicer";
    await context.sync();
});
使用切片器筛选项
切片器使用 中的 sourceField项筛选数据透视表。 方法 Slicer.selectItems 设置切片器中保留的项。 这些项作为 string[]传递给 方法,表示项的键。 包含这些项目的任何行都保留在数据透视表的聚合中。
selectItems将列表设置为这些调用中指定的键的后续调用。
注意
如果 Slicer.selectItems 传递的项不在数据源中,则会引发错误 InvalidArgument 。 可以通过 属性(SlicerItemCollection)验证Slicer.slicerItems内容。
以下代码示例显示了为切片器选择的三个项: Lemon、 Lime 和 Orange。
await Excel.run(async (context) => {
    let slicer = context.workbook.slicers.getItem("Fruit Slicer");
    // Anything other than the following three values will be filtered out of the PivotTable for display and aggregation.
    slicer.selectItems(["Lemon", "Lime", "Orange"]);
    await context.sync();
});
若要从切片器中删除所有筛选器,请使用 Slicer.clearFilters 方法,如以下示例所示。
await Excel.run(async (context) => {
    let slicer = context.workbook.slicers.getItem("Fruit Slicer");
    slicer.clearFilters();
    await context.sync();
});
设置切片器的样式和格式
使用 Slicer 属性调整切片器的显示设置。 下面的代码示例将样式设置为 SlicerStyleLight6,将切片器顶部的文本设置为 “水果类型”,将切片器放置在绘图层 (395、15) 的位置,并将切片器的大小设置为 135x150 像素。
await Excel.run(async (context) => {
    let slicer = context.workbook.slicers.getItem("Fruit Slicer");
    slicer.caption = "Fruit Types";
    slicer.left = 395;
    slicer.top = 15;
    slicer.height = 135;
    slicer.width = 150;
    slicer.style = "SlicerStyleLight6";
    await context.sync();
});
删除切片器
若要删除切片器,请调用 Slicer.delete 方法。 下面的代码示例从当前工作表中删除第一个切片器。
await Excel.run(async (context) => {
    let sheet = context.workbook.worksheets.getActiveWorksheet();
    sheet.slicers.getItemAt(0).delete();
    await context.sync();
});
更改聚合函数
数据层次结构具有聚合其值。 对于数字数据集,默认为总和。 属性 summarizeBy 基于 AggregationFunction 类型定义此行为。
当前支持的聚合函数类型为 Sum、、Count、 MinProductCountNumbersMaxAverageStandardDeviationPVarianceStandardDeviationVarianceP和 Automatic (默认) 。
以下代码示例将聚合更改为数据的平均值。
await Excel.run(async (context) => {
    let pivotTable = context.workbook.worksheets.getActiveWorksheet().pivotTables.getItem("Farm Sales");
    pivotTable.dataHierarchies.load("no-properties-needed");
    await context.sync();

    // Change the aggregation from the default sum to an average of all the values in the hierarchy.
    pivotTable.dataHierarchies.items[0].summarizeBy = Excel.AggregationFunction.average;
    pivotTable.dataHierarchies.items[1].summarizeBy = Excel.AggregationFunction.average;
    await context.sync();
});
使用 ShowAsRule 更改计算
默认情况下,数据透视表独立聚合其行和列层次结构的数据。 ShowAsRule 根据数据透视表中的其他项将数据层次结构更改为输出值。
对象 ShowAsRule 具有三个属性:
-
calculation:要应用于数据层次结构的相对计算类型, (默认值为none) 。 -
baseField:在应用计算之前包含基础数据的层次结构中的 PivotField 。 由于 Excel 数据透视表具有层次结构到字段的一对一映射,因此您将使用相同的名称来访问层次结构和字段。 -
baseItem:根据计算类型,将各个 PivotItem 与基字段的值进行比较。 并非所有计算都需要此字段。
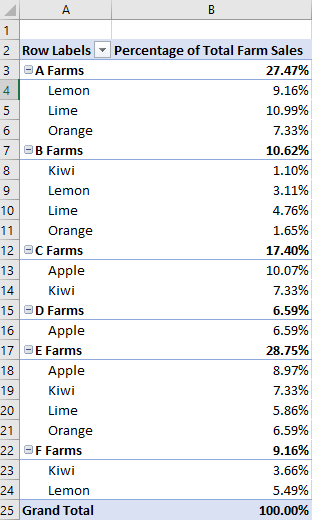
以下示例将场数据层次结构中销售 的箱数之和 的计算设置为列总数的百分比。 我们仍希望粒度扩展到结果类型级别,因此我们将使用 类型 行层次结构及其基础字段。 该示例还使用 Farm 作为第一行层次结构,因此场总条目也显示每个服务器场负责生成的百分比。
await Excel.run(async (context) => {
    let pivotTable = context.workbook.worksheets.getActiveWorksheet().pivotTables.getItem("Farm Sales");
    let farmDataHierarchy = pivotTable.dataHierarchies.getItem("Sum of Crates Sold at Farm");

    farmDataHierarchy.load("showAs");
    await context.sync();

    // Show the crates of each fruit type sold at the farm as a percentage of the column's total.
    let farmShowAs = farmDataHierarchy.showAs;
    farmShowAs.calculation = Excel.ShowAsCalculation.percentOfColumnTotal;
    farmShowAs.baseField = pivotTable.rowHierarchies.getItem("Type").fields.getItem("Type");
    farmDataHierarchy.showAs = farmShowAs;
    farmDataHierarchy.name = "Percentage of Total Farm Sales";
});
前面的示例将计算设置为 列,相对于单个行层次结构的 字段。 当计算与单个项相关时,请使用 baseItem 属性。
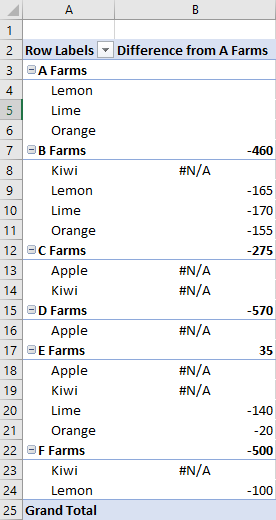
下面的示例演示计算 differenceFrom 。 它显示场箱销售数据层次结构条目与 A 场的销售数据层次结构条目的差异。
baseField是 Farm,因此我们看到其他场之间的差异,以及每种类型的细分,如水果 (类型也是此示例中的行层次结构) 。
await Excel.run(async (context) => {
    let pivotTable = context.workbook.worksheets.getActiveWorksheet().pivotTables.getItem("Farm Sales");
    let farmDataHierarchy = pivotTable.dataHierarchies.getItem("Sum of Crates Sold at Farm");

    farmDataHierarchy.load("showAs");
    await context.sync();

    // Show the difference between crate sales of the "A Farms" and the other farms.
    // This difference is both aggregated and shown for individual fruit types (where applicable).
    let farmShowAs = farmDataHierarchy.showAs;
    farmShowAs.calculation = Excel.ShowAsCalculation.differenceFrom;
    farmShowAs.baseField = pivotTable.rowHierarchies.getItem("Farm").fields.getItem("Farm");
    farmShowAs.baseItem = pivotTable.rowHierarchies.getItem("Farm").fields.getItem("Farm").items.getItem("A Farms");
    farmDataHierarchy.showAs = farmShowAs;
    farmDataHierarchy.name = "Difference from A Farms";
});
更改层次结构名称
层次结构字段是可编辑的。 以下代码演示如何更改两个数据层次结构的显示名称。
await Excel.run(async (context) => {
    let dataHierarchies = context.workbook.worksheets.getActiveWorksheet()
        .pivotTables.getItem("Farm Sales").dataHierarchies;
    dataHierarchies.load("no-properties-needed");
    await context.sync();

    // Changing the displayed names of these entries.
    dataHierarchies.items[0].name = "Farm Sales";
    dataHierarchies.items[1].name = "Wholesale";
});