View and configure a Cumulative Flow Diagram
TFS 2017 | TFS 2015 | TFS 2013
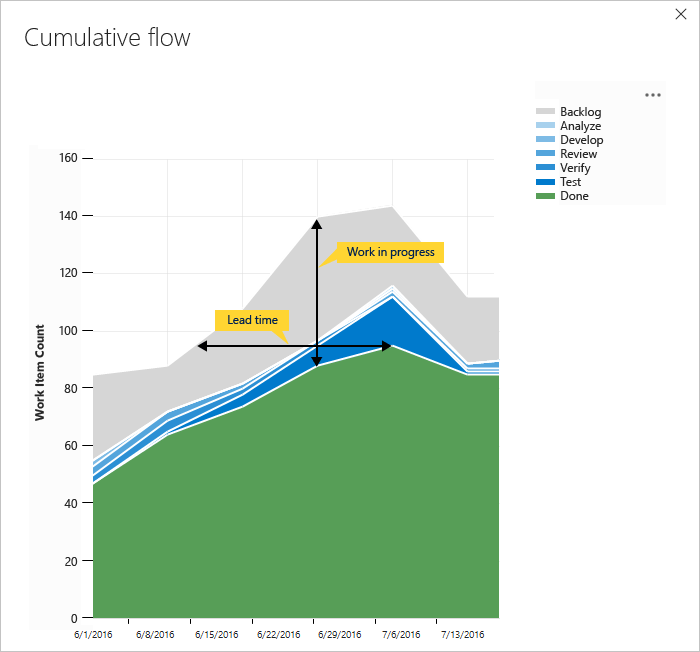
You use cumulative flow diagrams (CFD) to monitor the flow of work through a system. CFDs help teams monitor the count of work items as they progressively move through various workflow states. These diagrams can show the flow of epics, features, user stories, product backlog items, or requirements, depending on the process selected for your project:
Use this article to learn how to:
- View and configure the CFD in-context report (work tracking data store)
The CFD shows the count of items in each Kanban column for the selected time period. From this chart, you can gain an idea of the amount of work in progress and lead time. Work in progress counts unfinished requirements. Lead time indicates the amount of time it takes to complete a requirement once work has started.

For the CFD to provide useful information, you'll want to update the status of work items to reflect progress as it occurs. You can quickly make these updates through your Kanban board.
For usage guidance, see Cumulative flow, lead time, and cycle time guidance.
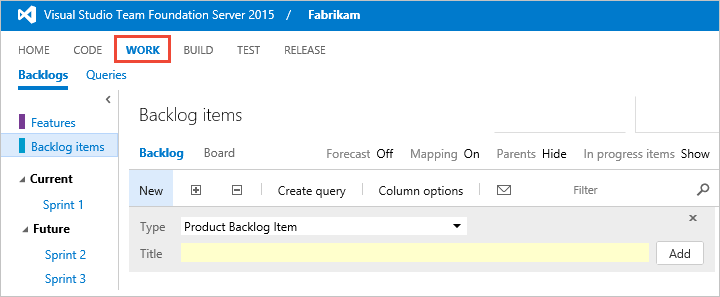
Open your backlog from the web portal
On your web browser, open your team's product backlog. Select Boards > Backlogs.

View the CFD in-context report
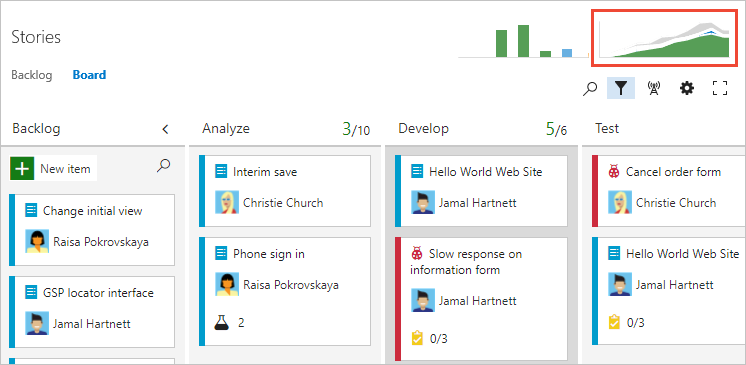
To open the CFD in-context report for your product or portfolio backlog, select the image in the upper-right corner of your Work>Backlogs page.

Configure the CFD in-context report
Each team can set their preferences for the in-context cumulative flow charts.
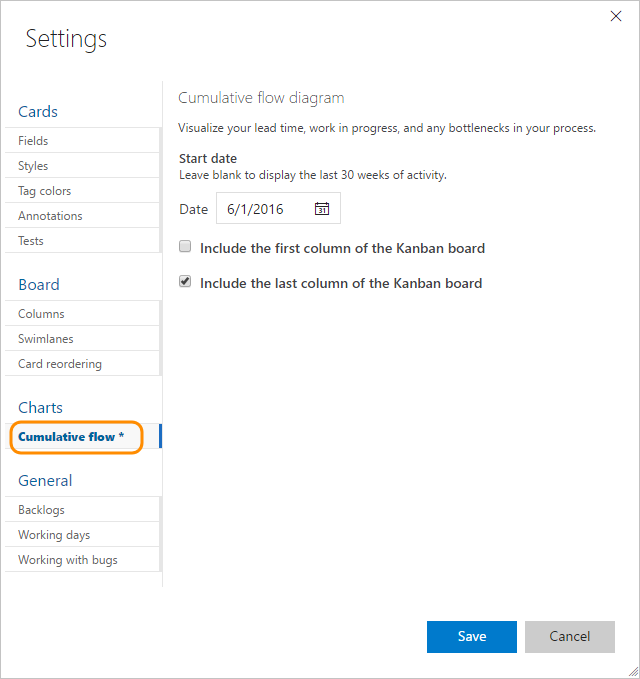
Open the backlog level for which you want to configure and then open the common configuration dialog. Select the
 gear icon.
If you're not a team admin, get added as one. Only team and project admins can customize the team Kanban boards and CFD charts.
Select Cumulative flow and specify the team's preferences.
