About dashboards, charts, reports, & widgets
TFS 2017 | TFS 2015
Gain visibility into your team's progress by adding one or more widgets or charts to your dashboard. Customizable, highly configurable dashboards provide you and your teams with the flexibility to share information, monitor progress and trends, and improve your workflow processes. Each team can tailor their dashboards to share information and monitor their progress.
If you're just starting out, read Add, rename, and delete dashboards. Looking for instructions on a specific task, in context chart, widget, or report? See Dashboards and widgets quick reference. To learn about our reporting solutions, read Reporting Roadmap.
Important
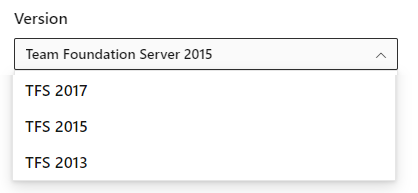
To view the content available for your platform, make sure that you select the correct version of this article from the version selector which is located above the table of contents. Feature support differs depending on the on-premises version of TFS you are using. .
To learn which on-premises version you are using, see What platform/version am I using?
Supported capabilities, permissions, and access
Access to Azure DevOps web portal features are managed through access levels assigned to users.
Web portal data views and reports
The following features provide support for viewing Azure DevOps data through the web portal:
- Dashboards are customizable interactive signboards that provide real-time information. Dashboards are associated with a team or a project and display configurable charts and widgets.
- Charts are query-based status or trend charts derived from a work item query or test results.
- Widgets display configurable information and charts on dashboards. The widget catalog provides brief descriptions of those widgets available to you. Also, you can add widgets provided through the Azure DevOps Marketplace.
- In-context reports are system-generated charts that support specific services. Examples are team velocity, sprint burndown, and the Cumulative Flow Diagram (CFD), and the Test Failures Report. These reports are displayed on the Analytics tab for a specific service and derive data from Analytics.
SQL Server reports
SQL Server Reporting is the legacy reporting solution available with Azure DevOps Server 2020 and earlier versions. The following features provide support for viewing Azure DevOps data using SQL Server Reports and SQL Server Analysis Services.
- Excel status and trend reports supports generating custom work tracking reports using Excel starting with a flat-list query. To learn more, see Create status and trend reports from a work item query.
- SQL Server reports: Allow users access to out-of-the-box SQL Server reports and support to create customized SQL Reports or Excel reports. Doing so requires that the project is configured to support SQL Server reporting.
Supported features and access level
Users granted Stakeholder access have limited access to select features as indicated in the following table. To learn more, see About access levels. In addition to access levels, select features require permissions to execute.
Note
Data displayed within a chart or widget is subject to permissions granted to the signed in user. To learn more, see FAQs on Azure DevOps dashboards, charts, and reports, Access and permissions.
Supported features and tasks
Stakeholder
Basic
Dashboards (View)
✔️
✔️
Dashboards (Create and edit)
✔️
Charts, Widgets (View)
✔️
✔️
Charts, Widgets (Add and configure)
✔️
In-context reports
✔️
✔️
SQL Server reports
✔️
✔️
Default permissions
Dashboards
You set dashboard permissions at the team level for team dashboards.
Task
Readers
Contributors
Team admins
Project admins
View team dashboards
✔️
✔️
✔️
Add and configure team dashboards
✔️
✔️
✔️
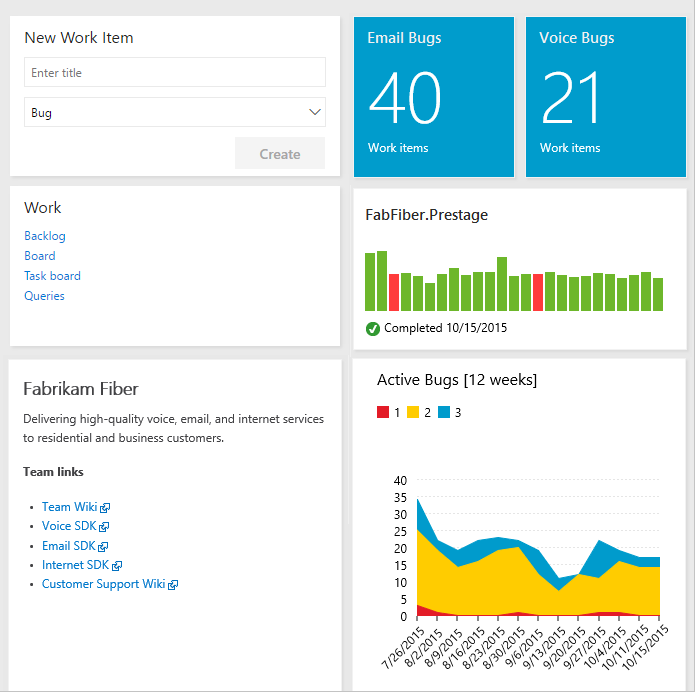
Configurable dashboards
With dashboards, you can configure an array of charts and widgets.
Each team can add and configure multiple dashboards to:
- Share information.
- View status, progress, and trends
- Access quick links and other functions.
Easily add and rearrange widgets on the dashboard to show recent changes made to view build status, bug trends, and more.
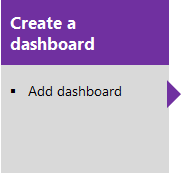
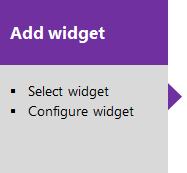
Sequence for adding and customizing a dashboard
Select a box below to open the corresponding article.
Charts: Work tracking status and trends
With flat-list queries, you can create various charts to monitor status, progress, and trends. Before you monitor work progress and trends, you'll need to have planned your project and made progress on work you're tracking.
You can open a shared query, create a chart, and add it to the dashboard. Once it's been added to the dashboard, you can change the Chart for work items widget configuration to resize or change the chart parameters. Or, from the dashboard, you can add a Chart for work items widget and choose a shared query and set the chart parameters. Chart types include status—pie, bar, column, stacked bar, and pivot—and trend—stacked area, line, and area—charts.
For details, see:
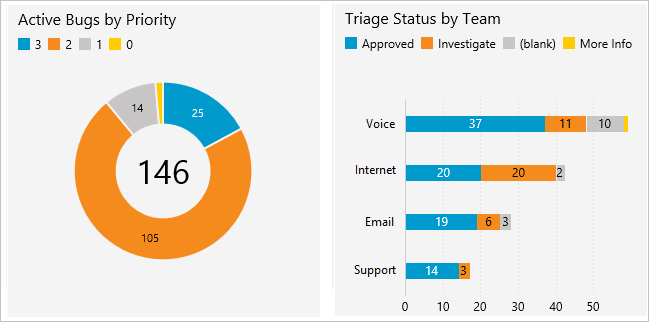
Sample Agile tool light-weight charts
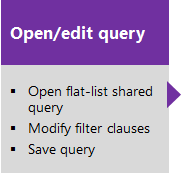
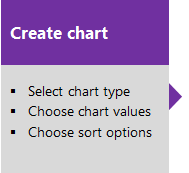
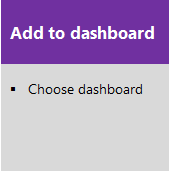
Sequence for adding query-based charts to a dashboard
Select a box below to open the corresponding article.
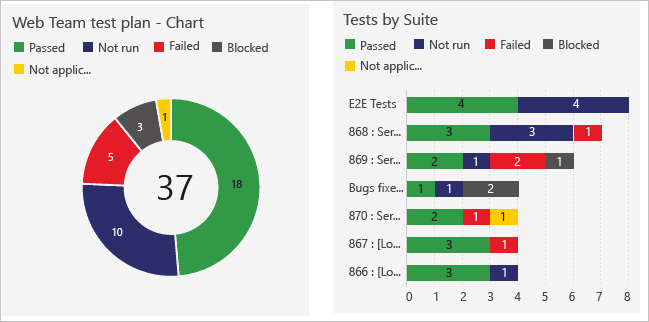
Charts: Manual testing progress, results, and trends
The steps to creating charts that track manual testing progress and results are similar to the ones for tracking work. The starting point, however, begins with the test plan rather than a query. For example, you can find out how many test cases are ready to run, or how many tests are passing and failing in each test suite. And, just like work item query-based charts, you can add these charts to a dashboard.
For details, see:
Sample light-weight test charts
Widgets
You add widgets to a dashboard to display a chart, information, or set of links. Most widgets are configurable. For a description of each supported widget for your platform and version, see the Widget catalog. Here are the widgets that support the indicated service.
Widgets are annotated as follows:
- Build: Widget derives data for a selected build pipeline
- Release: Widget derives data for a selected release pipeline
- Team: Widget is scoped to a single team
- User: Widget is scoped to the logged in user account
Work
- Assigned to me (User)
- Chart for work items
- New Work item
- Query results
- Query tile
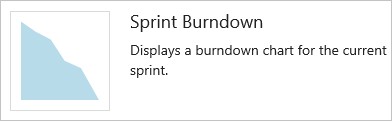
- Sprint burndown
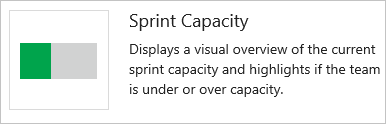
- Sprint capacity
- Sprint overview
- Work links
Repos
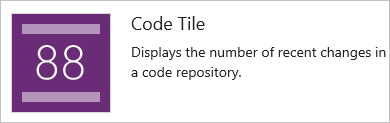
- Code tile (Repository, Branch, Folder)
- Pull request (Team, User)
Build & Release
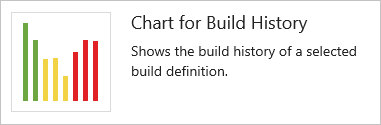
- Build history (Build pipeline)
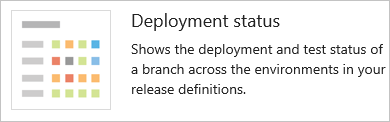
- Deployment status (Build pipeline)
- Requirements quality (Query, Build or Release pipeline)
Test
- Chart for test plans
- Test results trend (Build or Release pipeline)
Information and links
Work
- Chart for work items
- New Work item
- Query results
- Query tile
- Sprint burndown
- Sprint capacity
- Sprint overview
- Work links
Code
Build
Information and links
Sprint chart widgets
Monitor code activity, build progress and deployment status
With the code tile widgets, you can monitor the activity occurring within a repository or branch folder. Build history displays a histogram of all builds run for a specific build pipeline. Bar color indicates: green-completed, red-failed, and yellow-completed without tests.
Code, build, and release chart widgets
In-context reports: Work tracking
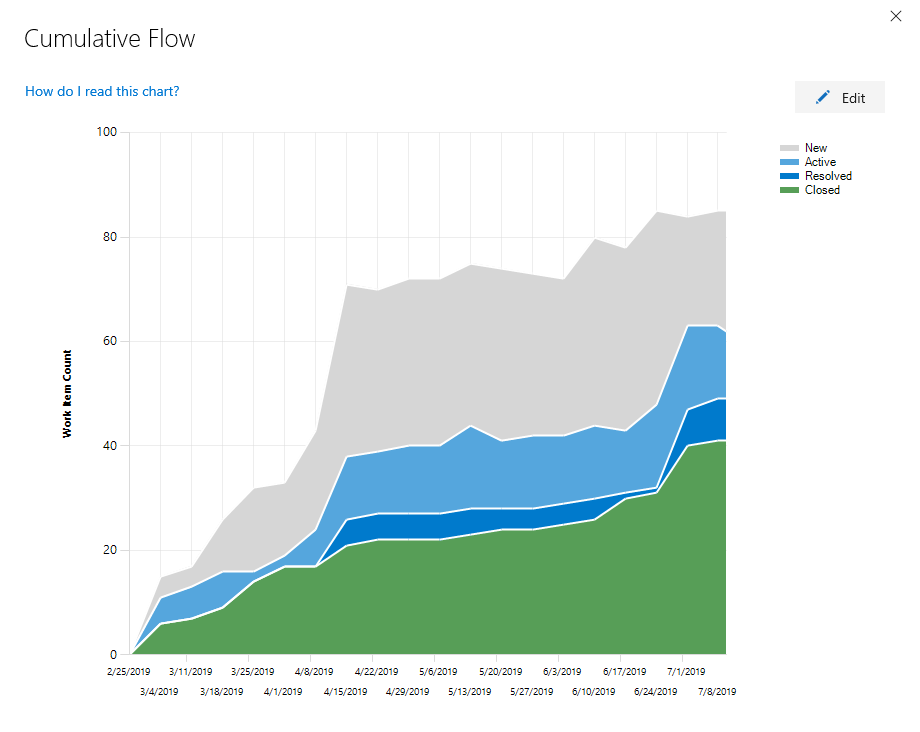
Azure Boards provides several in-context reports that derive from the work tracking data store. From your backlog or board, you can view the Cumulative Flow Diagram and team Velocity reports by choosing the miniature charts that appear on each page. From a Sprint backlog, you can view the sprint burndown.
Cumulative Flow Diagram
The CFD report shows the count of work items in the backlog based on their state over time.
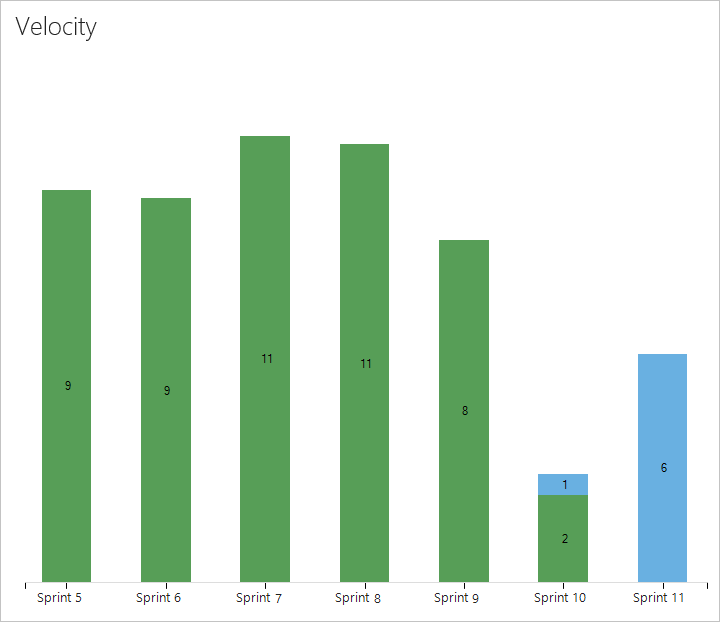
Velocity
Velocity is based on the values entered for Effort, Story Points, or Size fields for work items that belong to the Requirement Category.
Sprint burndown
Each sprint provides access to two charts. The first tracks capacity for the team, team activities—such as Development, Test, Design—and individual team members. The second tracks the sprint burndown for remaining work.
| Capacity bars | Burndown |
|---|---|
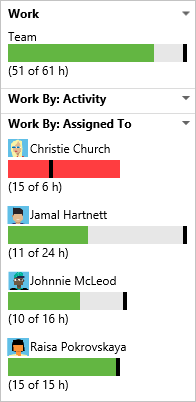 |
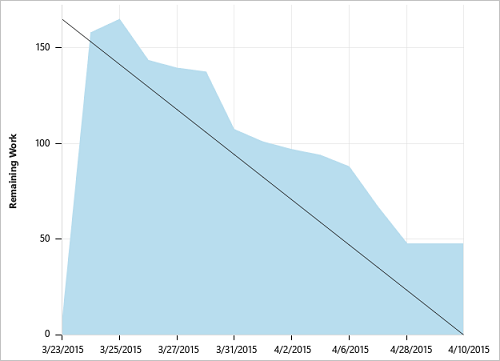 |
Note
You can't add the in-context reports to a dashboard. However, you may find a comparable widget listed in the widget catalog that tracks the same or similar data which you can add to the dashboard.
To learn more about these reports, see one of the following articles:
Add custom work tracking fields
You can add data to support reporting requirements by adding a custom field.
Marketplace widgets and extensibility
In addition to the widgets available in the widget catalog, you may find interesting widgets in the Marketplace.
Or, you can create your own widget using the REST API.