自定义远程监视解决方案加速器
本文提供有关如何访问远程监视解决方案加速器 UI 的源代码以及对其进行自定义的信息。
Azure Cloud Shell
Azure 托管 Azure Cloud Shell(一个可通过浏览器使用的交互式 shell 环境)。 可以将 Bash 或 PowerShell 与 Cloud Shell 配合使用来使用 Azure 服务。 可以使用 Cloud Shell 预安装的命令来运行本文中的代码,而不必在本地环境中安装任何内容。
若要启动 Azure Cloud Shell,请执行以下操作:
| 选项 | 示例/链接 |
|---|---|
| 选择代码或命令块右上角的“试用”。 选择“试用”不会自动将代码或命令复制到 Cloud Shell。 |  |
| 转到 https://shell.azure.com 或选择“启动 Cloud Shell”按钮可在浏览器中打开 Cloud Shell。 |  |
| 选择 Azure 门户右上角菜单栏上的 Cloud Shell 按钮。 |  |
若要使用 Azure Cloud Shell,请执行以下操作:
启动 Cloud Shell。
选择代码块(或命令块)上的“复制”按钮以复制代码或命令。
在 Windows 和 Linux 上选择 Ctrl+Shift+V,或在 macOS 上选择 Cmd+Shift+V 将代码或命令粘贴到 Cloud Shell 会话中。
选择“Enter”运行代码或命令。
准备 UI 的本地开发环境
远程监视解决方案加速器 UI 代码是使用 React.js 框架实现的。 可以在 azure-iot-pcs-remote-monitoring-webui GitHub 存储库中找到源代码。
要对 UI 进行更改,可在本地运行其副本。 若要完成操作(例如检索遥测数据),本地副本将连接到部署的解决方案实例。
以下步骤概述了为 UI 开发设置本地环境的过程:
使用 pcs CLI 部署解决方案加速器的基本实例。 记下部署名称以及为虚拟机提供的凭据。 有关详细信息,请参阅使用 CLI 部署。
若要启用对托管解决方案中的微服务的虚拟机的 SSH 访问,请使用 Azure 门户或 Azure Cloud Shell。 例如:
az network nsg rule update --name SSH --nsg-name {your solution name}-nsg --resource-group {your solution name} --access Allow仅在测试和开发期间启用 SSH 访问。 如果启用了 SSH,应在用完后尽快将它禁用。
使用 Azure 门户或 Azure Cloud Shell 查找虚拟机的名称和公共 IP 地址。 例如:
az resource list --resource-group {your solution name} -o table
az vm list-ip-addresses --name {your vm name from previous command} --resource-group {your solution name} -o table
使用 SSH 连接到虚拟机。 使用前一步骤中的 IP 地址以及运行 pcs 部署解决方案时提供的凭据。
ssh命令可在 Azure Cloud Shell 中使用。若要允许本地 UX 建立连接,请在虚拟机上的 bash shell 中运行以下命令:
cd /app
sudo ./start.sh --unsafe
看到命令完成并且网站启动后,可从虚拟机断开连接。
在 azure-iot-pcs-remote-monitoring-webui 存储库的本地副本中,编辑 .env 文件以添加部署的解决方案的 URL:
NODE_PATH = src/
REACT_APP_BASE_SERVICE_URL=https://{your solution name}.azurewebsites.net/
在命令提示符下,导航到
azure-iot-pcs-remote-monitoring-webui文件夹的本地副本。若要安装所需的库以及在本地运行 UI,请运行以下命令:
npm install
npm start
上一个命令在本地运行 UI http://localhost:3000/dashboard. 可以在站点正在运行时编辑代码,并查看其动态更新。
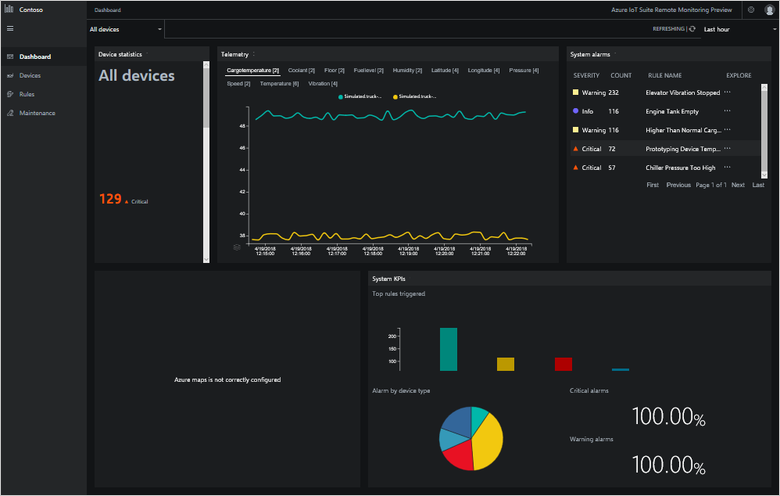
自定义布局
远程监视解决方案中的每个页面包括一组控件,在源代码中称为“面板”。 “ 仪表板 ”页由五个面板组成:概述、映射、警报、遥测和分析。 可以在 pcs-remote-monitoring-webui GitHub 存储库中找到定义每个页面及其面板的源代码。 例如,在 src/components/pages/dashboard 文件夹中可以找到定义“仪表板”页面、其布局及其面板的代码。
由于面板管理自身的布局和大小,因此你可以轻松修改页面的布局。 对 src/components/pages/dashboard/dashboard.js 文件中的 PageContent 元素进行以下更改将会:
- 交换地图和遥测面板的位置。
- 更改地图和分析面板的相对宽度。
<PageContent className="dashboard-container">
  <Grid>
    <Cell className="col-1 devices-overview-cell">
      <OverviewPanel
        activeDeviceGroup={activeDeviceGroup}
        openWarningCount={openWarningCount}
        openCriticalCount={openCriticalCount}
        onlineDeviceCount={onlineDeviceCount}
        offlineDeviceCount={offlineDeviceCount}
        isPending={analyticsIsPending || devicesIsPending}
        error={deviceGroupError || devicesError || analyticsError}
        t={t} />
    </Cell>
    <Cell className="col-6">
      <TelemetryPanel
        timeSeriesExplorerUrl={timeSeriesParamUrl}
        telemetry={telemetry}
        isPending={telemetryIsPending}
        lastRefreshed={lastRefreshed}
        error={deviceGroupError || telemetryError}
        theme={theme}
        colors={chartColorObjects}
        t={t} />
    </Cell>
    <Cell className="col-3">
      <AlertsPanel
        alerts={currentActiveAlertsWithName}
        isPending={analyticsIsPending || rulesIsPending}
        error={rulesError || analyticsError}
        t={t}
        deviceGroups={deviceGroups} />
    </Cell>
    <Cell className="col-4">
      <PanelErrorBoundary msg={t('dashboard.panels.map.runtimeError')}>
        <MapPanel
          analyticsVersion={analyticsVersion}
          azureMapsKey={azureMapsKey}
          devices={devices}
          devicesInAlert={devicesInAlert}
          mapKeyIsPending={azureMapsKeyIsPending}
          isPending={devicesIsPending || analyticsIsPending}
          error={azureMapsKeyError || devicesError || analyticsError}
          t={t} />
      </PanelErrorBoundary>
    </Cell>
    <Cell className="col-6">
      <AnalyticsPanel
        timeSeriesExplorerUrl={timeSeriesParamUrl}
        topAlerts={topAlertsWithName}
        alertsPerDeviceId={alertsPerDeviceType}
        criticalAlertsChange={criticalAlertsChange}
        isPending={analyticsIsPending || rulesIsPending || devicesIsPending}
        error={devicesError || rulesError || analyticsError}
        theme={theme}
        colors={chartColorObjects}
        t={t} />
    </Cell>
    {
      Config.showWalkthroughExamples &&
      <Cell className="col-4">
        <ExamplePanel t={t} />
      </Cell>
    }
  </Grid>
</PageContent>
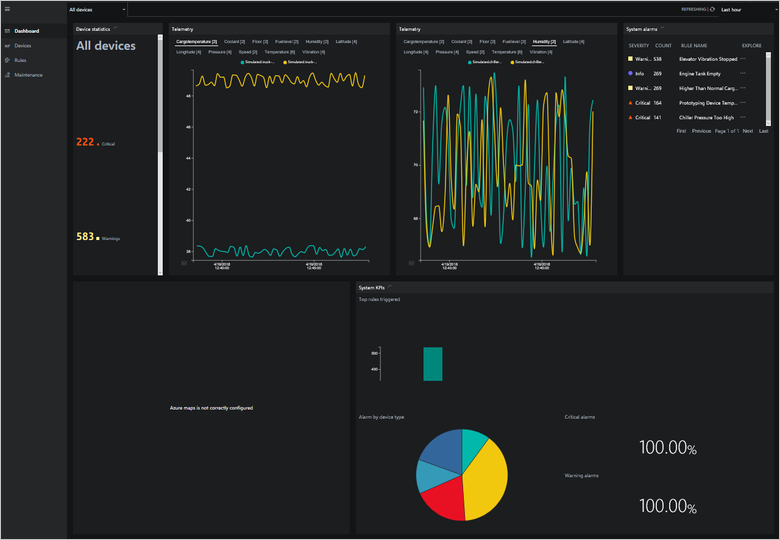
如果复制和自定义面板,则还可以添加同一面板的多个实例或多个版本。 以下示例演示如何添加遥测面板的两个实例: 若要进行这些更改,请编辑 src/components/pages/dashboard/dashboard.js 文件:
<PageContent className="dashboard-container">
  <Grid>
    <Cell className="col-1 devices-overview-cell">
      <OverviewPanel
        activeDeviceGroup={activeDeviceGroup}
        openWarningCount={openWarningCount}
        openCriticalCount={openCriticalCount}
        onlineDeviceCount={onlineDeviceCount}
        offlineDeviceCount={offlineDeviceCount}
        isPending={analyticsIsPending || devicesIsPending}
        error={deviceGroupError || devicesError || analyticsError}
        t={t} />
    </Cell>
    <Cell className="col-3">
      <TelemetryPanel
        timeSeriesExplorerUrl={timeSeriesParamUrl}
        telemetry={telemetry}
        isPending={telemetryIsPending}
        lastRefreshed={lastRefreshed}
        error={deviceGroupError || telemetryError}
        theme={theme}
        colors={chartColorObjects}
        t={t} />
    </Cell>
    <Cell className="col-3">
      <AlertsPanel
        alerts={currentActiveAlertsWithName}
        isPending={analyticsIsPending || rulesIsPending}
        error={rulesError || analyticsError}
        t={t}
        deviceGroups={deviceGroups} />
    </Cell>
    <Cell className="col-4">
      <PanelErrorBoundary msg={t('dashboard.panels.map.runtimeError')}>
        <MapPanel
          analyticsVersion={analyticsVersion}
          azureMapsKey={azureMapsKey}
          devices={devices}
          devicesInAlert={devicesInAlert}
          mapKeyIsPending={azureMapsKeyIsPending}
          isPending={devicesIsPending || analyticsIsPending}
          error={azureMapsKeyError || devicesError || analyticsError}
          t={t} />
      </PanelErrorBoundary>
    </Cell>
    <Cell className="col-6">
      <AnalyticsPanel
        timeSeriesExplorerUrl={timeSeriesParamUrl}
        topAlerts={topAlertsWithName}
        alertsPerDeviceId={alertsPerDeviceType}
        criticalAlertsChange={criticalAlertsChange}
        isPending={analyticsIsPending || rulesIsPending || devicesIsPending}
        error={devicesError || rulesError || analyticsError}
        theme={theme}
        colors={chartColorObjects}
        t={t} />
    </Cell>
    {
      Config.showWalkthroughExamples &&
      <Cell className="col-4">
        <ExamplePanel t={t} />
      </Cell>
    }
  </Grid>
</PageContent>
然后,可以在每个面板中查看不同的遥测数据:
复制和自定义现有控件
以下步骤概述如何复制现有面板、对其进行修改,然后使用修改后的版本。 这些步骤以“警报”面板为例:
在存储库的本地副本中,复制
src/components/pages/dashboard/panels文件夹中的 alerts 文件夹。 将新副本命名为 cust_alerts。在 cust_alerts 文件夹中的 alertsPanel.js 文件内,将类名编辑为 CustAlertsPanel:
export class CustAlertsPanel extends Component {将以下代码行添加到
src/components/pages/dashboard/panels/index.js文件:export * from './cust_alerts';在
src/components/pages/dashboard/dashboard.js中将alertsPanel替换为CustAlertsPanel:import { OverviewPanel, CustAlertsPanel, TelemetryPanel, KpisPanel, MapPanel, transformTelemetryResponse, chartColors } from './panels'; ... <Cell className="col-3"> <CustAlertsPanel alerts={currentActivealertsWithName} isPending={kpisIsPending || rulesIsPending} error={rulesError || kpisError} t={t} /> </Cell>
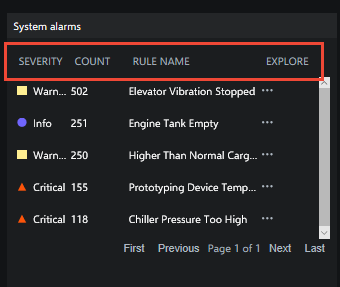
现已将原始“警报”面板替换为名为 CustAlerts 的副本。 此副本与原始版本相同。 现在可以修改副本。 例如,若要更改“警报”面板中的列顺序:
打开
src/components/pages/dashboard/panels/cust_alerts/alertsPanel.js文件。按以下代码片段中所示修改列定义:
this.columnDefs = [
  rulesColumnDefs.severity,
  {
    headerName: 'rules.grid.count',
    field: 'count'
  },
  {
    ...rulesColumnDefs.ruleName,
    minWidth: 200
  },
  rulesColumnDefs.explore
];
以下屏幕截图显示了“警报”面板的新版本:
自定义遥测图表
src/components/pages/dashboard/panels/telemtry 文件夹中的文件定义“仪表板”页面上的遥测图表。 UI 从 src/services/telemetryService.js 文件中的解决方案后端检索遥测数据。 以下步骤说明如何将遥测图表上显示的时间段从 15 分钟更改为 5 分钟:
在
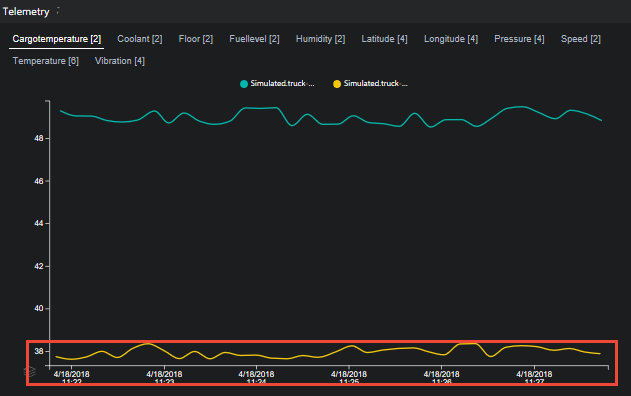
src/services/telemetryService.js文件中,找到名为 getTelemetryByDeviceIdP15M 的函数。 复制此函数,并按如下所示修改副本:static getTelemetryByDeviceIdP5M(devices = []) { return TelemetryService.getTelemetryByMessages({ from: 'NOW-PT5M', to: 'NOW', order: 'desc', devices }); }若要使用此新函数填充遥测图表,请打开
src/components/pages/dashboard/dashboard.js文件。 找到初始化遥测流的行,并按如下所示对其进行修改:const getTelemetryStream = ({ deviceIds = [] }) => TelemetryService.getTelemetryByDeviceIdP5M(deviceIds)
现在,遥测图表显示五分钟的遥测数据:
添加新 KPI
“仪表板”页面在“分析”面板中显示 KPI。 这些 KPI 在 src/components/pages/dashboard/dashboard.js 文件中计算。 KPI 由 src/components/pages/dashboard/panels/analytics/analyticsPanel.js 文件呈现。 以下步骤说明如何在“仪表板”页面上计算和呈现新 KPI 值。 所示的示例在警告警报 KPI 中添加新的百分比更改:
打开
src/components/pages/dashboard/dashboard.js文件。 按如下所示修改 initialState 对象,以包含 warningAlertsChange 属性:const initialState = { ... // Analytics data analyticsVersion: 0, currentActiveAlerts: [], topAlerts: [], alertsPerDeviceId: {}, criticalAlertsChange: 0, warningAlertsChange: 0, analyticsIsPending: true, analyticsError: null ... };修改 currentAlertsStats 对象,以包含 totalWarningCount 作为属性:
return {
  openWarningCount: (acc.openWarningCount || 0) + (isWarning && isOpen ? 1 : 0),
  openCriticalCount: (acc.openCriticalCount || 0) + (isCritical && isOpen ? 1 : 0),
  totalWarningCount: (acc.totalWarningCount || 0) + (isWarning ? 1 : 0),
  totalCriticalCount: (acc.totalCriticalCount || 0) + (isCritical ? 1 : 0),
  alertsPerDeviceId: updatedAlertsPerDeviceId
};
计算新 KPI。 找到关键警报计数的计算结果。 复制代码并按如下所示修改副本:
// ================== Warning Alerts Count - START
const currentWarningAlerts = currentAlertsStats.totalWarningCount;
const previousWarningAlerts = previousAlerts.reduce(
  (cnt, { severity }) => severity === Config.ruleSeverity.warning ? cnt + 1 : cnt,
  0
);
const warningAlertsChange = ((currentWarningAlerts - previousWarningAlerts) / currentWarningAlerts * 100).toFixed(2);
// ================== Warning Alerts Count - END
在 KPI 流中包括新的 warningAlertsChange KPI:
return ({
  analyticsIsPending: false,
  analyticsVersion: this.state.analyticsVersion + 1,

  // Analytics data
  currentActiveAlerts,
  topAlerts,
  criticalAlertsChange,
  warningAlertsChange,
  alertsPerDeviceId: currentAlertsStats.alertsPerDeviceId,

  ...
});
在用于呈现 UI 的状态数据中包含新的 warningAlertsChange KPI:
const {
  ...

  analyticsVersion,
  currentActiveAlerts,
  topAlerts,
  alertsPerDeviceId,
  criticalAlertsChange,
  warningAlertsChange,
  analyticsIsPending,
  analyticsError,

  ...
} = this.state;
更新传递给 KPI 面板的数据:
<AnalyticsPanel
  timeSeriesExplorerUrl={timeSeriesParamUrl}
  topAlerts={topAlertsWithName}
  alertsPerDeviceId={alertsPerDeviceType}
  criticalAlertsChange={criticalAlertsChange}
  warningAlertsChange={warningAlertsChange}
  isPending={analyticsIsPending || rulesIsPending || devicesIsPending}
  error={devicesError || rulesError || analyticsError}
  theme={theme}
  colors={chartColorObjects}
  t={t} />
现已完成 src/components/pages/dashboard/dashboard.js 文件中的更改。 以下步骤说明如何在 src/components/pages/dashboard/panels/analytics/analyticsPanel.js 文件中进行更改,以显示新 KPI:
按如下所示修改以下代码行,以检索新 KPI 值:
const { t, isPending, criticalAlertsChange, warningAlertsChange, alertsPerDeviceId, topAlerts, timeSeriesExplorerUrl, error } = this.props;按如下所示修改标记,以显示新 KPI 值:
<div className="analytics-cell">
  <div className="analytics-header">{t('dashboard.panels.analytics.criticalAlerts')}</div>
  <div className="critical-alerts">
    {
      !showOverlay &&
        <div className="analytics-percentage-container">
          <div className="analytics-value">{ !isNaN(criticalAlertsChange) ? criticalAlertsChange : 0 }</div>
          <div className="analytics-percentage-sign">%</div>
        </div>
    }
  </div>
  <div className="critical-alerts">
    {
      !showOverlay &&
        <div className="analytics-percentage-container">
          <div className="analytics-value">{ !isNaN(warningAlertsChange) ? warningAlertsChange : 0 }</div>
          <div className="analytics-percentage-sign">%</div>
        </div>
    }
  </div>
</div>
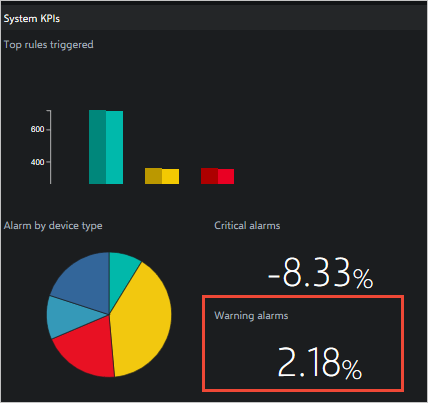
“仪表板”页面现在会显示新 KPI 值:
自定义映射
请参阅 GitHub 中的自定义映射页,了解解决方案中映射组件的详细信息。
其他自定义选项
若要进一步修改远程监视解决方案中的呈现和可视化层,可以编辑代码。 相关的 GitHub 存储库包括:
后续步骤
本文已介绍可用来帮助自定义远程监视解决方案加速器中 Web UI 的资源。 若要详细了解如何自定义 UI,请参阅以下文章:
- 向远程监视解决方案加速器 Web UI 添加自定义页面
- 向远程监视解决方案加速器 Web UI 添加自定义服务
- 向远程监视解决方案加速器 Web UI 添加自定义网格
- 向远程监视解决方案加速器 Web UI 添加自定义浮出控件
- 向远程监视解决方案加速器 Web UI 中的仪表板上添加自定义面板
有关远程监视解决方案加速器的其他概念性信息,请参阅远程监视体系结构
有关自定义远程监视解决方案微服务的详细信息,请参阅自定义和重新部署微服务。