练习 - 按计算机汇总可用空间统计信息
在这里,你将使用 KQL 查询从 Perf 表中检索和转换数据,以分析计算机将数据记录到 Log Analytics 工作区的可用空间。
1. 设定目标
回想一下,IT 团队已经注意到与虚拟机上可用空间不足相关的反复问题。
若要分析在 IT 环境中运行的计算机的可用空间使用情况,需要掌握以下相关信息:
- 每台计算机上可用的总可用空间。
- 每台计算机上已用空间百分比。
2. 评估日志
如上一练习所示,Perf 表提供有关硬件组件、操作系统和应用程序性能的信息。
我们注意到,Perf 表在 ObjectName 列中列出了要监视的所有对象的名称,CounterName 列保留 Azure Monitor 收集的各种性能计数器的名称。 我们还发现,这两个列都保留了大量值,其中许多值多次出现。
让我们对 Perf 表运行查询以列出非重复 ObjectName 值:
Perf // The table you’re querying
| distinct ObjectName // Lists distinct ObjectName values
此查询的结果集包括表中当前的所有 ObjectName 值:

在我们的方案中,我们有兴趣分析虚拟机,因此我们想要查看的对象是 LogicalDisk 和 Logical Disk(用于监视物理计算机中的内存,你将查看 memory 对象)。 这两个对象命名相似的原因是,LogicalDisk 是 Windows 记录中的对象名称,而 Logical Disk 用于 Linux 记录。
若要列出 Azure Monitor 为 LogicalDisk 和 Logical Disk 对象收集的计数器的不同名称,请运行:
Perf // The table you’re querying
| where ObjectName == "LogicalDisk" or // The object name used in Windows records
ObjectName == "Logical Disk" // The object name used in Linux records
| distinct CounterName // Lists distinct CounterName values
此查询的结果集包括为 LogicalDisk 和 Logical Disk 对象收集的所有性能计数器:

提供有关已用空间和可用空间信息的性能计数器是 % Used Space、% Free Space 和 Free Megabytes。 我们分别从 Windows 和 Linux 记录收集了两个相似的计数器,即 % Free Space 和 % Used Space。
让我们来评估如何使用此数据,以及哪些 KQL 操作可以帮助提取和转换数据:
| 列 | 说明 | 分析目标 | 相关的 KQL 操作 |
|---|---|---|---|
TimeGenerated |
指示虚拟机何时生成每个日志。 | 定义分析的时间范围。 | where TimeGenerated > ago(1d) 有关详细信息,请参阅 ago()、where 运算符和数值运算符。 |
Computer |
从中收集事件的计算机。 | 将 CPU 使用率与特定计算机相关联。 | summarize... by Computer 有关详细信息,请参阅 summarize 运算符。 |
ObjectName |
保留表中保留了性能数据的所有对象的名称。 对于分析,你感兴趣的是 LogicalDisk 和 Logical Disk 对象。 |
监视虚拟机中的逻辑磁盘。 | where ObjectName == "LogicalDisk" or ObjectName == "Logical Disk"有关详细信息,请参阅 where 运算符和 == (equals) 运算符。 |
CounterName |
保留表中所有性能计数器的名称。 |
|
where CounterName == "Free Megabytes" or CounterName =="% Free Space" or CounterName == "% Used Space"为了简化结果并进一步分析:
|
InstanceName |
列出受监视对象的受监视实例。 | 监视虚拟机上的所有驱动器。 | InstanceName == "_Total" 有关详细信息,请参阅 where 运算符和 == (equals) 运算符。 |
CounterValue |
为计数器收集的测量值。 | 检索 % Used Space、% Free Space 和 Free Megabytes 性能计数器的性能测量值。 |
|
3. 编写查询
检索过去一天生成的所有日志,这些日志报告了
LogicalDisk和Logical Disk对象的% Used Space、% Free Space和Free Megabytes性能计数器:Perf | where TimeGenerated > ago(1d) | where ObjectName == "LogicalDisk" or // The object name used in Windows records ObjectName == "Logical Disk" // The object name used in Linux records | where CounterName == "Free Megabytes" or CounterName =="% Free Space" or CounterName == "% Used Space" // Filters for the performance counters Free Megabytes, % Free Space, and % Used Space performance counters | where InstanceName == "_Total" // Retrieves data related to free space for all drives on a virtual machine此查询的结果集可能包含每台计算机(从中收集与可用空间相关的性能计数器)的多个记录。

筛选出每个虚拟机报告的每个计数器收集的最后一个计数器值:
Perf
| where TimeGenerated > ago(1d)
| where ObjectName == "LogicalDisk" or // The object name used in Windows records
ObjectName == "Logical Disk" // The object name used in Linux records
| where CounterName == "Free Megabytes" or CounterName =="% Free Space" or CounterName == "% Used Space" // Filters for the performance counters Free Megabytes, % Free Space, and % Used Space performance counters
| where InstanceName == "_Total"  // Retrieves data related to free space for all drives on a virtual disk
| summarize arg_max(TimeGenerated, CounterValue) by Computer, CounterName // Retrieves the last counter value collected for each counter for every virtual machine
现在,对于每台计算机的每个可用空间相关计数器,你有最新报告的计数器值。

为了便于分析:
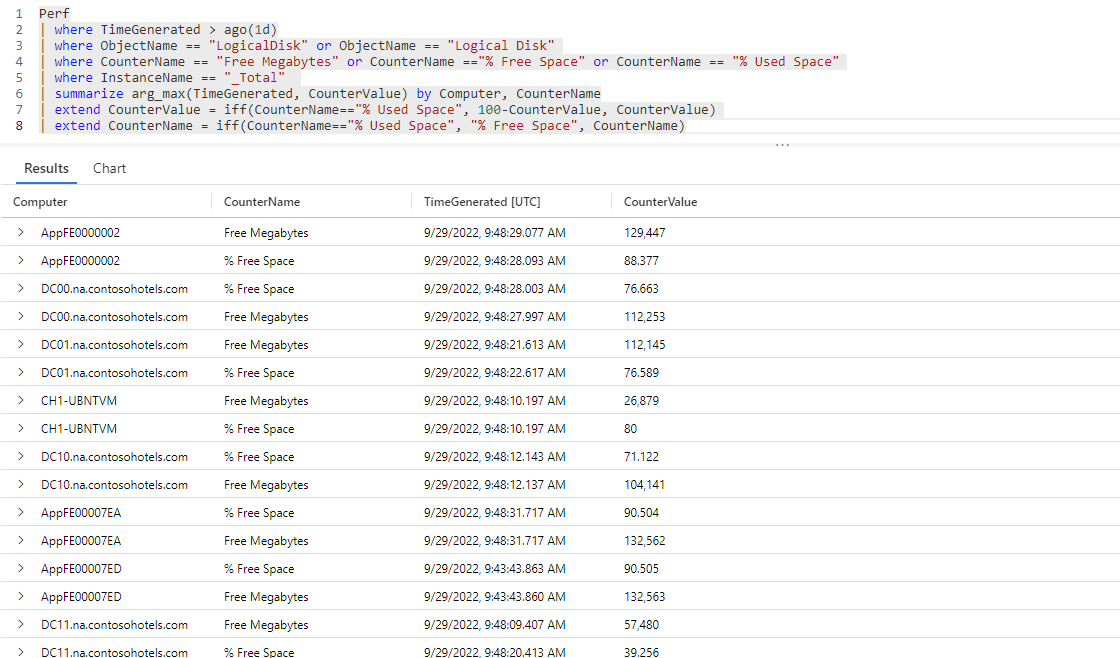
将
% Used Space计算器值转换为% Free Space(通过从 100% 减去% Used Space值),并将% Used Space列名称更改为% Free Space:Perf | where TimeGenerated > ago(1d) | where ObjectName == "LogicalDisk" or // The object name used in Windows records ObjectName == "Logical Disk" // The object name used in Linux records | where CounterName == "Free Megabytes" or CounterName =="% Free Space" or CounterName == "% Used Space" // Filters for the performance counters Free Megabytes, % Free Space, and % Used Space performance counters | where InstanceName == "_Total" // Retrieves data related to free space for all drives on a virtual disk | summarize arg_max(TimeGenerated, CounterValue) by Computer, CounterName // Retrieves the last counter value collected for each counter for every virtual machine | extend CounterValue = iff(CounterName=="% Used Space", 100-CounterValue, CounterValue) // Converts % Used Space to % Free Space | extend CounterName = iff(CounterName=="% Used Space", "% Free Space", CounterName) // Changes the column name from % Used Space to % Free Space此查询的结果集以相同的方式呈现 Windows 和 Linux 计算机上可用空间的百分比,这使得进一步分析更加清晰和轻松。
将
Free Megabytes转换为千兆字节(Free Megabytes值 * 0.001 = 可用空间,以千兆字节计),将Free Megabytes重新标记为OverallFreeSpaceInGB:Perf | where TimeGenerated > ago(1d) | where ObjectName == "LogicalDisk" or // The object name used in Windows records ObjectName == "Logical Disk" // The object name used in Linux records | where CounterName == "Free Megabytes" or CounterName =="% Free Space" or CounterName == "% Used Space" // Filters for the performance counters Free Megabytes, % Free Space, and % Used Space performance counters | where InstanceName == "_Total" // Retrieves data related to free space for all drives on a virtual disk | summarize arg_max(TimeGenerated, CounterValue) by Computer, CounterName // Retrieves the last counter value collected for each counter for every virtual machine | extend CounterValue = iff(CounterName=="% Used Space", 100-CounterValue, CounterValue) // Converts % Used Space to % Free Space | extend CounterName = iff(CounterName=="% Used Space", "% Free Space", CounterName) // Changes the column name from % Used Space to % Free Space | extend CounterValue = iff(CounterName=="Free Megabytes", (CounterValue)*0.001, CounterValue) // Converts megabytes to gigabytes | extend CounterName= iff(CounterName=="Free Megabytes", "OverallFreeSpaceInGB", CounterName) // Changes the column name fromFree Megabytes to OverallFreeSpaceInGB现在可以清楚地了解每台计算机的总可用空间(以千兆字节计),以及计算机总内存的百分比。


挑战:将每台计算机的可用空间统计信息汇总到一起
到目前为止,查询的结果集包括每台计算机的两行内容:一行显示以千兆字节为单位的总可用空间,另一行显示可用的可用空间的百分比。
是否可以创建一个字典,将每个虚拟机的这两种可用空间统计信息汇总到一起?
提示:
- 使用 bag_pack() 函数为两个性能计数器中的每一个创建键值对。
- 使用 make_bag() 聚合函数捆绑每台计算机的键值值。
解决方案:
组合
CounterName, CounterValue键值对:Perf | where TimeGenerated > ago(1d) | where ObjectName == "LogicalDisk" or // The object name used in Windows records ObjectName == "Logical Disk" // The object name used in Linux records | where CounterName == "Free Megabytes" or CounterName =="% Free Space" or CounterName == "% Used Space" // Filters for the performance counters Free Megabytes, % Free Space, and % Used Space performance counters | where InstanceName == "_Total" // Retrieves data related to free space for all drives on a virtual disk | summarize arg_max(TimeGenerated, CounterValue) by Computer, CounterName // Retrieves the last counter value collected for each counter for every virtual machine | extend CounterValue = iff(CounterName=="% Used Space", 100-CounterValue, CounterValue) // Converts % Used Space to % Free Space | extend CounterName = iff(CounterName=="% Used Space", "% Free Space", CounterName) // Changes the column name from % Used Space to % Free Space | extend CounterValue = iff(CounterName=="Free Megabytes", (CounterValue)*0.001, CounterValue) // Converts megabytes to gigabytes | extend CounterName= iff(CounterName=="Free Megabytes", "OverallFreeSpaceInGB", CounterName) // Changes the column name fromFree Megabytes to OverallFreeSpaceInGB | extend packed = pack(CounterName, CounterValue) // Groups together CounterName-CounterValue key-value pairs通过组合
CounterName, CounterValue键值对,可以在下一步中为每台计算机创建可用空间统计信息字典。
创建称为 SpaceStats 的属性包(字典),其中包含为每台计算机收集的所有可用空间统计信息(按计算机汇总),并筛选可用空间小于 50% 的计算机:
Perf | where TimeGenerated > ago(1d) | where ObjectName == "LogicalDisk" or // The object name used in Windows records ObjectName == "Logical Disk" // The object name used in Linux records | where CounterName == "Free Megabytes" or CounterName =="% Free Space" or CounterName == "% Used Space" // Filters for the performance counters Free Megabytes, % Free Space, and % Used Space performance counters | where InstanceName == "_Total" // Retrieves data related to free space for all drives on a virtual disk | summarize arg_max(TimeGenerated, CounterValue) by Computer, CounterName // Retrieves the last counter value collected for each counter for every virtual machine | extend CounterValue = iff(CounterName=="% Used Space", 100-CounterValue, CounterValue) // Converts % Used Space to % Free Space | extend CounterName = iff(CounterName=="% Used Space", "% Free Space", CounterName) // Changes the column name from % Used Space to % Free Space | extend CounterValue = iff(CounterName=="Free Megabytes", (CounterValue)*0.001, CounterValue) // Converts megabytes to gigabytes | extend CounterName= iff(CounterName=="Free Megabytes", "OverallFreeSpaceInGB", CounterName) // Changes the column name fromFree Megabytes to OverallFreeSpaceInGB | extend packed = pack(CounterName, CounterValue) // Groups together CounterName-CounterValue key-value pairs | summarize SpaceStats = make_bag(packed) by Computer // Summarizes free space statstics by computer | where SpaceStats.["% Free Space"]<= 50此查询的结果集按计算机汇总了可用空间统计信息,这是可用空间分析的目标!
查询的最后一行筛选出可用空间小于 50% 的计算机。 你可能想要更密切地监视或分析,或重新配置它们,以确保空间不会被用尽。


