在本教學課程中,您會開發一個名為 Circle Card (圓形卡片) 的 Power BI 視覺效果,以在圓形中顯示已設定格式的量值。 圓形卡片視覺效果支援自訂填滿色彩與外框粗細。
在本教學課程中,您會了解如何:
- [x] 為您的視覺效果建立開發專案。
- [x] 使用 D3 視覺元素來設計你的視覺。
- [x] 設定視覺效果來處理數據。
- [x] 設定視覺效果以適應大小變更。
- [x] 設定視覺效果的調適型色彩和框線設定。
如需此視覺效果的完整原始程式碼,請參閱圓形卡片 Power BI 視覺效果。
如果您沒有 Power BI 帳戶,您可以在 Power BI 網站上註冊免費試用。
必要條件
在您開始開發 Power BI 視覺效果之前,請確認您已具備此節所列的所有項目。
Power BI Pro 或 Premium Per User (PPU) 帳戶。 如果您沒有訂用帳戶,請註冊免費試用。
Visual Studio Code (VS Code)。 VS Code 是開發 JavaScript 和 TypeScript 應用程式的理想整合式開發環境 (IDE)。
Windows PowerShell 第 4 版或更新版本 (針對 Windows)。 或是終端機 (針對 Mac)。
已可用於開發 Power BI 視覺效果的環境。 設定環境以開發 Power BI 視覺效果。
此教學課程會使用 US Sales Analysis (美國銷售分析) 報表。 您可以下載此報表並將其上傳至 Power BI 服務,或是使用您自己的報表。 如果您需要 Power BI 服務及上傳檔案的詳細資訊,請參閱開始在 Power BI 服務中建立教學課程。
建立開發專案
在本節中,您會建立一個圓形卡片視覺效果的專案。
注意
在此教學課程中,會使用 Visual Studio Code \(英文\) (VS Code) 來開發 Power BI 視覺效果。
在 VS Code 中開啟新的終端機,然後瀏覽到您要在其中建立專案的資料夾。
在 PowerShell 終端機中輸入下列命令:
pbiviz new CircleCard在 VS Code 檔案總管中開啟 CircleCard 資料夾。 ([檔案]>[開啟資料夾])。
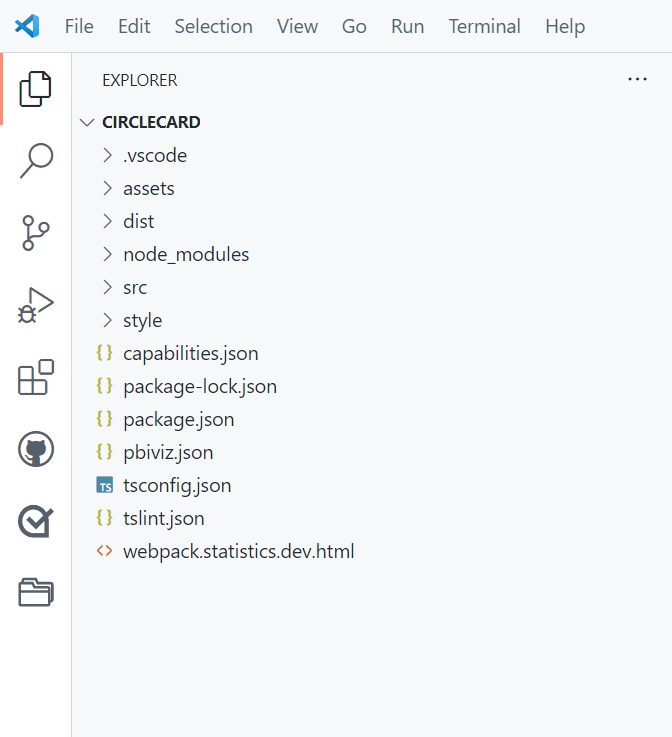
如需每個檔案函式的詳細說明,請參閱 Power BI 視覺效果項目專案結構。
檢查終端機視窗並確認您位於 circleCard 目錄中。 安裝 Power BI 視覺效果工具相依性。
npm install提示
若要查看視覺效果中已安裝哪些相依性,請檢查 package.json 檔案。
啟動圓形卡片視覺效果。
pbiviz start您的視覺效果現在會在裝載於您電腦上的情況下執行。
重要
請不要關閉 PowerSell 視窗,直到教學課程結束為止。 若要停止執行視覺效果,請輸入 Ctrl+C,如果系統提示是否要終止批次作業,請輸入 Y 並按 Enter 鍵。
檢視 Power BI 服務中的視覺效果
為了在 Power BI 服務中測試視覺效果,我們將使用 US Sales Analysis (美國銷售分析) 報表。 您可以下載 \(英文\) 此報表並將其上傳至 Power BI 服務。
您也可以使用自己的報表來測試視覺效果。
注意
繼續之前,請確認您 已啟用視覺效果開發人員模式。
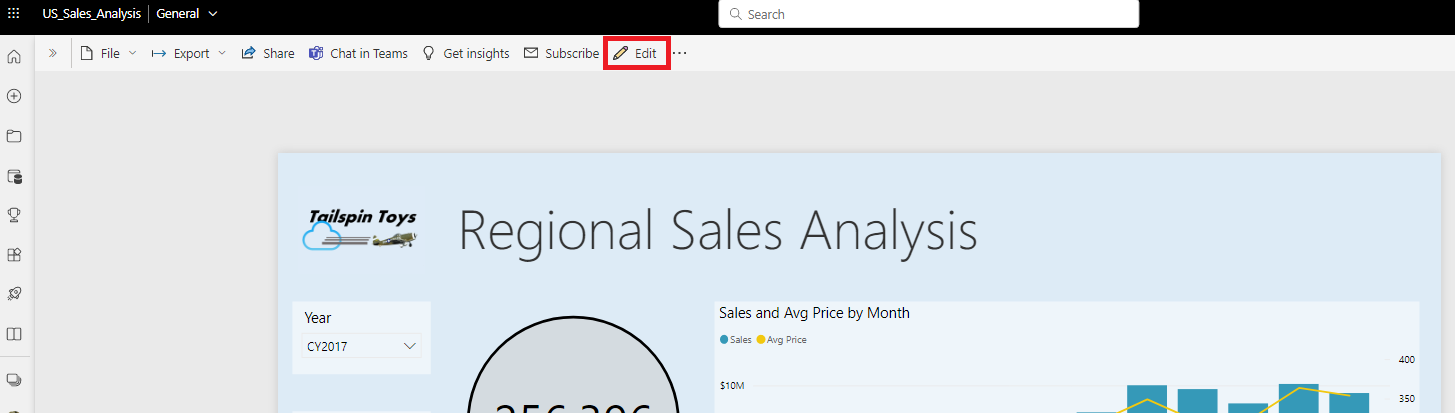
登入 PowerBI.com,然後開啟 [US Sales Analysis] \(美國銷售分析\) 報表。
選取編輯。
建立新頁面以供測試使用,然後按一下 Power BI 服務介面底部的 [新增頁面] 按鈕。

從 [視覺效果] 窗格,選取 [開發人員視覺效果]。
![[視覺效果] 窗格中 [開發人員視覺效果] 的螢幕擷取畫面。](../../includes/media/visual-tutorial-view/developer-visual.png)
此視覺效果代表您在電腦上執行的自訂視覺效果。 其只有在已啟用自訂視覺效果偵錯設定的情況下才可供使用。
確認視覺效果已新增至報表畫布。
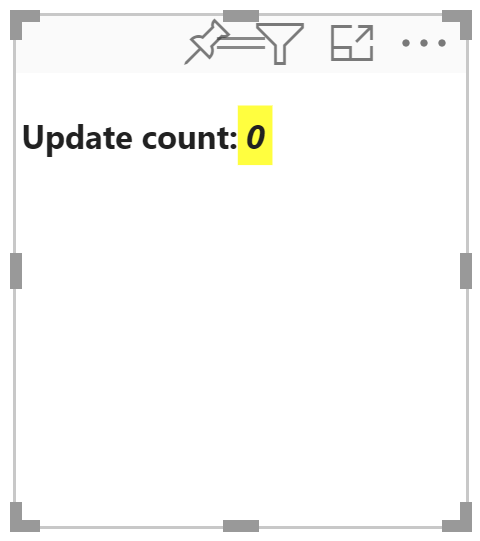
這是非常簡單的視覺效果,其會顯示已呼叫其更新方法的次數。 在這個階段中,視覺效果尚未擷取任何資料。
注意
如果視覺效果顯示連線錯誤訊息,請在瀏覽器中開啟新索引標籤,瀏覽至
https://localhost:8080/assets,並為您的瀏覽器授權以使用此位址。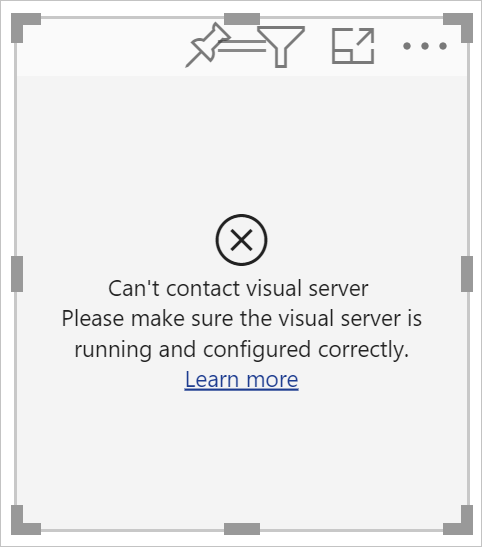
在已選取新視覺效果的情況下,移至 [資料] 窗格,展開 [Sales] \(銷售\),然後選取 [Quantity] \(數量\)。
![美國銷售分析報表中銷售數據表中 [Power BI 服務 數量] 字段的螢幕快照。](../../includes/media/visual-tutorial-view/data-sales-quantity.png)
若要測試視覺效果的回應方式,請調整其大小;請注意,[Update count] \(更新計數\) 的值會隨著您調整視覺效果的大小而遞增。
![在調整大小後顯示不同 [Update count] \(更新計數\) 數目之新視覺效果的螢幕擷取畫面。](../../includes/media/visual-tutorial-view/resized-visual.png)
新增視覺元素和文字
在本節中,您會了解如何將視覺效果轉換成圓形,並使其顯示文字。
修改視覺效果檔案
設定 visual.ts 檔案。
提示
若要改善可讀性,建議您每次將程式碼片段複製到專案之後,都對文件進行格式設定。 在 VS Code 中的任何位置以滑鼠右鍵按一下,然後選取 [格式化文件] (或輸入 Alt+Shift+F)。
在 VS Code 的 [檔案總管] 窗格中,展開 src 資料夾,然後選取 visual.ts 檔案。
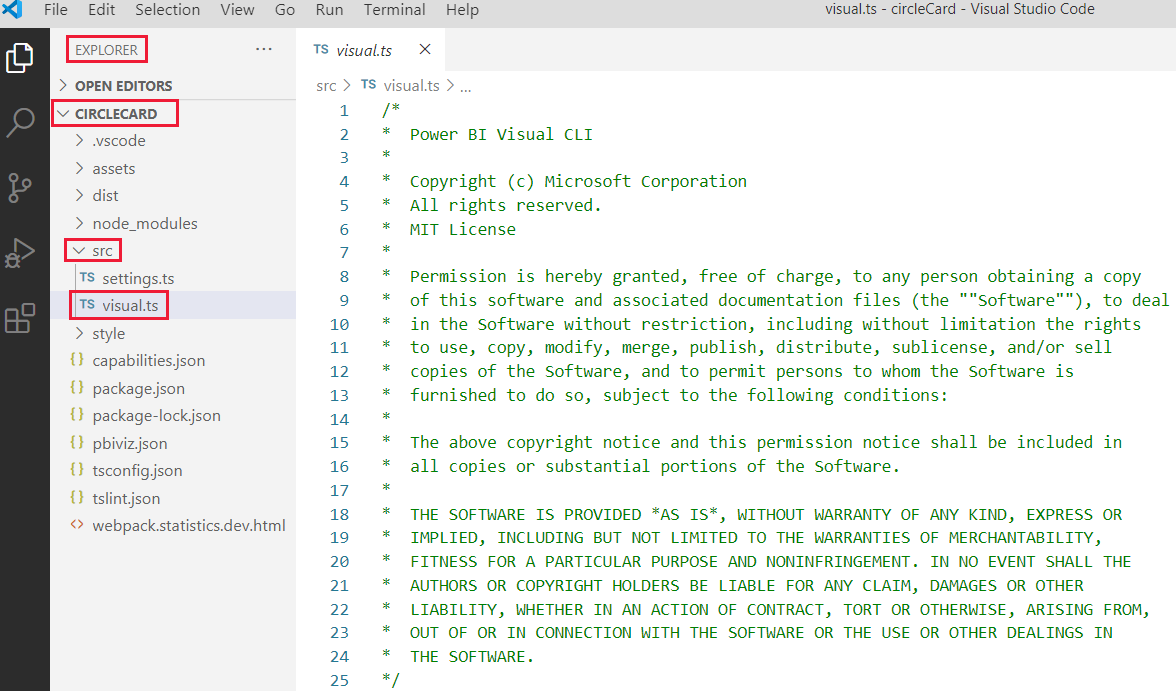
移除 MIT 授權註解下的所有程式碼。
重要
請注意在 visual.ts 檔案頂端的註解。 使用 Power BI 視覺效果套件的權限是根據 Massachusetts Institute of Technology (MIT) 授權的規定免費授與的。 根據該合約所規定,您必須將註解保留在檔案頂端。
匯入所需的連結庫和模組,並定義 d3 連結庫的類型選取範圍:
"use strict";

import "./../style/visual.less";
import powerbi from "powerbi-visuals-api";
import VisualConstructorOptions = powerbi.extensibility.visual.VisualConstructorOptions;
import VisualUpdateOptions = powerbi.extensibility.visual.VisualUpdateOptions;
import IVisual = powerbi.extensibility.visual.IVisual;
import DataView = powerbi.DataView;
import IVisualHost = powerbi.extensibility.IVisualHost;
import * as d3 from "d3";
type Selection<T extends d3.BaseType> = d3.Selection<T, any, any, any>;
注意
如果您尚未在安裝過程中安裝 D3 JavaScript 程式庫,請立即安裝。 在 PowerShell 中執行
npm i d3@latest --save請注意,您匯入的項目包括:
- IVisualHost - 用於與視覺效果主機 (Power BI) 互動的屬性和服務集合。
- D3 程式庫 - 用來建立資料驅動文件的 JavaScript 程式庫。
在匯入下方,建立一個空的 visual 類別。 visual 類別會實作所有視覺效果開始的 IVisual 介面:
export class Visual implements IVisual {

}
有關 visual 類別的內容的資訊,請參閱 Visual API。 在接下來的三個步驟中,我們會定義這個類別。
在 visual 類別的開頭新增類別層級的 private 方法:
private host: IVisualHost;
private svg: Selection<SVGElement>;
private container: Selection<SVGElement>;
private circle: Selection<SVGElement>;
private textValue: Selection<SVGElement>;
private textLabel: Selection<SVGElement>;
請注意,其中一些私用方法會使用 Selection 類型。
在 constructor 方法中定義圓形和文字元素。 當視覺效果具現化時會呼叫此方法。 D3 可縮放向量圖形 (SVG) 可讓您建立三種形狀:一個圓形和兩個文字元素:
constructor(options: VisualConstructorOptions) {
    this.svg = d3.select(options.element)
        .append('svg')
        .classed('circleCard', true);
    this.container = this.svg.append("g")
        .classed('container', true);
    this.circle = this.container.append("circle")
        .classed('circle', true);
    this.textValue = this.container.append("text")
        .classed("textValue", true);
    this.textLabel = this.container.append("text")
        .classed("textLabel", true);
}
在 update 方法中定義寬度和高度。 每次資料或主機環境發生變更 (例如新值或調整大小) 時都會呼叫此方法。
public update(options: VisualUpdateOptions) {
    let width: number = options.viewport.width;
    let height: number = options.viewport.height;
    this.svg.attr("width", width);
    this.svg.attr("height", height);
    let radius: number = Math.min(width, height) / 2.2;
    this.circle
        .style("fill", "white")
        .style("fill-opacity", 0.5)
        .style("stroke", "black")
        .style("stroke-width", 2)
        .attr("r", radius)
        .attr("cx", width / 2)
        .attr("cy", height / 2);
    let fontSizeValue: number = Math.min(width, height) / 5;
    this.textValue
        .text("Value")
        .attr("x", "50%")
        .attr("y", "50%")
        .attr("dy", "0.35em")
        .attr("text-anchor", "middle")
        .style("font-size", fontSizeValue + "px");
    let fontSizeLabel: number = fontSizeValue / 4;
    this.textLabel
        .text("Label")
        .attr("x", "50%")
        .attr("y", height / 2)
        .attr("dy", fontSizeValue / 1.2)
        .attr("text-anchor", "middle")
        .style("font-size", fontSizeLabel + "px");
}
儲存 visual.ts 檔案。
(選擇性) 檢閱視覺效果檔案中的程式碼
確認 visual.ts 檔案中的最終程式碼看起來像這樣:
/*
*  Power BI Visual CLI
*
*  Copyright (c) Microsoft Corporation
*  All rights reserved.
*  MIT License
*
*  Permission is hereby granted, free of charge, to any person obtaining a copy
*  of this software and associated documentation files (the ""Software""), to deal
*  in the Software without restriction, including without limitation the rights
*  to use, copy, modify, merge, publish, distribute, sublicense, and/or sell
*  copies of the Software, and to permit persons to whom the Software is
*  furnished to do so, subject to the following conditions:
*
*  The above copyright notice and this permission notice shall be included in
*  all copies or substantial portions of the Software.
*
*  THE SOFTWARE IS PROVIDED *AS IS*, WITHOUT WARRANTY OF ANY KIND, EXPRESS OR
*  IMPLIED, INCLUDING BUT NOT LIMITED TO THE WARRANTIES OF MERCHANTABILITY,
*  FITNESS FOR A PARTICULAR PURPOSE AND NONINFRINGEMENT. IN NO EVENT SHALL THE
*  AUTHORS OR COPYRIGHT HOLDERS BE LIABLE FOR ANY CLAIM, DAMAGES OR OTHER
*  LIABILITY, WHETHER IN AN ACTION OF CONTRACT, TORT OR OTHERWISE, ARISING FROM,
*  OUT OF OR IN CONNECTION WITH THE SOFTWARE OR THE USE OR OTHER DEALINGS IN
*  THE SOFTWARE.
*/
"use strict";

import "./../style/visual.less";
import powerbi from "powerbi-visuals-api";
import VisualConstructorOptions = powerbi.extensibility.visual.VisualConstructorOptions;
import VisualUpdateOptions = powerbi.extensibility.visual.VisualUpdateOptions;
import IVisual = powerbi.extensibility.visual.IVisual;
import DataView = powerbi.DataView;
import IVisualHost = powerbi.extensibility.IVisualHost;
import * as d3 from "d3";
type Selection<T extends d3.BaseType> = d3.Selection<T, any, any, any>;

export class Visual implements IVisual {
    private host: IVisualHost;
    private svg: Selection<SVGElement>;
    private container: Selection<SVGElement>;
    private circle: Selection<SVGElement>;
    private textValue: Selection<SVGElement>;
    private textLabel: Selection<SVGElement>;

    constructor(options: VisualConstructorOptions) {
        this.svg = d3.select(options.element)
            .append('svg')
            .classed('circleCard', true);
        this.container = this.svg.append("g")
            .classed('container', true);
        this.circle = this.container.append("circle")
            .classed('circle', true);
        this.textValue = this.container.append("text")
            .classed("textValue", true);
        this.textLabel = this.container.append("text")
            .classed("textLabel", true);
    }

    public update(options: VisualUpdateOptions) {
        let width: number = options.viewport.width;
        let height: number = options.viewport.height;
        this.svg.attr("width", width);
        this.svg.attr("height", height);
        let radius: number = Math.min(width, height) / 2.2;
        this.circle
            .style("fill", "white")
            .style("fill-opacity", 0.5)
            .style("stroke", "black")
            .style("stroke-width", 2)
            .attr("r", radius)
            .attr("cx", width / 2)
            .attr("cy", height / 2);
        let fontSizeValue: number = Math.min(width, height) / 5;
        this.textValue
            .text("Value")
            .attr("x", "50%")
            .attr("y", "50%")
            .attr("dy", "0.35em")
            .attr("text-anchor", "middle")
            .style("font-size", fontSizeValue + "px");
        let fontSizeLabel: number = fontSizeValue / 4;
        this.textLabel
            .text("Label")
            .attr("x", "50%")
            .attr("y", height / 2)
            .attr("dy", fontSizeValue / 1.2)
            .attr("text-anchor", "middle")
            .style("font-size", fontSizeLabel + "px");
    }
}
修改 capabilities 檔案
圓形卡片視覺效果是一種簡單的視覺效果,不會在 [格式] 窗格中建立任何物件。 因此,您可以安全地移除檔案中的 objects 區段。
在 VS Code 中開啟您的專案 ([檔案]>[開啟資料夾])。
選取 [capabilities.json] 檔案。
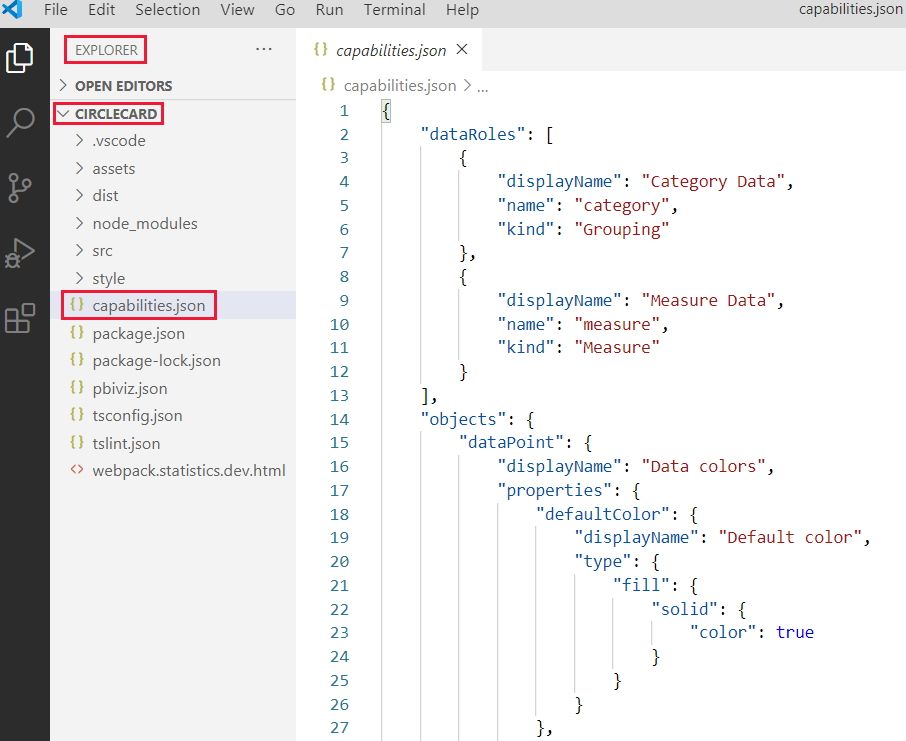
移除整個 objects 陣列。
不要在 dataRoles 和 dataViewMappings 之間留下任何空白行。儲存 capabilities.json 檔案。
重新啟動圓形卡片視覺效果
停止視覺效果執行並加以重新啟動。
在啟動視覺效果的 [PowerShell] 視窗中,輸入 Ctrl+C。 如果系統提示您終止批次作業,請輸入 Y,然後按 Enter 鍵。
在 [PowerShell] 中,再次啟動視覺效果。
pbiviz start
使用新增的元素測試視覺效果
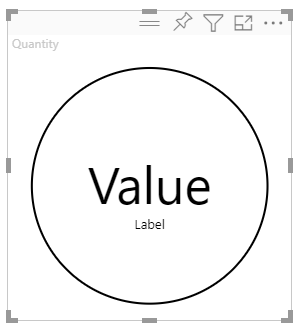
確認視覺效果會顯示新增的元素。
在 Power BI 服務中,開啟 Power BI US Sales Analysis (Power BI 美國銷售分析) 報表。 如果您是使用不同的報表來開發圓形卡片視覺效果,請瀏覽到該報表。
將值拖曳到 [量值] 方塊中,並確定視覺效果已形成圓形。
如果視覺效果未顯示任何內容,請從 [欄位] 窗格中,將 [Quantity] \(數量\) 欄位拖曳到開發人員視覺效果中。
調整視覺效果的大小。
請注意圓形與文字會縮放,以符合視覺效果的尺寸。 系統會在您調整視覺效果的大小時呼叫 update 方法,導致視覺效果元素重新調整。
啟用自動重新載入
使用此設定來確保您每次儲存專案變更時,視覺效果都會自動重新載入。
瀏覽到 Power BI US Sales Analysis (Power BI 美國銷售分析) 報表 (或是具有您圓形卡片視覺效果的專案)。
選取圓形卡片視覺效果。
在浮動工具列中,選取 [切換自動重新載入]。
![在圓形卡片視覺效果浮動工具列中按一下 [切換自動重新載入] 選項的螢幕擷取畫面。](media/develop-circle-card/toggle-auto-reload.png)
讓視覺效果處理資料
在本節中,您會定義資料角色和資料檢視對應。 您也會修改視覺效果以顯示其正在顯示之值的名稱。
設定 capabilities 檔案
修改 capabilities.json 檔案,以定義資料角色、物件與資料檢視對應。
定義資料角色
以 measure 類型的單一資料角色來定義 dataRoles 陣列。 此資料角色稱為 measure,且會顯示為 Measure。 這可讓您傳遞量值欄位,或是加總欄位。
在 VS Code 中開啟 capabilities.json 檔案。
移除 dataRoles 陣列內的所有內容。
將下列程式碼插入 dataRoles 陣列中。
{
    "displayName": "Measure",
    "name": "measure",
    "kind": "Measure"
}
儲存 capabilities.json 檔案。
定義資料檢視對應
在 dataViewMappings 陣列中定義一個名為 measure 的欄位。 此欄位可以傳遞至資料角色。
在 VS Code 中開啟 capabilities.json 檔案。
移除 dataViewMappings 陣列內的所有內容。
將下列程式碼插入 dataViewMappings 陣列。
{
    "conditions": [
        { "measure": { "max": 1 } }
    ],
    "single": {
        "role": "measure"
    }
}
儲存 capabilities.json 檔案。
確認您的 capabilities.json 檔案看起來像這樣:
{
    "dataRoles": [
        {
            "displayName": "Measure",
            "name": "measure",
            "kind": "Measure"
        }
    ],
    "dataViewMappings": [
        {
            "conditions": [
                { "measure": { "max": 1 } }
            ],
            "single": {
                "role": "measure"
            }
        }
    ],
    "privileges": []
}