Application Insights Connector in OMS
Summary: Monitor performance of your apps with the Public Preview of the Application Insights Connector in OMS Log Analytics.
Hey everyone, this is Cigdem Kontaci. I am glad to announce the Public Preview of the Application Insights Connector in OMS Log Analytics. Application Insights, which is an analytics service that’s designed for developers, monitors live web applications. It enables you to detect and diagnose performance issues and understand what users do with your app. Integrating your Application Insights apps to OMS increases your organization’s visibility over your applications by having operation and application data in one place.
Overview of the solution
With the Application Insights Connector in OMS, you can:
- View all your Application Insights apps in a single pane of glass, even if they are in different subscriptions
- Correlate infrastructure data with application data
- Visualize application data with perspectives in OMS search
- Pivot from the Log Analytics data to your Application Insights app in the Azure portal
Get started
To use the Application Insights Connector, you first must link your Application Insights apps to your OMS Log Analytics workspace. To do this in the Log Analytics portal, you should:
- Go to the Solutions Gallery and enable the Application Insights Connector. This will add the Application Insights Connector tile to the Overview page.
- To configure a data collection, go to your Settings page and click Data > Application Insights tab.
- Select your Azure subscription and Application Insights apps by checking the boxes.
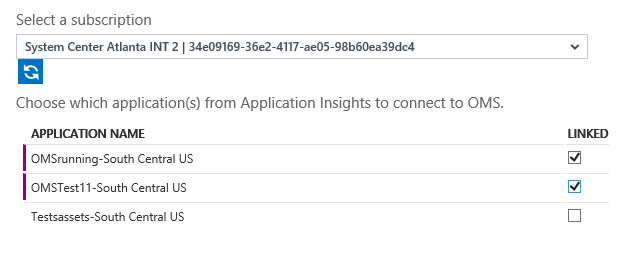
- Click the Save button at the top of the screen

- You are done! Go to your Overview page to see the Application Insights Connector. The initial data will be available within approximately 30 minutes.
Use the solution
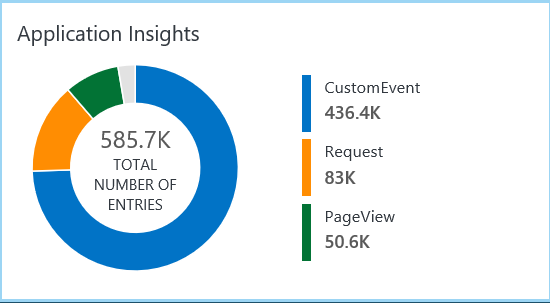
Within the solution, you can see the details about Request, Exception, Availability, Page View, and Custom Event types that come from your connected Application Insights apps.
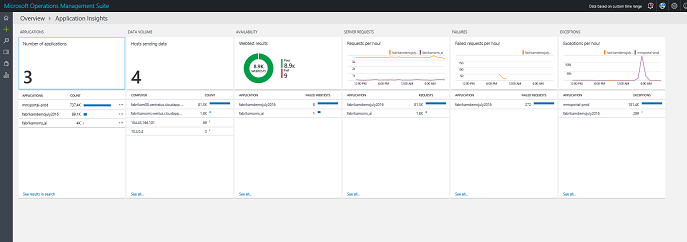
After you click the Application Insights tile from the Overview page, you will see a view with information about:
- Applications monitored
- Availability
- Request volumes and failures
- Exceptions
Page view and Custom Event data is available from search.
Application Insights perspective in search
The Application Insights perspective in search provides extended visualization depending on the telemetry type that you are searching for.
When you drill down from the solution dashboard, you will see visuals on top of the search results. Depending on the blade that you selected on the Solution page, visualization content changes.
When you drill down from the Applications blade, you see the default perspective.
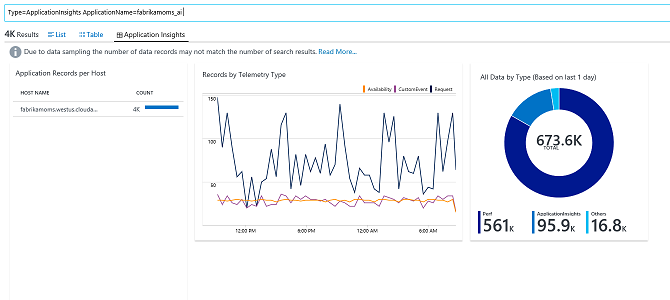
This perspective shows an overview of the application that you selected.
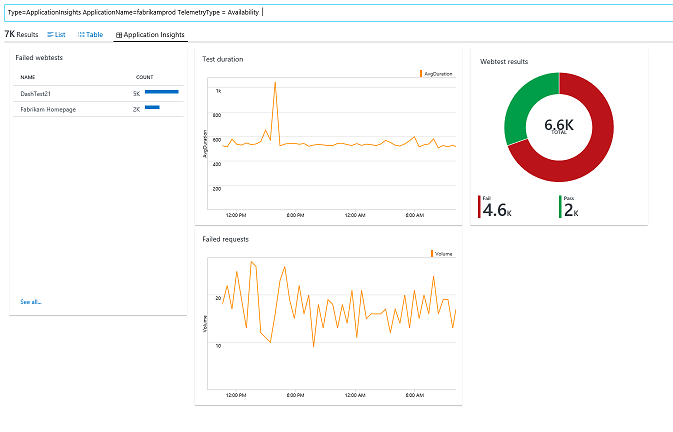
The Availability blade lands in another perspective view where you can see web test results and related failed requests.
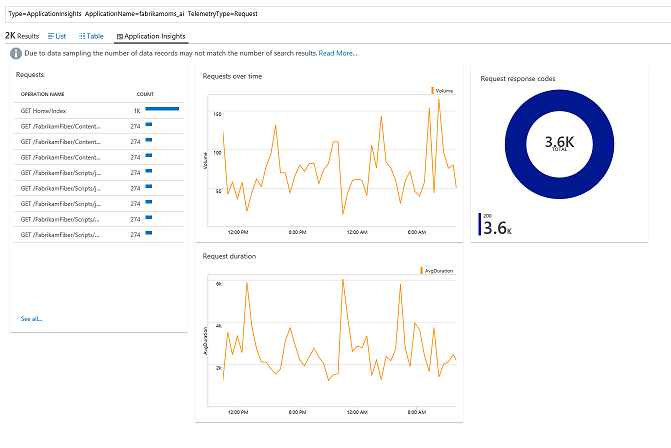
When you drill down from the Server Requests or Failures blade, the perspective components change to give you a visualization that related to requests.
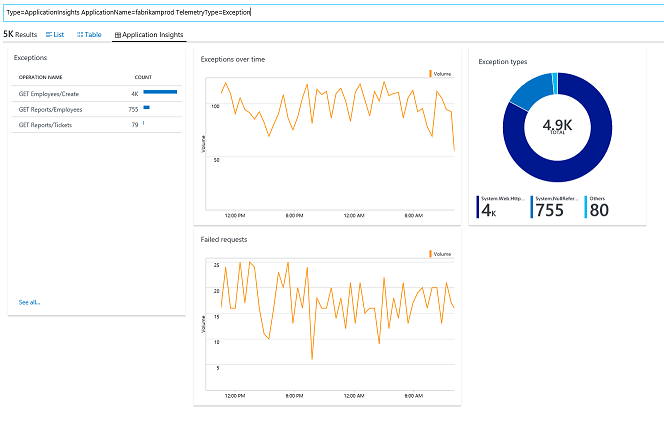
Drilling down from the Exceptions blade, you will see a visualization that's tailored to exceptions.
Even if you are not drilling down from the Application Insights Connector page, within the Search page itself, any query returning Application Insights data will show the Application Insights perspective. For example, if you have Application Insights data, a “*” query will also show the perspective tab as in the following screenshot.
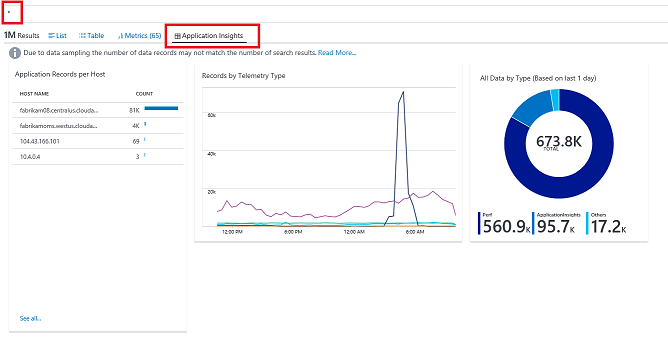
Perspective components are updated depending on the search query. This means that you can filter the results by using any search field that gives you the ability to see the data coming from all your applications, a single selected application, or a group of applications.
Pivot to the Application Insights app in the Azure portal
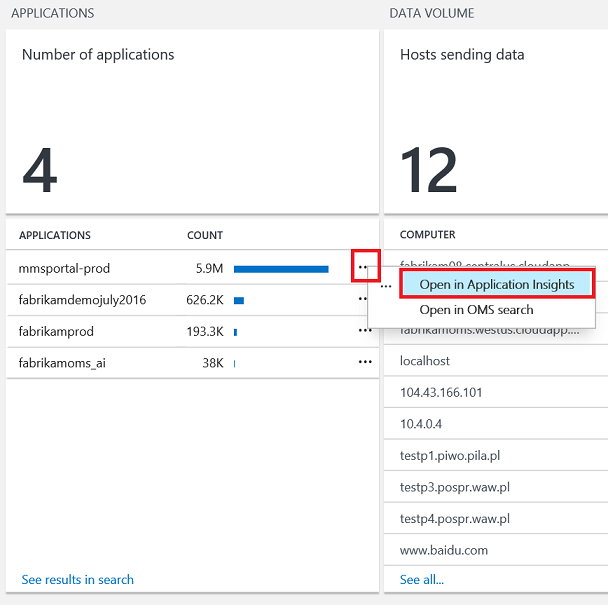
Application Insights Connector blades are designed to enable you to pivot to the selected Application Insights app. This way, you can use the solution as a high-level monitoring platform that eases up the troubleshooting process. Upon encountering an anomaly in any of your connected applications, you can either drill down to OMS search or pivot directly to the Application Insights app.
To pivot, click the ellipses that appears at the end of each list line, and select Open in Application Insights.
Sample correction on Application Insights data
Application Insights provides sampling capability to help reduce telemetry traffic. When you enable sampling on your Application Insights app, you get a reduced number of entries stored both in Application Insights and OMS. While data consistency is preserved in the Application Insights Connector page and perspectives, you should manually correct sampled data for your custom queries.
Here is an example of sampling correction:
Type=ApplicationInsights | measure sum(SampledCount) by TelemetryType
The Sampled Count field is present in all entries and shows the number of data points that the entry represents. If you turn on sampling for your Application Insights app, Sampled Count will be greater than 1. To count the actual number of entries that your application generates, sum the Sampled Count fields.
Please note that sampling affects only the total number of entries that your application generates. You do not need to correct sampling for metric fields such as RequestDuration or AvailabilityDuration because these fields show the average for represented entries.
Notes
- Only Standard/Premium Application Insights resources can be linked to OMS Log Analytics. You can use the Free tier of Log Analytics.
- You must be the owner or contributor of the Application Insights resource.
- Please unlink all your Application Insights apps before removing/closing the workspace/solution.
- You can link an Application Insights app to only one OMS workspace.
That is all I have for you today. I would like to hear any feedback you have. To see the solution before you try it in your own environment, try it out in a live demo environment.
Please feel free to send me an e-mail at cigkoc@microsoft.com with questions, comments and suggestions.
Cigdem Kontaci
Microsoft Operations Management Team
Comments
- Anonymous
April 27, 2017
Is this a good solution for the following problem - We're only keeping 90 days of data in App Insights. However, we'd like to summarize that data by customer/day/webpage, and store it for possibly years so we can analyze performance and quality trends. We're currently using App Insights Continuous Export + Stream Analytics to do the summarization and store in table storage. Is this connector + OMS an alternative to this? The data would need to be stored summarized since years of data would otherwise probably be Terabytes of data which I assume to be too expensive or perform to poorly for queries. - Anonymous
July 18, 2017
How much time it takes to get the appliCation insights in the OMS portal I have created the solution on yesterday but its been running till now, it says Performing assessments. - Anonymous
July 19, 2017
The comment has been removed - Anonymous
August 10, 2017
Is there anyway of automating connectors in OMS using ARM templates instead of going to OMS portal.