Walk Through Getting Started with ETW TraceEvent NuGet Samples package
In a previous post, I talked about the TraceEvent NuGet Library, which allows you to read and manipulate Event Tracing for Windws (ETW). There is a companion post about the EventSource NuGet package which allows you to create your own ETW events (or in fact to send those events to anywhere you choose). My blog entries have a by subject sorting that is handy if you wish to learn more.
But I realized that I have not really shown you step-by-step how to get started with these NuGet packages, and while it is easy, I could easily believe many people are not familiar with NuGet. So in this blog I will show you just how easy it is to get started with this using Visual Studio. (By the way you can get Visual Studio Express as a free download here).
So if you have any interest at all in tracing on windows here is your chance to experiment. To give you an idea just how powerful ETW and the TraceEvent library is, the PerfView tool which you can see in action with its videos, is pretty much just a viewer of the ETW data you can get at with this library.
You get started by creating a console application in Visual Studio. Specifically
- Select File -> New -> Project. This brings up a project creation dialog
- Select Templates -> Visual C# -> Windows in the left pane and 'Console Application in the main pane.
- If you wish to change its name, feel free to do so in the dialog boxes at the bottom, then Click OK.
This will make a new project with an empty 'Main' program. Now add the TraceEvent Samples Nuget package by doing the following
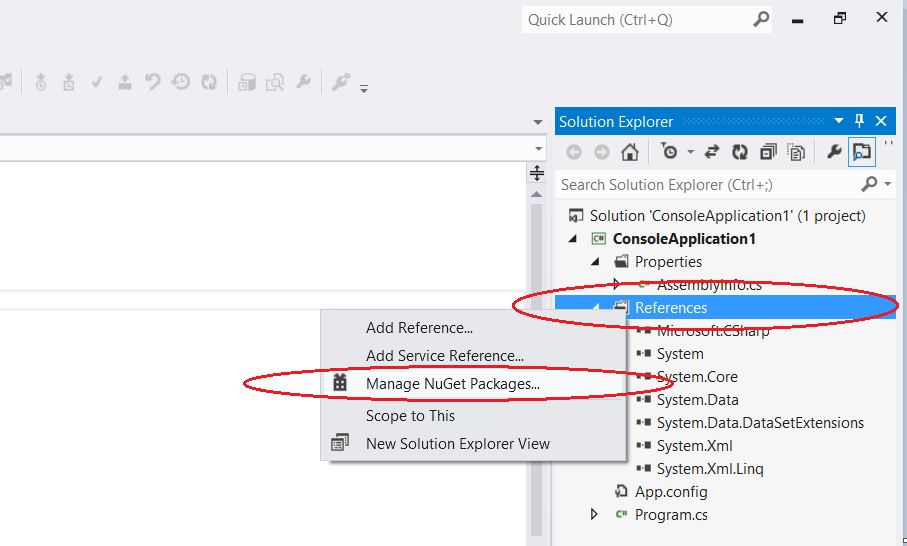
- Right click on the 'References' node in the Solution Explore Pane on the right.
- Select the 'Managed NuGet Packages
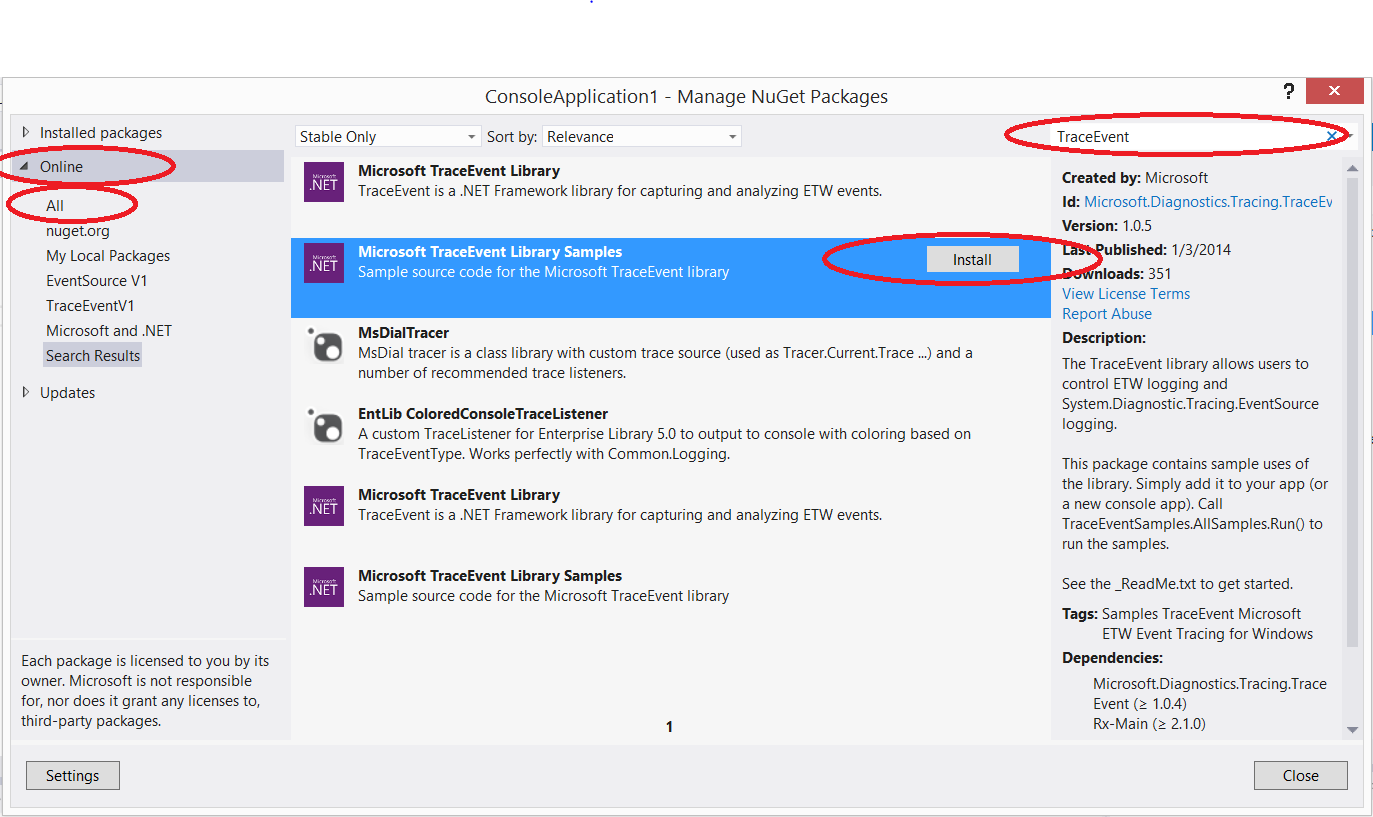
This brings up the Nuget Package manager.
- Make sure that the 'All' selection under 'Online' is selected on the left.
- Then type 'TraceEvent' in the search box in the upper right corner. This finds all packages with 'TraceEvent in them.
- Find the Microsoft TraceEvent Library Samples package and click the 'Install' button. This will cause VS to figure out all the other Nuget Packages you need (the samples need the TraceEvent package as well as the 'RX' packages because it shows off those capabilities as well. It will bring up a dialog box to accept the license. It is a standard, generous license.
- Click the 'Accpept' button to accept the license and continue.
You have now downloaded the necessary software into your test application. Note that this does not actually install anything in a normal sense. It simply downloads this package and makes it part of the current project. Your console application now has a reference to the Microsoft.Diagnostics.Tracing.TraceEvent.dll which is the TraceEvent library. One of the cool parts of Nuget is how easy it is to UNINSTALL as well as install. If you go back to the Nuget package manager, select 'Installed Packages' in the left pane you will see all your installed packages (for this project only. Every project is independent), and you can click 'Uninstall' on any of them and it will remove what you have installed. It will NOT remove anything you modified but otherwise it does a good job putting things back they way they were. Try it and see!
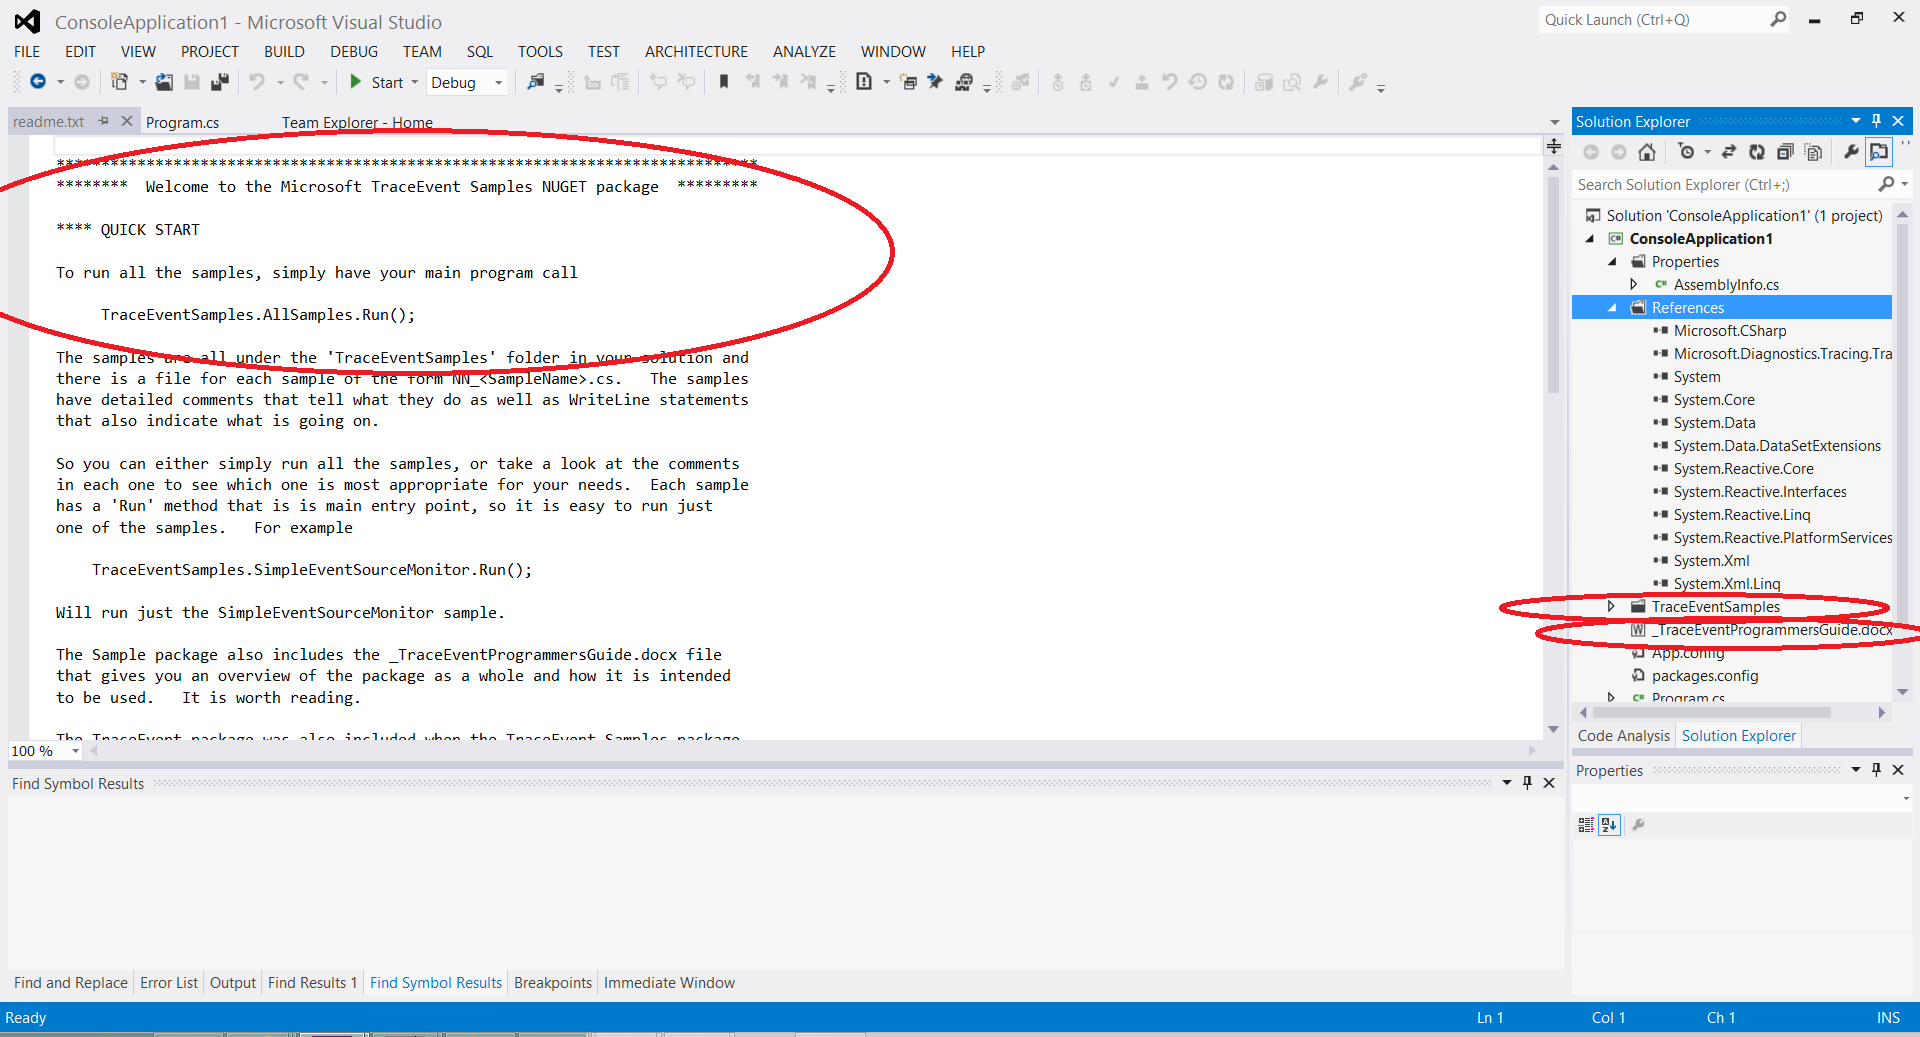
Anyway at this point our console application has downloaded and set up the references, but you application has not actually changed. It has however popped up a readme associated with the package so your screen should look something like this
From here we are simply following the README instructions. Things to note (also pointed out in the readme) is that all the sample code is under the 'TraceEventSamples' directory, and that there is a programmers guide that is also include that you can look at (note that in the future this may move directly to the web and not be in the package). All we need to do now is
- Add the 'TraceEventSamples.AllSamples.Run();' line to the main program (like it says to do in the README).
We now have a complete program. You can run it simply by hitting F5 (GO). There are 8 or so different samples and the 'AllSamples.Run' runs them all in sequence (with a Breakpoint between them). The samples include
- Real Time monitoring of ETW data
- Logging ETW data to a file
- Reading ETW data from a file
- Generating and Reading your own events using EventSource and TraceEvent (EventSource comes with V4.5 of the .NET Runtime, or you can get the Nuget package for it if you need it to run on older runtimes).
- Real time monitoring using the 'Reactive Extensions (RX) to process the events.
- Getting stack traces from the ETW events you logged
Each of the samples is heavily commented with design guidance. They are worth a read, and they will likely serve as the 'kernels' of your own logging projects.
Note that the Object Browser and Intellisense works. In particular if you do File -> View -> Object Browser you will see all the Microsoft.Diagnostics.Tracing.TraceEvent assembly and you can browse the classes and methods on it and read the documentation that comes with the classes. After you have gotten your initial bearings using the sample applications and read the programmers guide, browsing this is the way to learn more.
So there you have it. After you have does your experimentation, you probably want to cut and paste any code you created into a new project that represents the application you REALLY wanted to build,refer to the TraceEvent NuGet Package for that application. (you no longer need the samples). As far as deployment goes, like all Nuget packages, TraceEvent is simply a set of DLLs that get put into the output directory along the DLLs you authored explicitly. They are not special at this point. Along with Microsoft.Diagnostics.Tracing.TraceEvent there is also a couple unmanaged DLLs that does native code symbol lookup (msdia120.dll) and starting kernel mode session on pre Win8 OSs (KernelTraceControl.dll). If you don't look up native code symbols (only the 'Stacks sample does this), and don't turn on kernel mode ETW (that is you are not using EnableKernelProvider API OR you don't care that it does not work on Win7) than you don't need these DLLs.
Happy Eventing! Now go write some code....
Vance
Comments
Anonymous
April 10, 2014
These are excellent samples! Is there a way to lookup symbols without using a TraceModuleFile? What I really want to do is lookup the symbols for the SysCallAddress values observed during a live kernel trace session.Anonymous
April 10, 2014
Today we don't support stack resolution on real time sessions. It is a requested item and we may have some support soon (but no promises). When this is added you will still use TraceModuleFile, it is just that a TraceLog class (and its friends like TraceModuleFile), will work on real time sessions.Anonymous
April 10, 2014
Thank you for the update. I will have to find another way to do the name resolution for now, but will keep an eye out for any updates.Anonymous
May 08, 2014
Excellent blog !! I was trying to implement the same in Windows 8 store apps, but Event tracing Library seems to unsupport these type of application. Any suggestion/help would be very helpful for me.Anonymous
May 08, 2014
As you discovered, the TraceEvent package will not work for Windows Store apps because of API restrictions associated with windows Store apps.Anonymous
May 15, 2014
I am using TraceEventSession and ETWTraceEventSource to setup a session that consumes a event source. I am able to get some events but not all (e.g. I got event ID 2 and never get event ID 1). I used event viewer and perfview to verify that both types of events were fired. What kind of debug technique do you recommend to figure out root cause?Anonymous
May 15, 2014
I start with first checking if the events are firing in your ETWTraceEventSource by subscribing to the 'EtwTraceEventSource.AllEvents or EtwTraceEventSource.UnhandledEvents. Your events should show up there, even if they are not parsed. Look at them to see how much they are parsed. I assume you are using DynamicTraceEventParser to subscribe to the events using the 'All' event. It is very surprising that one event works and the other does not (usually it is all or nothing for a given provider).Anonymous
November 19, 2014
Thanks for all the documentation and help ... still a few areas I'm confused on ... maybe one day this will get open sourced and we can get more community support which would be interesting as I'd like to see semantic logging take off a bit more. I do have a question related to how the "don't re-send the same manifest" filtering is done for DynamicTraceEventParser.DynamicProviderAdded ... in my case it often doesn't send a changed manifest. Perhaps my idea of "Changed" is not the same as yours. I'm tempted to call it a bug since I don't get a changed manifest when I for instance increase an Event ID which is pretty well encouraged behavior. I'll try to reach out on NuGet as well since I'm not sure who else might have an answer. Thanks again!Anonymous
November 20, 2014
Regarding my previous question ... got a response from Vance (thanks Vance!) ... actually the topic is well covered in his TraceEvent Programmers Guide. The basic answer is to use the "Version" property of the Event Attribute (which I had not really paid attention to before). Additional versioning advice for EventSource is to only add new data at the end of the list (after existing data).Anonymous
November 20, 2014
I was looking to understand the capabilities of the AspNetTraceEventParser that comes with the TraceEvent nuget package. Is there any available documentation that clarifies what each event is for, when is it triggered, and how do they correspond to processing happening inside of ASP.NET MVC or ASP.NET Web API (e.g. controller/action selection).Anonymous
December 21, 2014
Awesome blog! Thank you for the post this blog.Anonymous
January 05, 2015
Great library! But is it possible to a stack deeper to a pure IP packet and not at UDP/TCP level? I found no event to get that :/Anonymous
January 05, 2015
The comment has been removedAnonymous
March 25, 2015
I created a new Console Application and installed the nuget package Microsoft TraceEvent Library Samples according to your instructions. However I get compiler errors since the ZippedETLReader and ZippedETLWriter classes cannot be found. Where are those defined?Anonymous
March 26, 2015
I was able to repro your problem. The basic problem is that the current samples package (v1.0.25 is referencing an old version of the TraceEvent package (1.0.21). I will fix that, however in the mean time you can simply install the TraceEvent Package explicitly, and that will cause your solution to upgrade it to V1.0.25 which will fix the problem.Anonymous
March 26, 2015
Version 1.0.26 fixes the issue Patrick reported above.Anonymous
March 31, 2015
Thanks for Version 1.0.26 of the samples. Works fine now.Anonymous
May 20, 2015
The comment has been removedAnonymous
May 20, 2015
@Trevor RegisteredTraceEventParser does have support for parsing enums (Maps and bitmaps). You do have to use the PayloadValueString to get the parsed enum value. PerfView does this so the fact that PerfView is not showing your enums suggests that something is wrong with your manifest. You may wish to look at the data using TraceRPT or WPR/WPA (which don't use TraceEvent) and if they also don't show it, that is more evidence that there is something amiss in the manifest. You may wish to use an EvnentSource with a enum being passed and then look at its manifest and do binary searching changing your manifest to be more like the one from the EventSource until you find what makes it work.Anonymous
May 20, 2015
@Vance Thanks for the quick feedback and debugging tips. I'll dig into it further. Knowing what is expected is very helpful. I appreciate the support.Anonymous
May 21, 2015
@Vance I've tried a number of your suggestions and the problem seems to be with TraceEvent (or at least my use of it) rather than my manifest. When I run my test executable and collect events using TraceRPT, I see the string substitution performed within the <RenderingInfo><Message> element of the event in the resulting dumpfile. However, PerfView does not show this information, the TraceEvent.PayloadString() method returns the integer value, and the TraceEvent.FormattedMessage contains the integer value. I also tried creating an equivalent provider in C# using EventSource. This works as expected, so I tried extracting the manifest as you suggested. As far as I can tell, the two manifests are pretty much identical. The only real difference that I can find between the two binaries is that the C# provider is a dynamic provider whereas the C++ provider is a registered provider. I tossed the code that I've been testing into a BitBucket repo at bitbucket.org/.../etwmap_test. I'm not asking you to debug my code or anything. I just figured that it might be useful for you if you decide to look into the behavior. At any rate, thank you for the support and for putting out TraceEvent and the TraceEvent samples. With the exception of this issue, they have made working with ETW much simpler.Anonymous
May 21, 2015
@Trevor. I took a look, and I now see that TraceEvent currently does not support maps in Registered ETW maps (there is support for dynamic events, and some other scenarios but not that one). I have a change that fixes it in the case where you not operating on a 'merged' ETW trace (merged traces embed this kind of information in yet another way). I should have complete fix reasonably soon. Ping me at vancem@microsoft.com if I have not posted something to Nuget by the end of next week.Anonymous
May 21, 2015
@Vance, Thanks for looking into it further. I appreciate you taking the time, and I'm glad you were able to figure out what is going on. It's also good to hear that it's not just me. :-) I'll keep an eye out for the fix in NuGet. There's no rush from our perspective as we can live with it as-is for the time being. It will be a nice feature to have, though, and will make our log output more readable.Anonymous
May 25, 2015
@Trevor. I have checked in a fix for this, however, there are some integrations / tests needed to get it to the branch that NuGet is published from. ETA is still the end of this weekAnonymous
May 25, 2015
@Vance. Sounds good. Thanks for the update.Anonymous
July 14, 2015
I am trying to use the NuGet package: EventRegister to build the manifest info for my C# application. Is this the best place to post questions on that?Anonymous
July 15, 2015
Asking the question here will work. What is your question?Anonymous
July 15, 2015
The comment has been removedAnonymous
July 16, 2015
@Mark. The EventRegister that comes with the Nuget package is looking for Nuget version of EventSource and you are using the Framework version (System.Diagnostics.Tracing.EventSource). Note that if all you want to do is dump the EventSource's manifest that is pretty much what EventSource.GenerateManifest does. VanceAnonymous
July 16, 2015
Thanks, Note that the Users guide in the Nuget package states it works with both versions of EventSource.Anonymous
July 16, 2015
I had a separate ETW question.. I have a C# app that is creating ETW events, and I have set it up to have tracing enabled via the autologger registry keys so it generates a .etl file (circular, fixed buffer), as this binary can be doing stuff before user login. What's the best way to properly extract/convert the etl file to readable data... for C++ apps I have the tmf file, but for C# I don't.. just a manifest file I create by using reflection on the built binary to call GenerateManifest(). Thanks, MarkAnonymous
July 16, 2015
It is unclear if you are asking for tools or for APIs. IF you want tools, both PerfView and WPA already understand EvenSources and will nicely format their output. If you want APIs, you can either use the TraceEvent Nuget Package (if you are programming in .NET), or you can use the OS TDH APIs using the TdhLoadManifest on the manifest file if you are working in C/C++.


