本文說明如何在 Azure App Service 中排除應用程式問題。 當您執行 Web 應用程式時,想要針對可能發生的任何問題做好準備。 這類問題的範圍可能從 HTTP 500 錯誤到您的使用者通知您網站停運不等。
Azure App Service 診斷是一種互動式體驗,幫助您輕鬆排除應用程式的故障,無需設定。 App Service診斷能指出問題所在,並引導你獲得正確資訊,讓你更容易且快速地解決問題與排除故障。
儘管這項功能對處理過去 24 小時內發生的問題最有幫助,但所有診斷圖表始終可供您分析。
App Service 診斷不僅支援 Windows 上的應用程式,也支援在內建或自訂容器上的應用程式,以及 App Service Environments 和 Azure Functions。
開啟 App Service 診斷的步驟
要存取 App Service 診斷:
在 Azure 入口網站中,瀏覽至您的 App Service Web 應用程式或 App Service 環境。
在側欄選單上,選取 診斷並解決問題。


App Service 診斷頁面提供多種診斷應用程式問題的工具。 如需詳細資訊,請參閱本文稍後的 診斷工具 。
附註
如果你的應用程式當機或效能緩慢,你可以收集分析追蹤來找出問題的根本原因。 分析是專為生產案例設計的輕量型功能。
診斷介面
App Service診斷頁面在多個區塊中提供簡化的診斷存取。
搜尋方塊
搜尋方塊是尋找診斷的快速方法。 您可以透過 疑難解答類別找到相同的診斷。

風險警示
App Service 診斷頁面會執行一系列設定檢查,並根據你應用程式的獨特設定提供建議。
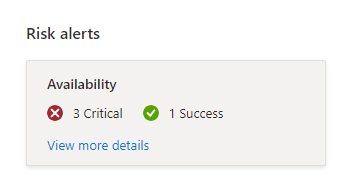
若要檢閱建議並執行檢查,請選取 [ 檢視更多詳細數據] 連結。 資訊會出現在視窗右側的面板中。

疑難排解類別
診斷會分組為疑難解答類別,以方便探索。 下列類別可供使用:
- 可用性和效能
- 設定和管理
- SSL 和網域
- 風險評估
- 部署
- 聯網
- 航海家
- 診斷工具
- 負載測試您的應用程式
磁磚顯示每個類別的可用診斷。 如果您選取 [可用性和效能],側邊欄功能表上提供下列診斷:
- 概述
- 應用程式關閉工作流程
- Web 應用程式關閉
- 應用程式記錄
- CPU 使用量
- 記憶體使用量
- Web 應用程式疑難解答員
- 應用程式變更
- Linux - 執行中的容器數目
- Linux 交換空間不足
- 填寫過程清單
- 進程清單
- SNAT 連接埠用盡
- TCP 連線
- 在生產環境中進行測試
診斷報告
若要進一步調查問題,您可以選取主題,並在診斷報告中檢視更多詳細數據。 這些詳細數據通常會用圖表來補充。
診斷報告可以是一個功能強大的工具,可用來找出應用程式的問題。 下列範例是可用性和效能中的 Web 應用程式關閉報告。

調查應用程式程式代碼問題 (僅限 Windows 應用程式)
由於許多應用程式問題與應用程式程式碼相關,App Service 診斷會整合 Application Insights,以突顯例外與相依性問題,與所選停機時間相符。 您可以個別啟用 Application Insights。
若要檢視 Application Insights 例外狀況和相依性,請選取 [Web 應用程式向下 ] 或 [ Web 應用程式慢速 ] 圖格快捷方式。
疑難排解步驟
如果在過去 24 小時內在特定類別中偵測到問題,您可以檢視完整的診斷報告。 App Service 診斷可能會提示您查看更多故障排除建議及後續步驟,以獲得更有指導性的體驗。

診斷工具
App Service 包含先進的診斷工具,幫助你調查應用程式代碼問題、速度緩慢、連線字串等問題。 它也包含主動式工具,可協助您降低CPU使用量、要求和記憶體的問題。
主動式 CPU 監視 (僅限 Windows 應用程式)
主動式 CPU 監視可協助您在您的應用程式或子進程耗用高 CPU 資源時採取動作。 您可以設定自己的CPU閾值規則,以暫時降低非預期的高CPU,直到找到真正的原因為止。 更多資訊請參閱部落格文章在問題發生前減輕您的 CPU 問題。
自動修復
自動修復是一種緩和動作,您可以在應用程式有非預期的行為時採取。 您可以根據要求計數、慢速要求、記憶體限制和 HTTP 狀態碼來設定自己的規則,以觸發風險降低動作。 使用工具來暫時減輕非預期的行為,直到您找到根本原因為止。
目前該工具可用於 Windows web apps、Linux web apps 以及 Linux 自訂容器。 支援的條件和風險降低會根據 Web 應用程式的類型而有所不同。 欲了解更多資訊,請參閱部落格文章宣布在 App Service Diagnostics 中的新自動修復體驗以及宣布適用於 Linux 的自動修復。
主動式自動修復 (僅限 Windows 應用程式)
如同主動式 CPU 監視,主動式自動修復是減輕應用程式中非預期行為的周全解決方案。 當 App Service 判定你的應用程式處於無法恢復的狀態時,主動自動修復會重新啟動你的應用程式。 欲了解更多資訊,請參閱部落格文章Introducing Proactive Auto Heal。
導覽器 (僅限 Windows 應用程式)
在具有持續整合和許多應用程式相依性的大型小組中,很難找出導致狀況不良行為的特定變更。 導航工具幫助您更清晰地了解應用程式的拓撲結構,並自動生成應用程式及所有資源的相依性地圖於相同的訂用帳戶中。
導覽器可讓您檢視應用程式及其相依性所做的變更合併清單。 然後,您可以縮小造成不正常行為的變更範圍。 你可以透過頁面上的Navigator圖塊來存取此功能,進行 App Service 診斷。 您必須先啟用此功能,才能使用此功能。 欲了解更多資訊,請參閱部落格文章 用 Navigator 了解你的應用程式相依關係。
變更分析
你可以透過 Availability and Performance 中的磁磚捷徑 Application Changes 和 Application Crashes 來進行應用程式變更的分析。 您可以搭配其他計量同時使用變更分析。 使用此功能之前,您必須先啟用此功能。 欲了解更多資訊,請參閱部落格文章在App Service Diagnostics中宣布新的變革分析體驗。
問題或意見反應
請將您的問題或反饋發布到分享你的想法,並在標題中加上[Diag]。