這很重要
AKS 預覽功能可透過自助服務,以加入方式使用。 預覽是「依現況」及「可用時」提供的,並不包括在服務等級協定和有限保固之內。 客戶支援部門會盡最大努力,部分支援 AKS 預覽。 因此,這些功能不適合實際執行用途。 如需詳細資訊,請參閱下列支援文章:
Azure Kubernetes Application Network 透過 Azure Monitor 指標,提供完整的工作負載及 Azure Kubernetes 應用網路資料平面元件(ZTunnel、Istio CNI 和 Waypoint)的衡量標準。 本文說明如何在 Azure Monitor 中設定及查看這些指標。
局限性
目前不支援控制平面的指標。 不過,資料平面指標是可用的,你可以用它們來監控工作負載和 Azure Kubernetes 應用網路元件的健康狀況與效能。
資料平面指標
資料平面的指標包括你的工作負載/應用程式和命名空間的 appnet-system 指標。 Azure Kubernetes Application Network 目前僅支援 資料平面指標。
設定資料平面度量
資料平面計量指標的工作區設定選項
當你啟用 Azure Kubernetes Application Network 成員叢集的 Prometheus 指標收集時,你可以有以下工作空間設定選項:
- 使用現有的 Azure Monitor 工作空間。
- 省略工作區資源 ID,並使用針對您的資源群組所建立的預設工作區。
- 建立一個新的 Azure Monitor 工作區。
啟用資料平面指標收集
在你的 Azure Kubernetes Application Network 成員叢集上,使用
az aks update指令啟用 Prometheus 指標收集,並將--azure-monitor-workspace-resource-id參數設定為你現有的工作區 ID。 如果你的成員叢集已經啟用 Azure Monitor Metrics,你可以直接跳到下一步。az aks update --enable-azure-monitor-metrics \ --name $CLUSTER_NAME \ --resource-group $AKS_RG \ --azure-monitor-workspace-resource-id $WORKSPACE_ID在
kube-system命名空間中使用kubectl apply命令建立並套用以下的 ConfigMap。 這個 ConfigMap 可以抓取 Ztunnel、Istio CNI、waypoint 和您的應用程式/工作負載。kubectl apply -f - <<EOF kind: ConfigMap apiVersion: v1 metadata: name: ama-metrics-settings-configmap namespace: kube-system data: schema-version: v1 config-version: ver1 prometheus-collector-settings: |- cluster_alias = "" https_config = true default-scrape-settings-enabled: |- ztunnel = true istio-cni = true pod-annotation-based-scraping: |- podannotationnamespaceregex = ".*" default-targets-metrics-keep-list: |- ztunnel = "" istio-cni = "" minimalingestionprofile = true default-targets-scrape-interval-settings: |- ztunnel = "30s" istio-cni = "30s" podannotations = "30s" debug-mode: |- enabled = false EOF在你想抓取的應用程式 Pods 上加上註解。
-
prometheus.io/scrape: "true"為必須,才能指出應抓取該 pod。 -
prometheus.io/path可選地用來指示指標所承載的路徑。 若省略,則預設為/metrics。 -
prometheus.io/port可選擇性地用來指示度量寄存的埠口。 若省略,Prometheus 會使用 pod 規範中容器已宣告的埠。 對於沒有宣告埠的容器,Prometheus 會建立一個無埠目標(僅限 IP),這需要適當的重新標籤設定才能與埠標註配合使用。 建議明確指定端口,以確保資料擷取的可靠性。
下列樣本會定義 Pod 的註釋,該 Pod 正在
<pod IP>:15020/metrics上託管計量指標。prometheus.io/scrape: "true" prometheus.io/port: "15020" prometheus.io/path: "/metrics"AMA 指標 ReplicaSet 載入此配置可能需要幾分鐘。
-
查看資料平面指標
在 Azure 入口網站中進入你的 Azure Monitor 工作區,使用 PromQL 查詢指標。
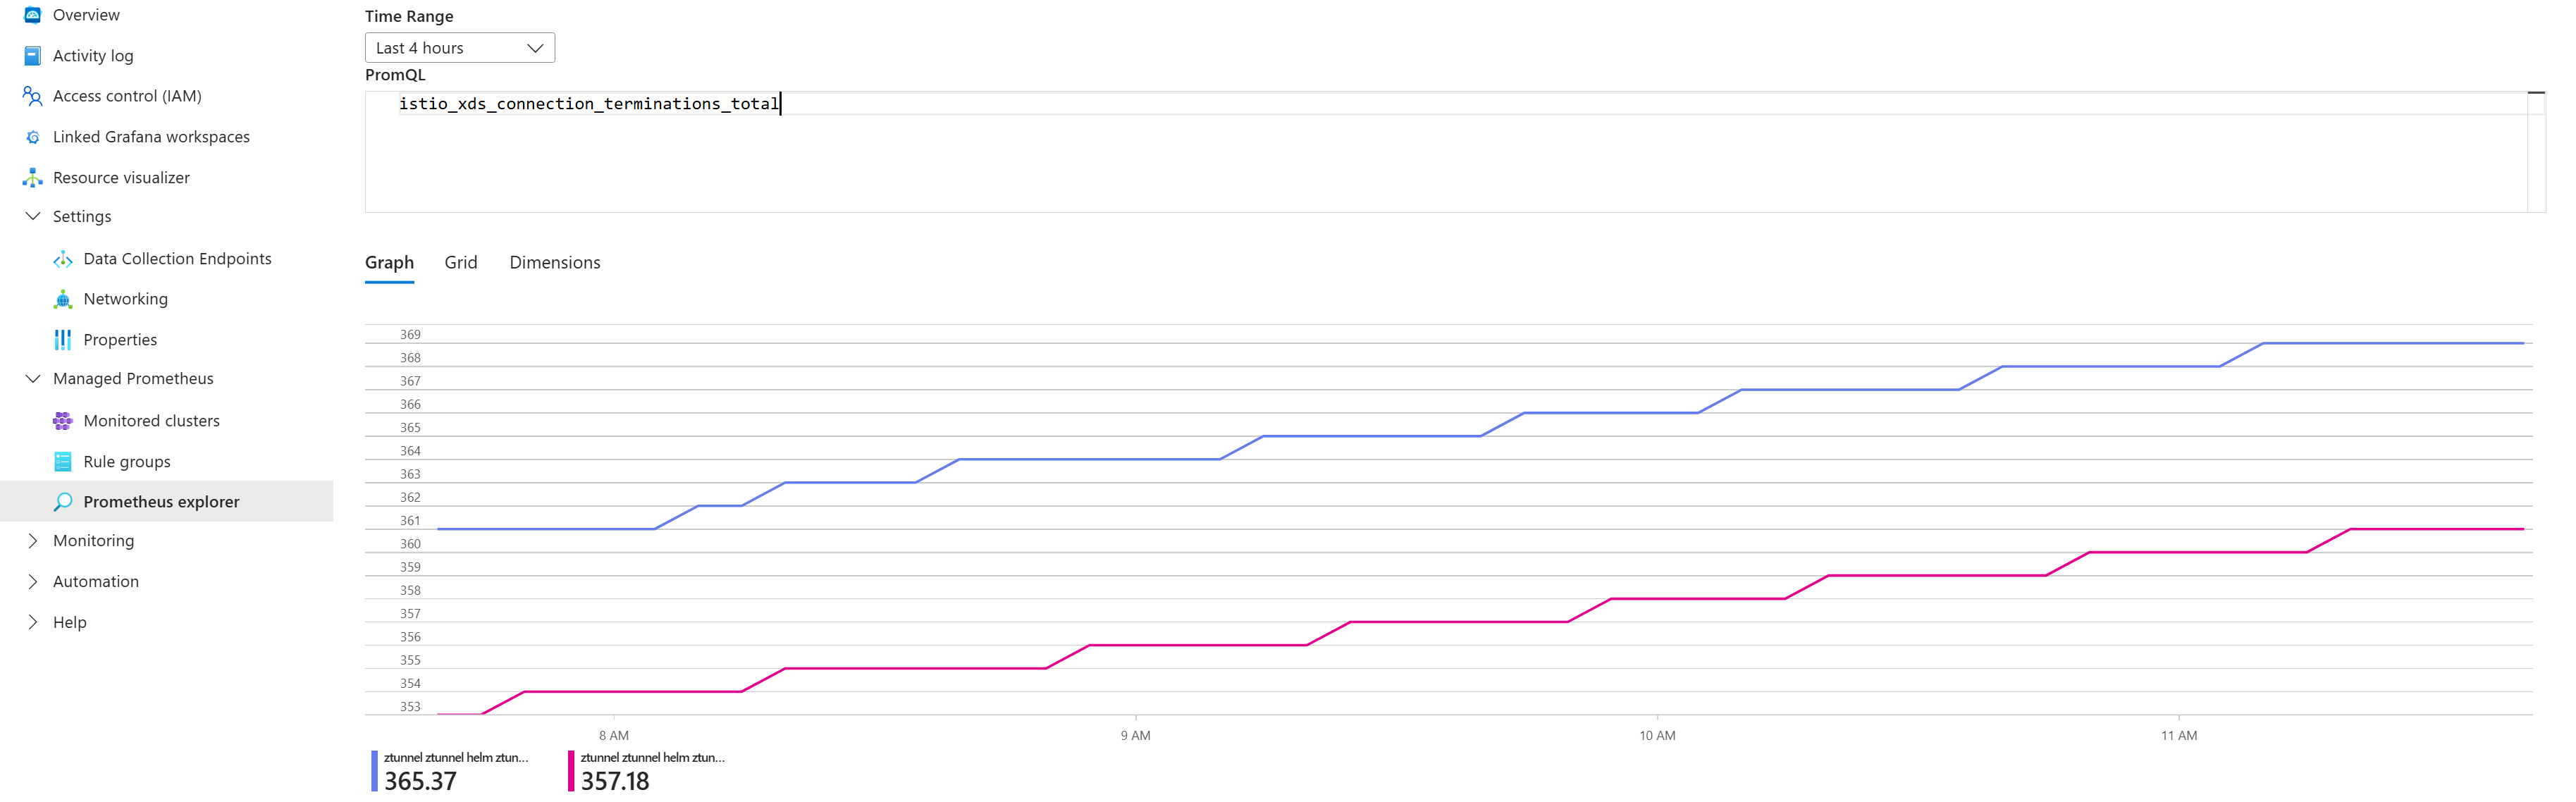
產生一些流量,然後從 暴露的指標 中選擇查詢來查看指標。 例如,你可以執行以下查詢,查看航點處理的請求總數:
# ztunnel
istio_xds_connection_terminations_total

# waypoint
istio_requests_total

# istio-cni
istio_cni_install_ready
以下截圖顯示範例查詢的結果:

公開指標列表
| 組件 | 公開的指標 |
|---|---|
| ZTunnel | istio_buildistio_xds_connection_terminations_totalistio_xds_message_totalistio_xds_message_bytes_totalistio_tcp_connections_opened_totalistio_tcp_connections_closed_totalistio_tcp_received_bytes_totalistio_tcp_sent_bytes_totalistio_on_demand_dnsistio_dns_requests_totalistio_dns_upstream_requestsistio_dns_upstream_failuresistio_dns_upstream_request_duration_secondsworkload_manager_active_proxy_countworkload_manager_pending_proxy_countworkload_manager_proxies_started_totalworkload_manager_proxies_stopped_total |
| Istio CNI | istio_cni_install_readyistio_cni_installs_totalnodeagent_reconcile_events_totalztunnel_connected |
| 航點 | istio_buildistio_request_bytes_bucketistio_request_bytes_countistio_request_bytes_sumistio_request_duration_milliseconds_bucketistio_request_duration_milliseconds_countistio_request_duration_milliseconds_sumistio_requests_totalistio_response_bytes_bucketistio_response_bytes_countistio_response_bytes_sum |
從途徑代理直接存取性能指標
除了 Istio 的請求/回應指標外,航點代理也會發出使者指標。
若要找到航點發出的完整指標清單,您可以將端口轉發至您的命名空間中的航點代理,然後使用以下指令列出這些指標:
# Port-forward to waypoint proxy
kubectl port-forward -n <namespace> deployment/waypoint 15020:15020 &

# List metrics exposed by waypoint
curl http://localhost:15020/stats/prometheus | grep -v '^#' | grep -v '^$' | awk -F'{' '{print $1}' | sort -u
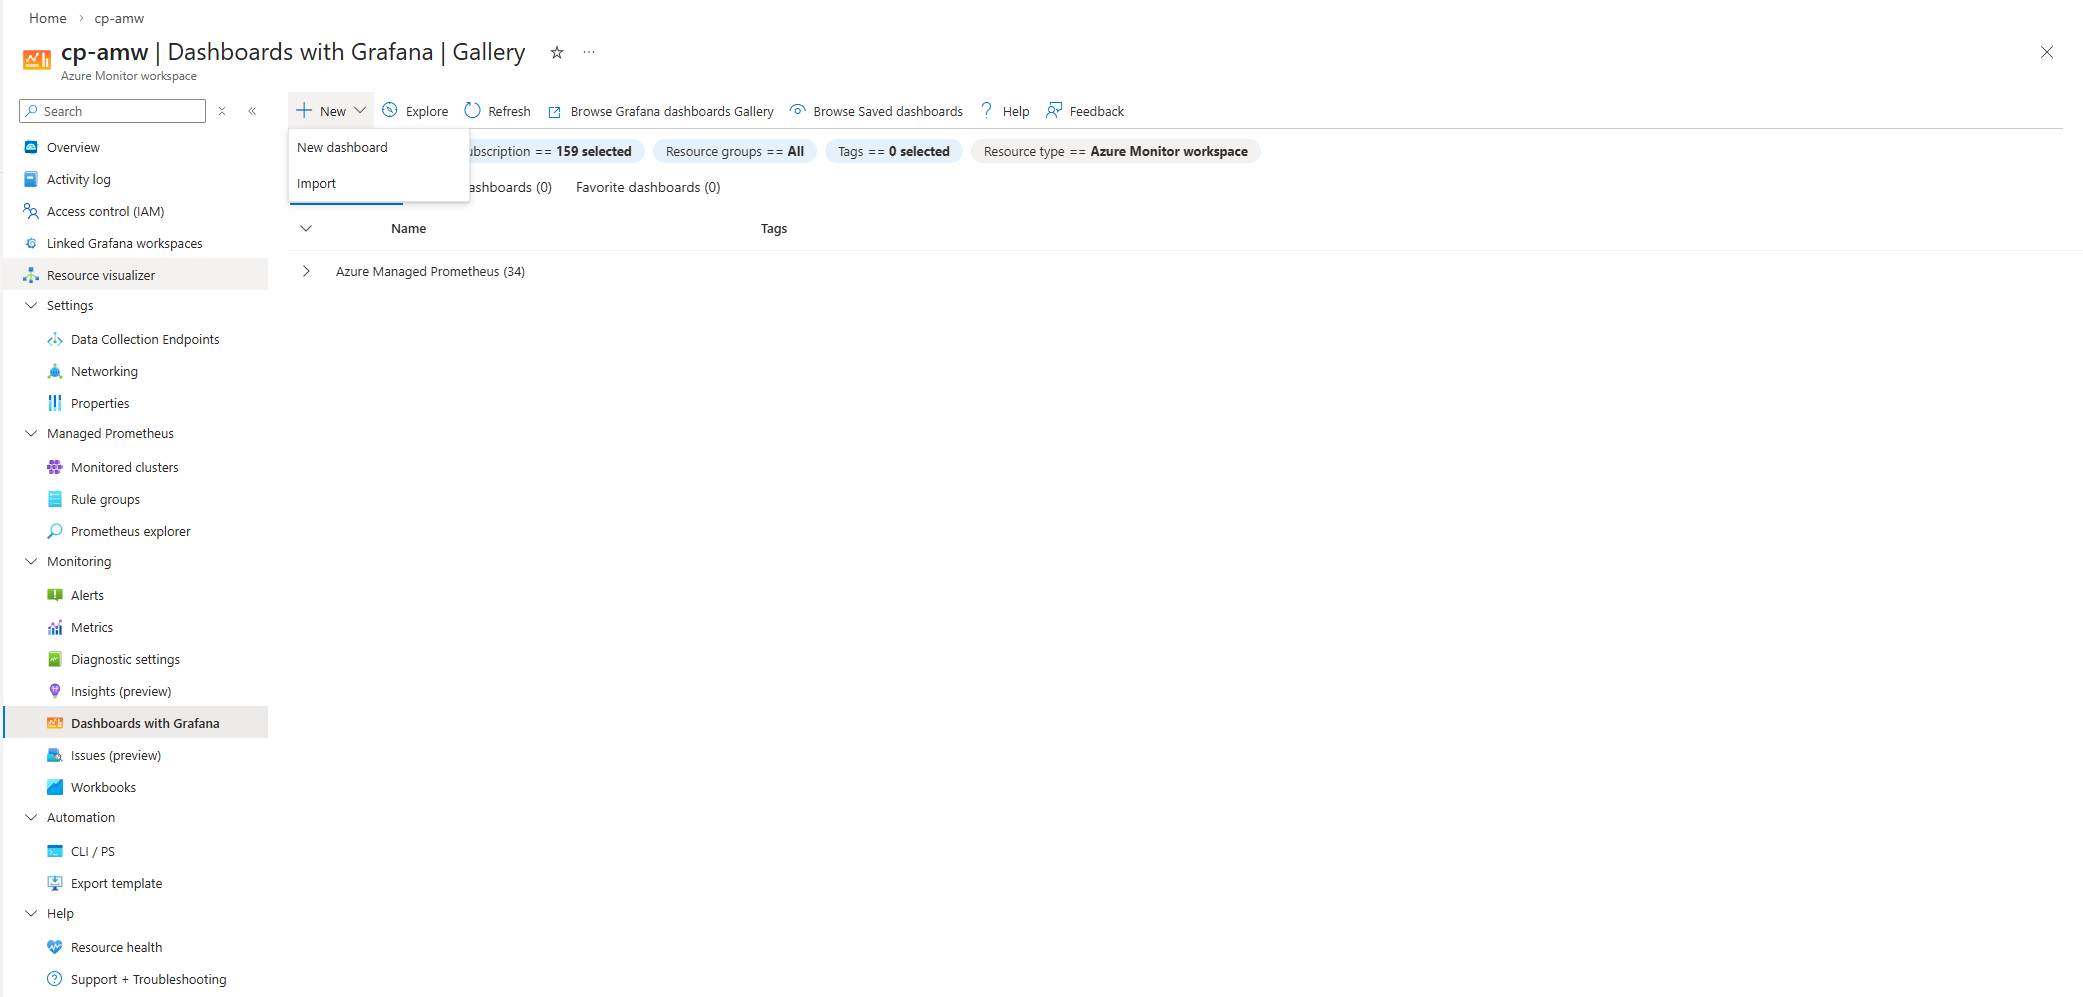
在 Azure 入口網站使用 Grafana 可視化指標
匯入 Istio 社群儀表板。
為你的成員叢集產生流量,然後在 Azure 入口網站中導航到 Azure Monitor 工作區。
選擇監控>使用 Grafana 的儀表板。
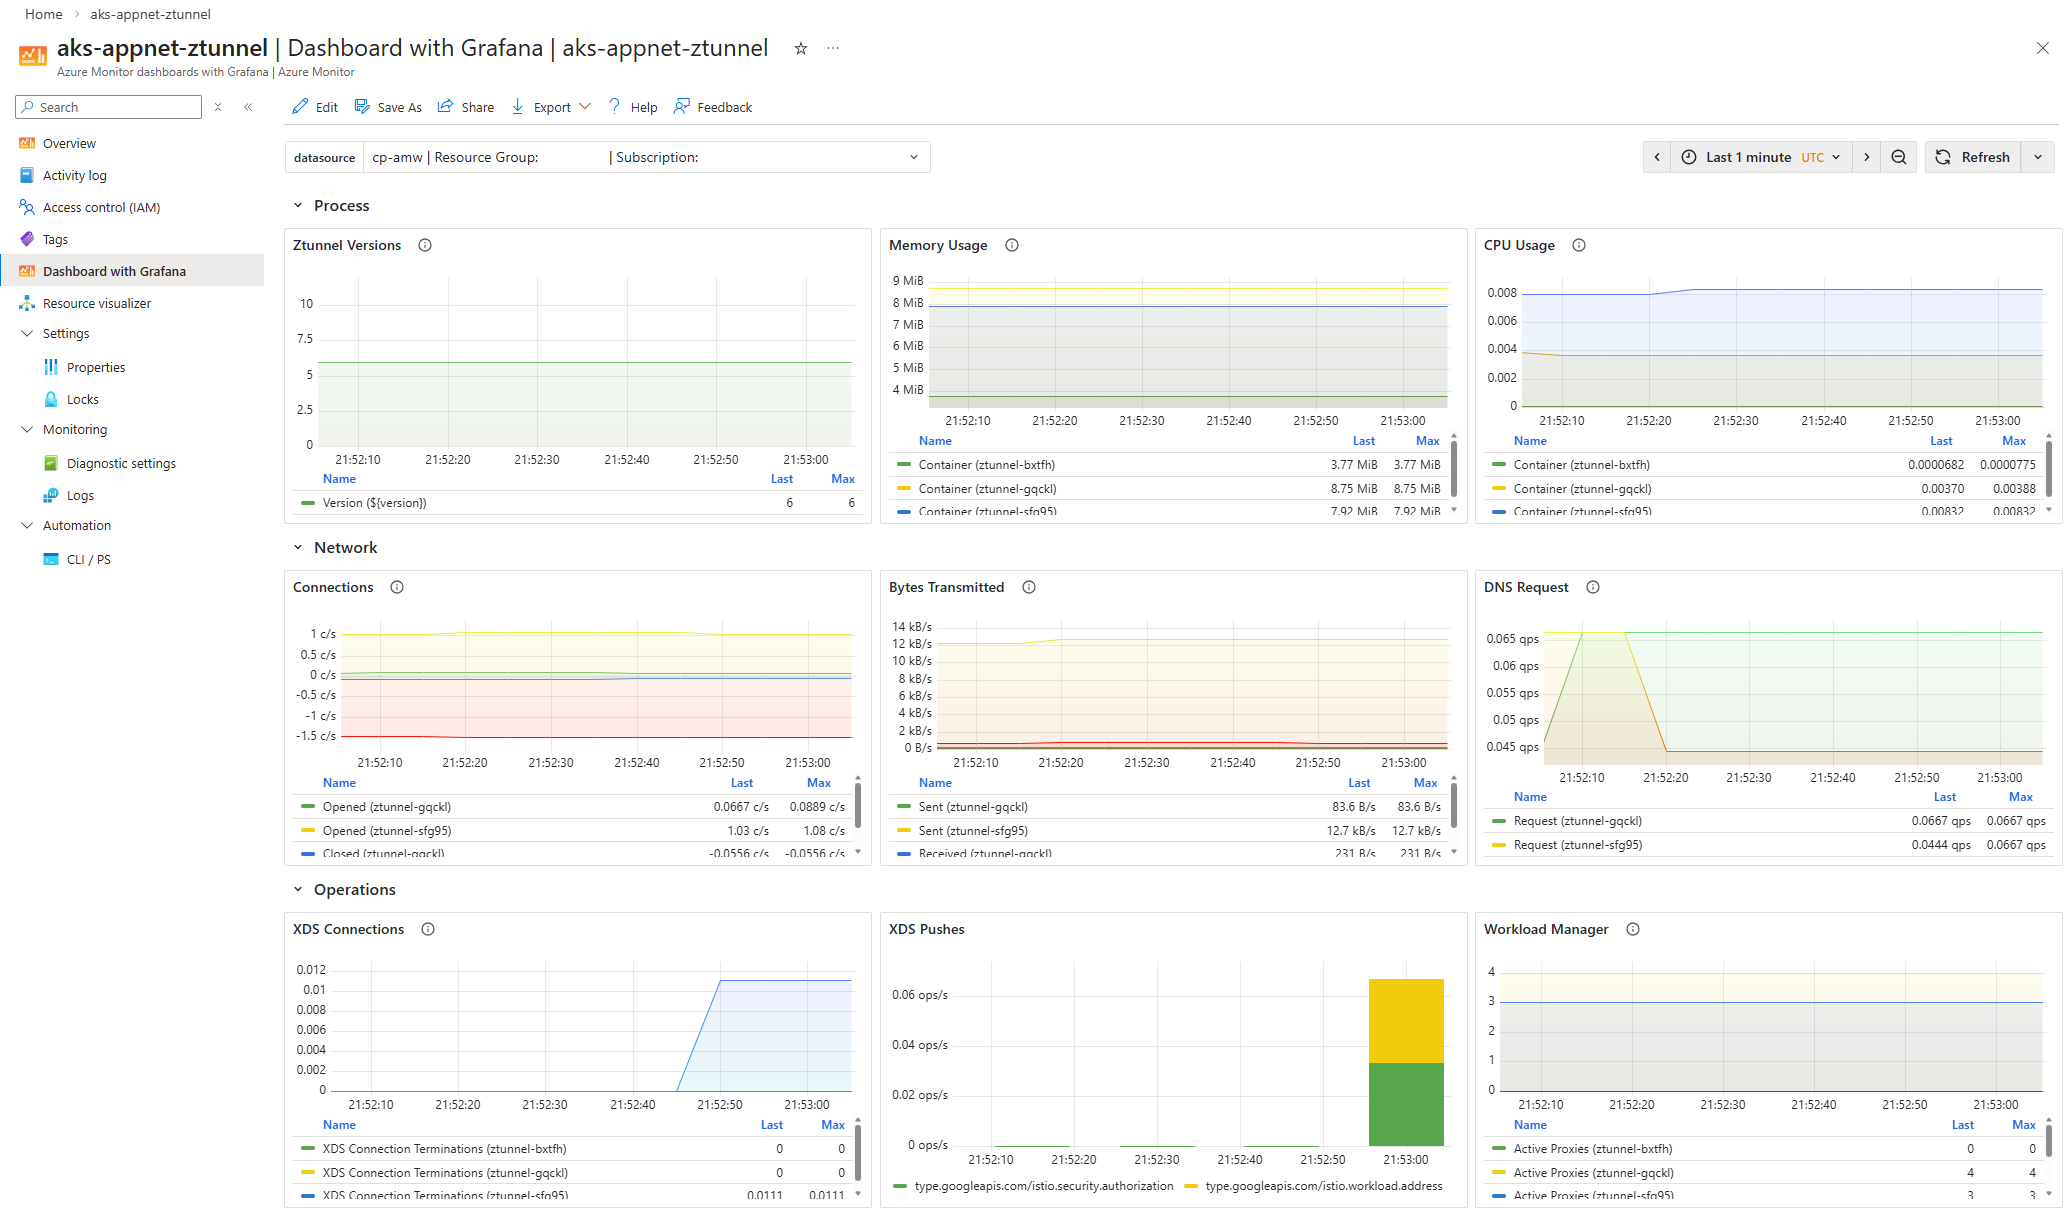
以下截圖展示了匯入 Istio Ztunnel 儀表板的範例:


如果你想用 Grafana 來設定 Azure Managed Grafana 取代 Dashboards,請參考 使用 Azure CLI 建立 Azure Managed Grafana 工作區。
相關內容
欲了解更多關於 Azure Kubernetes 應用網路可觀察性與監控的資訊,請參閱以下文章: