監視可讓您深入瞭解系統的行為和健康情況,並協助建置環境的整體檢視、歷史趨勢、相互關聯各種因素,以及測量效能、耗用量或錯誤率的變更。
Azure Functions提供與Application Insights的內建整合。 您可以從 Application Insights 取得資訊,例如函式應用程式實例數目或函式的要求和相依性遙測。 使用 Functions 和事件中樞時,Application Insights 也可以追蹤傳出相依性遙測至事件中樞,計算佇列中花費的時間,並顯示透過事件中樞連線之系統的端對端流程。
本節介紹您可以從 Application Insights 取得的實用功能和深入解析,以取得事件中樞加上 Functions 解決方案。
應用程式對應
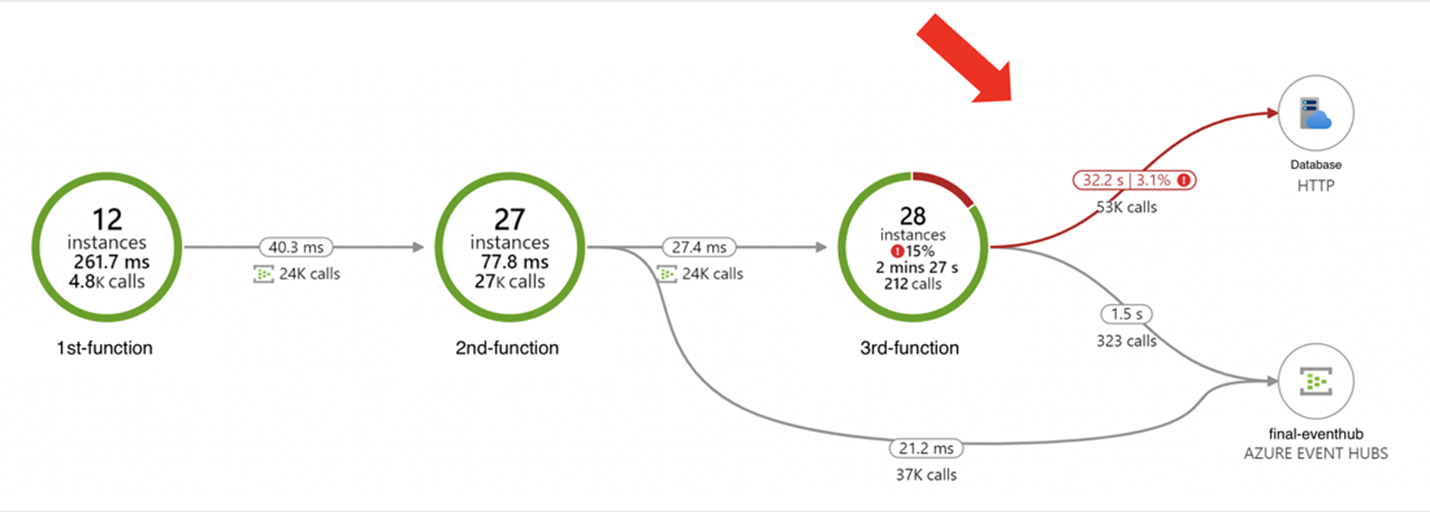
應用程式對應 顯示系統中的元件如何彼此互動。 由於 Application Insights 提供的相依性遙測,它會對應Azure Functions與事件中樞之間的事件流程,包括事件中樞中每個函式執行的平均和事件的平均持續時間,以及顯示包含以紅色標示失敗的交易。
將預期的負載傳送至您的系統之後,您可以在Azure 入口網站中移至 Application Insights,然後在提要欄位上選擇[應用程式對應]。 以下是一個地圖,其中顯示三個函式、三個事件中樞,以及寫入下游資料庫時明顯的失敗:
端對端交易詳細資料
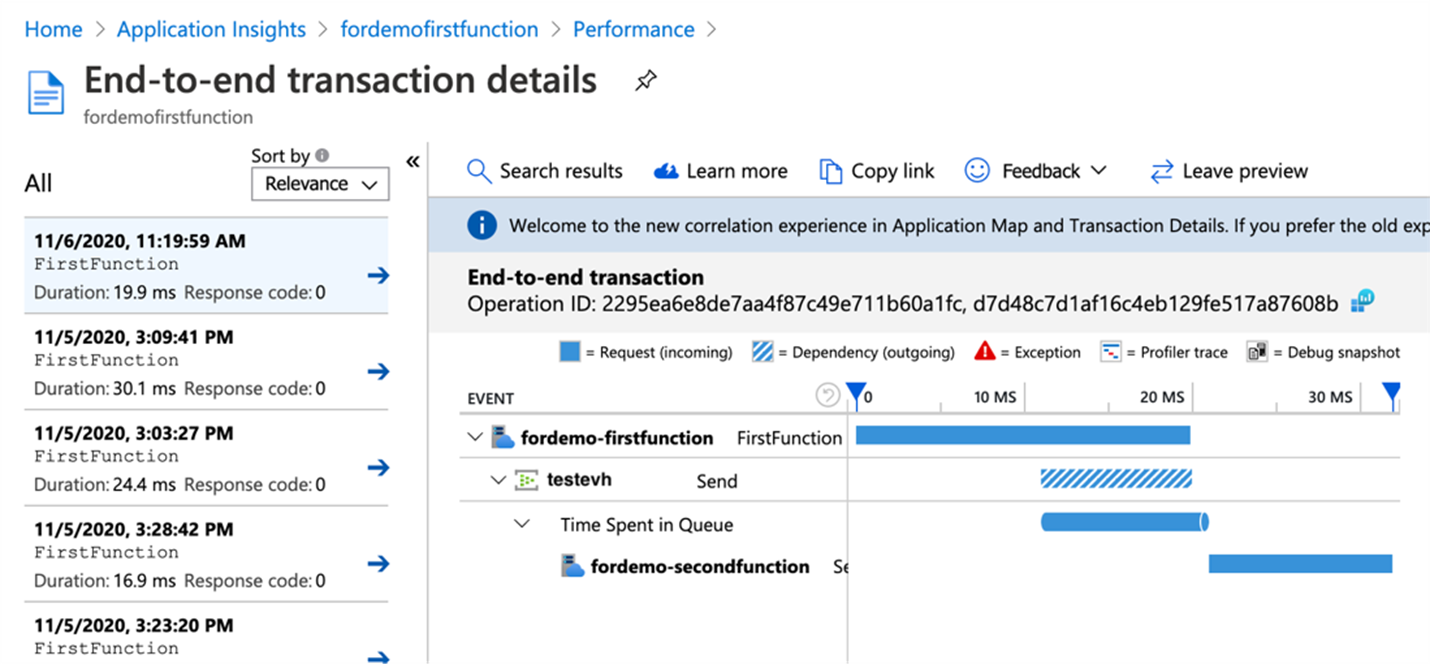
端對端交易詳細資料會依時間順序顯示系統元件彼此互動的方式。 此檢視也會顯示事件花費在佇列中的時間長度。 您也可以從此檢視鑽研每個元件的遙測資料,這樣可讓您在發生問題時,更輕鬆地針對相同要求內的元件進行疑難排解。
平臺計量和遙測
適用于事件中樞和Azure Functions的 Azure 監視器中平臺產生的計量可用於解決方案行為和健康情況的整體監視:
Azure 監視器中的Azure 事件中樞計量對於事件中樞 (擷取有用的見解,例如傳入要求匯總、傳出要求、節流要求、成功要求、傳入訊息、傳出訊息、擷取的訊息、傳入位元組、傳出位元組、擷取的位元組、使用者錯誤) 。
Azure Functions計量會共用Azure App 服務的許多計量,以及新增函式執行計數和函式執行單位,可用來瞭解使用量計畫的使用率和成本。 其他感興趣的計量包括連線、資料輸入、資料輸出、平均記憶體工作集、執行緒計數、要求和回應時間。
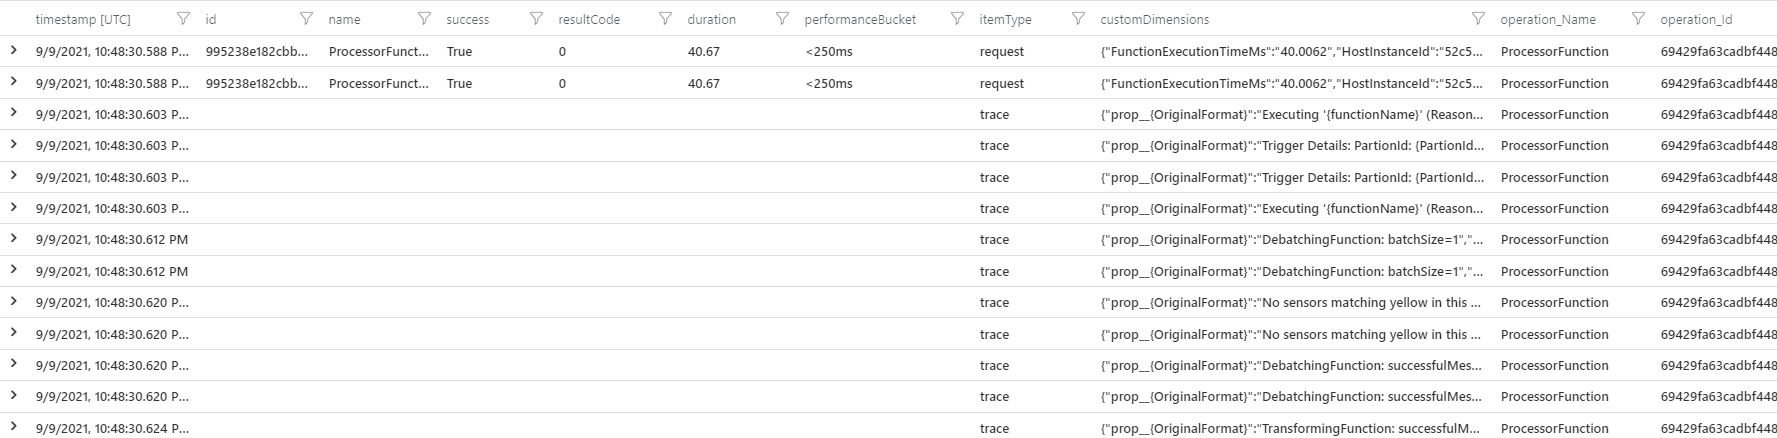
Azure Functions與 Application Insights 整合,以提供函式主機和函式執行的進階和詳細遙測和深入解析。 若要深入瞭解,請參閱在 Application Insights 中分析Azure Functions遙測。 使用 Application Insights 監視拓撲時,有各種可用的設定。 若要深入了解,請參閱如何設定 Azure Functions 的監視。
以下是 追蹤資料表中 產生的事件中樞觸發函式的額外遙測範例:
Trigger Details: PartionId: 6, Offset: 3985758552064-3985758624640, EnqueueTimeUtc: 2022-10-31T12:51:58.1750000+00:00-2022-10-31T12:52:03.8160000+00:00, SequenceNumber: 3712266-3712275, Count: 10
此資訊需要您使用事件中樞擴充功能 4.2.0 或更新版本。 此資料非常有用,因為它包含觸發函式執行之訊息的相關資訊,而且可用於查詢和深入解析。 每次觸發函式時,它都會包含下列資料:
- 分割區 識別碼 (6)
- 分割 區位移 範圍 (3985758552064-3985758624640)
- UTC (2022-10-31T12:51:58.1750000+00:00-2022-10-31T12:52:03.8160000+00:00)
- 序號範圍3712266-3712275
- 訊息 計數 (10)
如需如何使用此遙測的範例 ,請參閱 Application Insights 查詢 範例一節。
自訂遙測也適用于不同的語言, (C# 類別庫、C# 隔離、C# 腳本、JavaScript、JAVA、PowerShell和Python) 。 此記錄會顯示在 Application Insights 中的 追蹤 資料表中。 您可以在 Application Insights 中建立自己的專案,並新增可用於查詢資料和建立自訂儀表板的自訂維度。
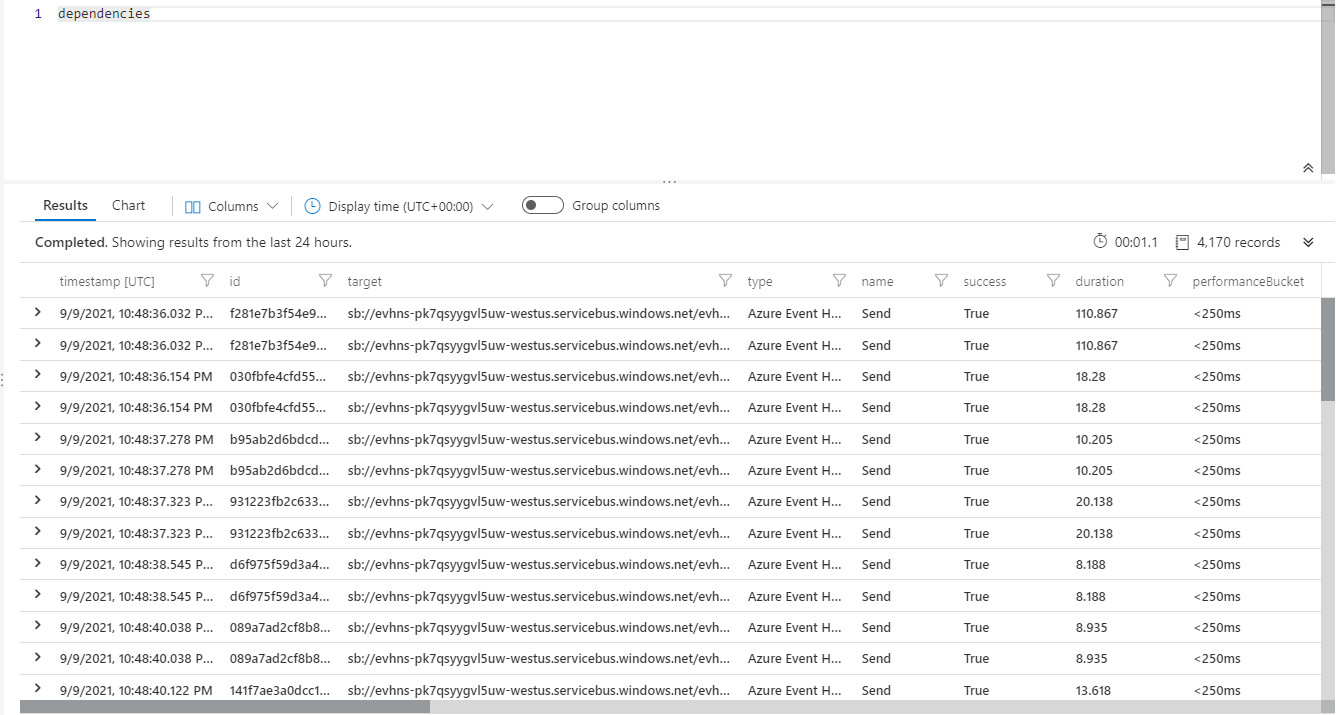
最後,當您的函式應用程式使用輸出系結連線到事件中樞時,專案也會寫入 Application Insights 相依性資料表。
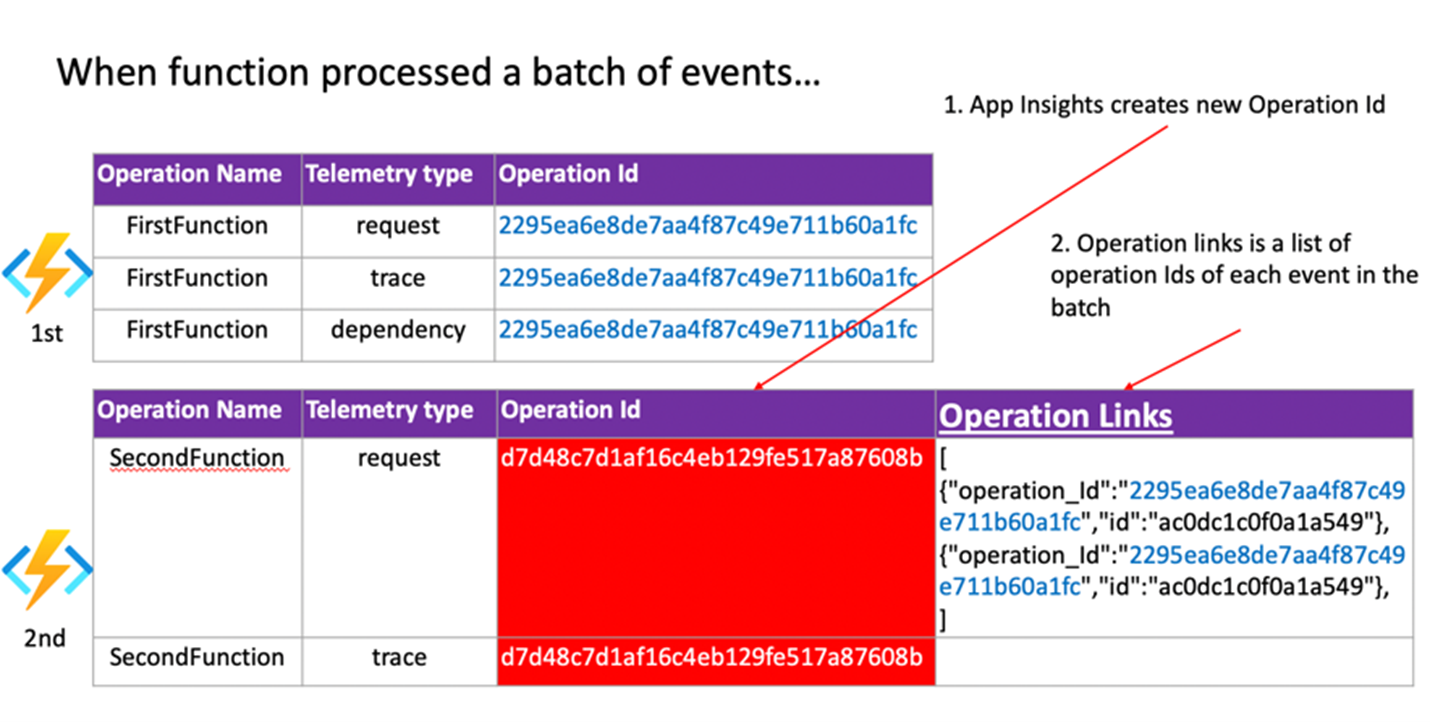
針對事件中樞,相互關聯會插入事件承載中,而且您會在事件中看到 Diagnostic-Id 屬性:
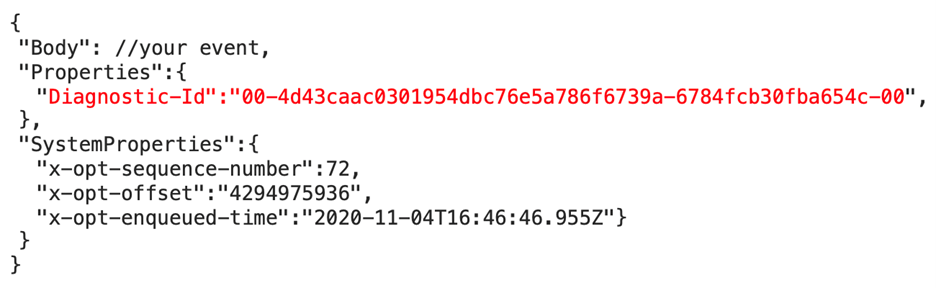
這會遵循 W3C 追蹤內容 格式,此格式也會當做 Functions 所建立之遙測中的 作業 識別碼和 作業連結 使用,這可讓 Application Insights 建構事件中樞事件與函式執行之間的相互關聯,即使它們已散發也一樣。
Application Insights 查詢範例
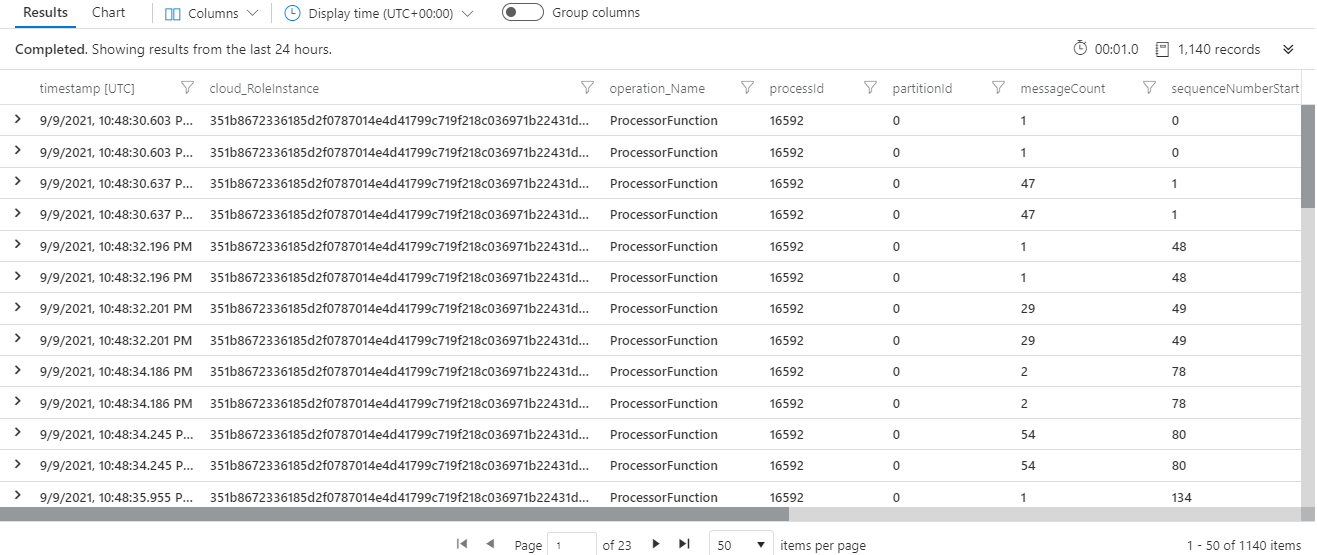
以下是使用 Azure Functions 監視事件中樞時的實用 Application Insights 查詢清單。 此查詢會使用事件中樞 擴充功能 4.2.0 和更新版本所發出的遙測,顯示事件中樞觸發函式的詳細資訊。
在 Application Insights 中 啟用取樣 時,資料可能會有間距。
詳細的事件處理資訊
只有在使用批次分派時,才會以正確的格式發出資料。 批次分派表示函式會針對每次執行接受多個事件, 這建議用於效能。 請注意下列考量:
- 值
dispatchTimeMilliseconds大約是事件寫入事件中樞的時間長度,以及函式應用程式挑選事件處理的時間長度。 dispatchTimeMilliseconds可能是負數或不正確,因為事件中樞伺服器與函式應用程式之間的時鐘漂移。- 事件中樞分割區會循序處理。 在處理所有先前的訊息之前,訊息不會分派至函式程式碼進行處理。 監視函式的執行時間,因為執行時間較長會導致分派延遲。
- 計算會使用批次中第一個訊息的 enqueueTime。 批次中其他訊息的分派時間可能會較低。
dispatchTimeMilliseconds是以時間點為基礎。- 序號是個別分割區,而且可能會發生重複的處理,因為事件中樞不保證一次訊息傳遞。
traces
| where message startswith "Trigger Details: Parti"
| parse message with * "tionId: " partitionId:string ", Offset: "
offsetStart:string "-" offsetEnd:string", EnqueueTimeUtc: "
enqueueTimeStart:datetime "+00:00-" enqueueTimeEnd:datetime "+00:00, SequenceNumber: "
sequenceNumberStart:string "-" sequenceNumberEnd:string ", Count: "
messageCount:int
| extend dispatchTimeMilliseconds = (timestamp - enqueueTimeStart) / 1ms
| project timestamp, cloud_RoleInstance, operation_Name, processId =
customDimensions.ProcessId, partitionId, messageCount, sequenceNumberStart,
sequenceNumberEnd, enqueueTimeStart, enqueueTimeEnd, dispatchTimeMilliseconds
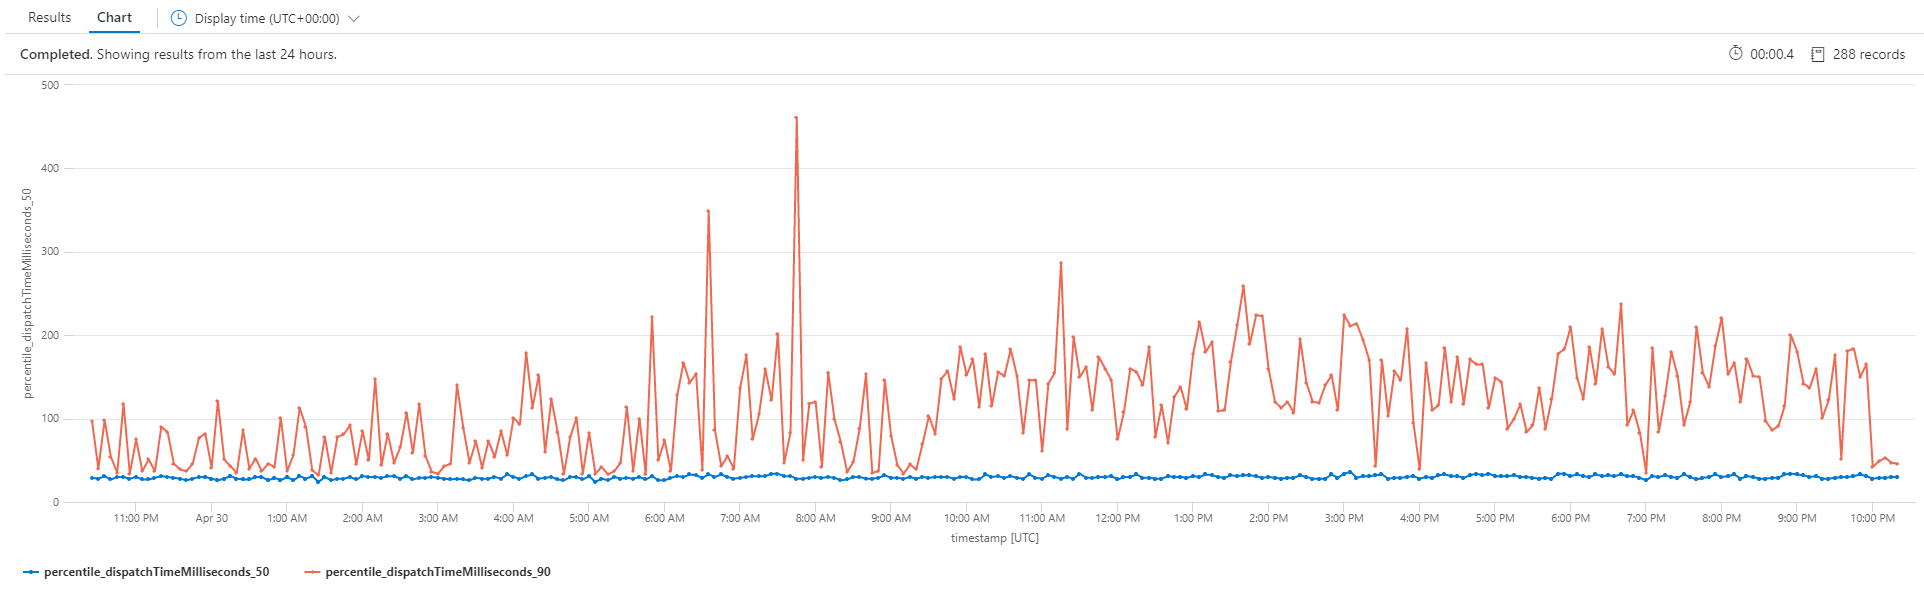
分派延遲視覺效果
此查詢會將指定事件中樞觸發函式的第 50 和 90 個百分位數事件分派延遲視覺化。 如需詳細資料和附注,請參閱上述查詢。
traces
| where operation_Name == "<ENTER THE NAME OF YOUR FUNCTION HERE>"
| where message startswith "Trigger Details: Parti"
| parse message with * "tionId: " partitionId:string ", Offset: "
offsetStart:string "-" offsetEnd:string", EnqueueTimeUtc: "
enqueueTimeStart:datetime "+00:00-" enqueueTimeEnd:datetime "+00:00, SequenceNumber: "
sequenceNumberStart:string "-" sequenceNumberEnd:string ", Count: "
messageCount:int
| extend dispatchTimeMilliseconds = (timestamp - enqueueTimeStart) / 1ms
| summarize percentiles(dispatchTimeMilliseconds, 50, 90) by bin(timestamp, 5m)
| render timechart
分派延遲摘要
此查詢類似于上述查詢,但會顯示摘要檢視。
traces
| where message startswith "Trigger Details: Parti"
| parse message with * "tionId: " partitionId:string ", Offset: "
offsetStart:string "-" offsetEnd:string", EnqueueTimeUtc: "
enqueueTimeStart:datetime "+00:00-" enqueueTimeEnd:datetime "+00:00, SequenceNumber: "
sequenceNumberStart:string "-" sequenceNumberEnd:string ", Count: "
messageCount:int
| extend dispatchTimeMilliseconds = (timestamp - enqueueTimeStart) / 1ms
| summarize messageCount = sum(messageCount),
percentiles(dispatchTimeMilliseconds, 50, 90, 99, 99.9, 99.99) by operation_Name

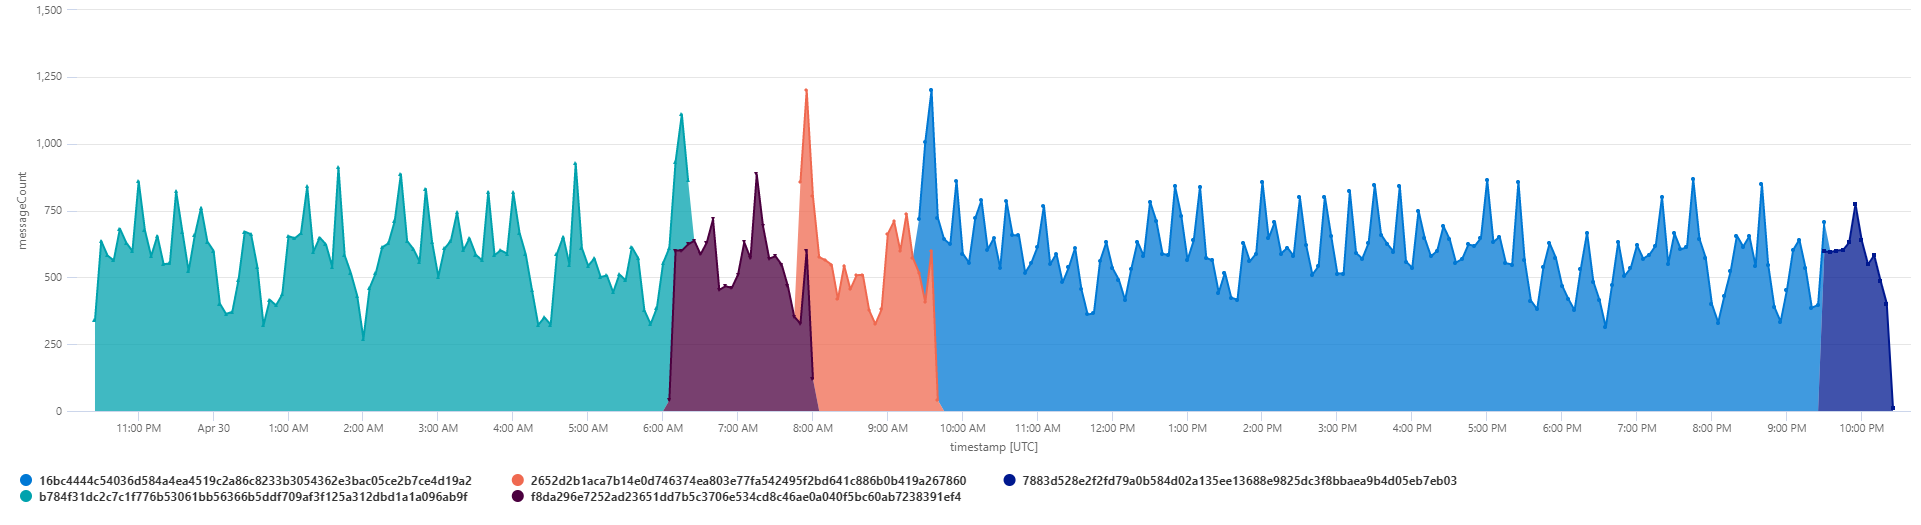
跨分割區的訊息散發
此查詢示範如何將跨資料分割的訊息分佈視覺化。
traces
| where message startswith "Trigger Details: Parti"
| parse message with * "tionId: " partitionId:string ", Offset: "
offsetStart:string "-" offsetEnd:string", EnqueueTimeUtc: "
enqueueTimeStart:datetime "+00:00-" enqueueTimeEnd:datetime "+00:00, SequenceNumber: "
sequenceNumberStart:string "-" sequenceNumberEnd:string ", Count: "
messageCount:int
| summarize messageCount = sum(messageCount) by cloud_RoleInstance,
bin(timestamp, 5m)
| render areachart kind=stacked
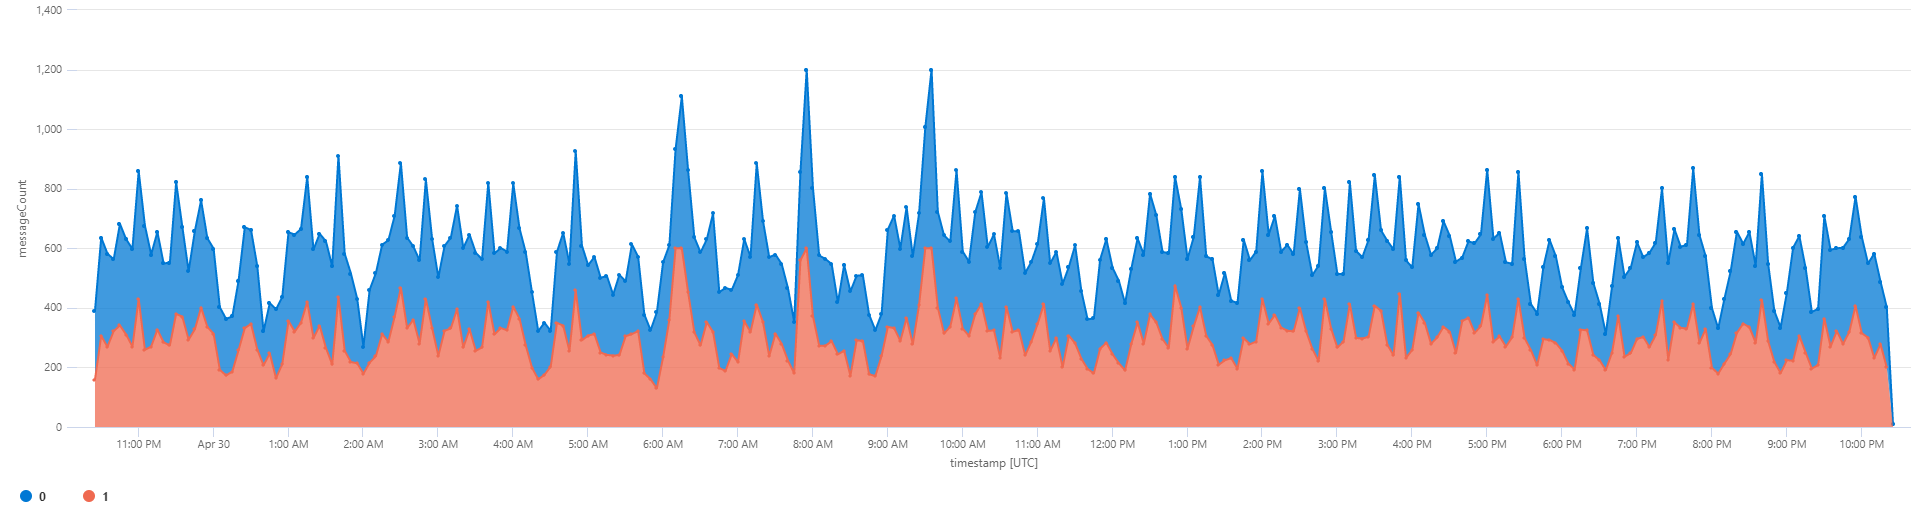
跨實例的訊息散發
此查詢示範如何視覺化跨實例的訊息分佈。
traces
| where message startswith "Trigger Details: Parti"
| parse message with * "tionId: " partitionId:string ", Offset: "
offsetStart:string "-" offsetEnd:string", EnqueueTimeUtc: "
enqueueTimeStart:datetime "+00:00-" enqueueTimeEnd:datetime "+00:00, SequenceNumber: "
sequenceNumberStart:string "-" sequenceNumberEnd:string ", Count: "
messageCount:int
| summarize messageCount = sum(messageCount) by cloud_RoleInstance,
bin(timestamp, 5m)
| render areachart kind=stacked
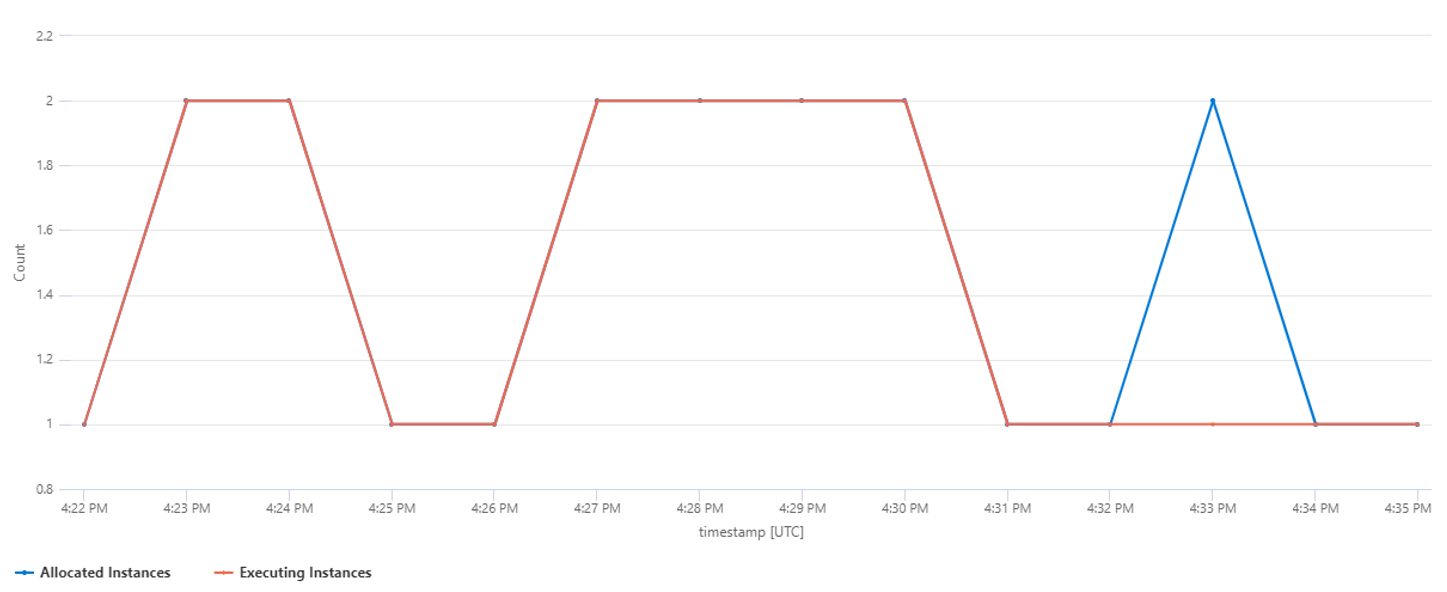
執行實例和已配置的實例
此查詢示範如何將正在處理事件的事件Azure Functions實例數目視覺化,以及處理和等候租用) 的 (實例總數。 在大部分情況下,它們應該相同。
traces
| where message startswith "Trigger Details: Parti"
| summarize type = "Executing Instances", Count = dcount(cloud_RoleInstance) by
bin(timestamp, 60s)
| union (
    traces
    | summarize type = "Allocated Instances", Count = dcount(cloud_RoleInstance) by
bin(timestamp, 60s)
)
| project timestamp, type, Count
| render timechart
特定函式執行的所有遙測
operation_Id欄位可以跨 Application Insights 中的不同資料表使用。 針對觸發的事件中樞,Azure Functions下列查詢將會產生觸發程式資訊、函式程式碼內的記錄遙測,以及相依性和例外狀況:
union isfuzzy=true requests, exceptions, traces, dependencies
| where * has "<ENTER THE OPERATION_ID OF YOUR FUNCTION EXECUTION HERE>"
| order by timestamp asc
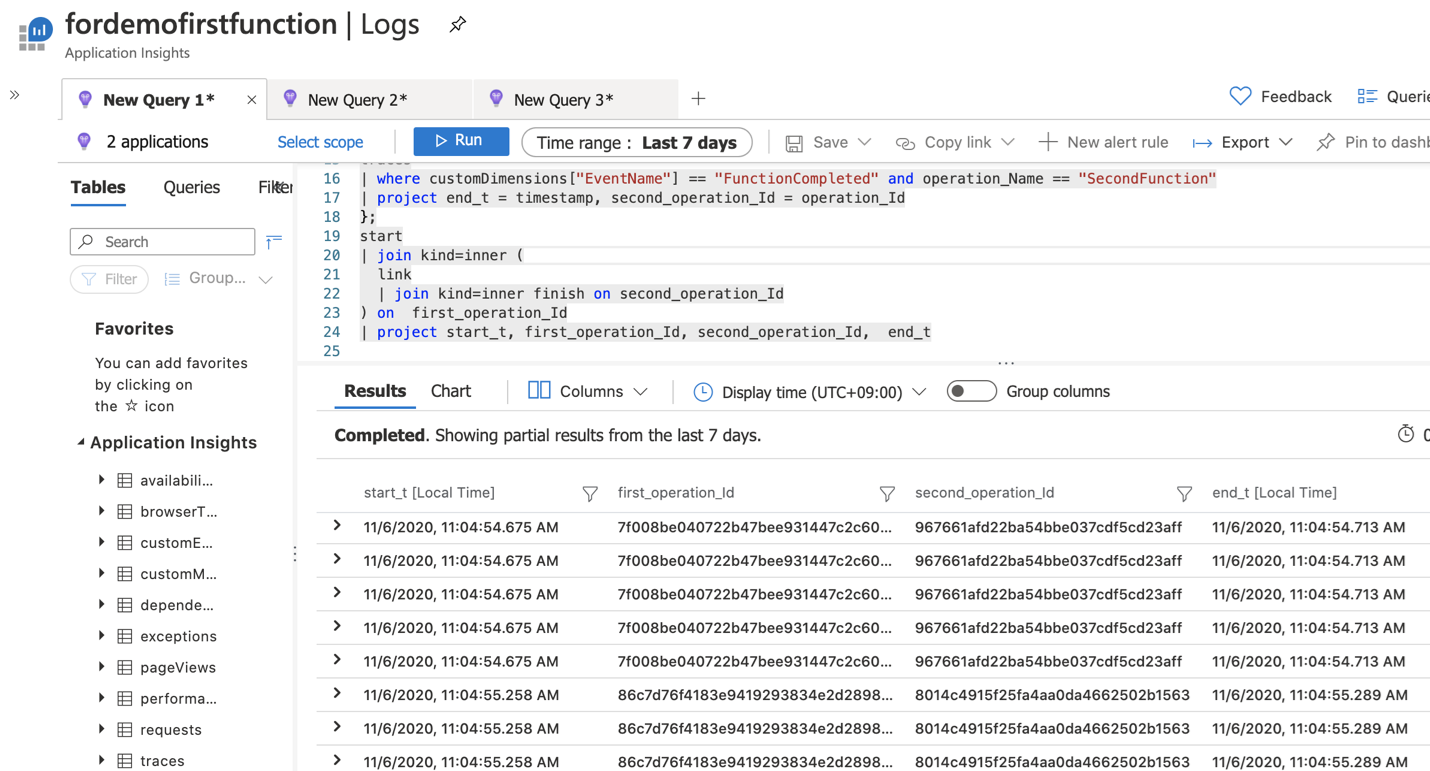
事件的端對端延遲
由於觸發程式詳細資料追蹤中的 enqueueTimeUtc 屬性只會顯示函式處理之每個批次之第一個事件的排入佇列時間,因此可以使用更進階的查詢來計算兩個函式之間事件與事件中樞之間的端對端延遲。 如果第二個函式的要求中有任何) ,並將其結束時間對應至第一個函式開始時間的相同對應作業識別碼,此查詢將會展開作業連結 (。
let start = view(){
requests
| where operation_Name == "FirstFunction"
| project start_t = timestamp, first_operation_Id = operation_Id
};
let link = view(){
requests
| where operation_Name == "SecondFunction"
| mv-expand ex = parse_json(tostring(customDimensions["_MS.links"]))
| extend parent = case(isnotempty(ex.operation_Id), ex.operation_Id, operation_Id )
| project first_operation_Id = parent, second_operation_Id = operation_Id
};
let finish = view(){
traces
| where customDimensions["EventName"] == "FunctionCompleted" and operation_Name
== "SecondFunction"
| project end_t = timestamp, second_operation_Id = operation_Id
};
start
| join kind=inner (
link
| join kind=inner finish on second_operation_Id
) on first_operation_Id
| project start_t, end_t, first_operation_Id, second_operation_Id
| summarize avg(datetime_diff('second', end_t, start_t))
參與者
本文由 Microsoft 維護。 最初是由下列參與者所撰寫。
主體作者:
- David Barkol |主要解決方案專家 GBB
若要查看非公用LinkedIn設定檔,請登入 LinkedIn。
下一步
若要深入瞭解,請考慮檢閱下列相關文章:
- 監視無伺服器事件處理
- 分析 Application Insights 中的 Azure Functions 遙測
- 如何設定 Azure Functions 的監視
- 分析 Application Insights 中的 Azure Functions 遙測
- Azure 監視器中的計量 - Azure 事件中樞
- Kusto 查詢語言
相關資源
- 監視無伺服器事件處理 提供監視無伺服器事件驅動架構的指引。
- 無伺服器事件處理 是參考架構,詳細說明此類型的一般架構,其中包含程式碼範例和重要考慮的討論。
- 使用事件中樞在無伺服器事件處理中取消批次處理和篩選 會詳細說明參考架構的這些部分的運作方式。