本指南說明如何使用 SRTM 任務的 USGS 全球 DEM 資料 (精確度為 30m),以在 Microsoft Azure Cloud 上建置標高服務。
這篇文章說明如何:
- 建立等高線向量地圖底圖和 RGB 編碼的 DEM 地圖底圖。
- 使用 Azure Blob 儲存體的 Azure Function 和 RGB 編碼的 DEM 地圖底圖來建立標高 API。
- 使用 Azure Function 和 PostgreSQL 建立等高線向量地圖底圖服務。
必要條件
此指南需要使用下列第三方軟體和資料:
- USGS 資料。 DEM 資料可透過 USGS EarthExplorer 下載為 GeoTiff,每個屠格 1 個弧秒涵蓋範圍。 此需要 EarthExplorer 帳戶,但資料可免費下載。
- QGIS 桌面板 GIS 應用程式可用於處理和平滑點陣地圖底圖。 QGIS 免費下載和使用。 本指南需要 QGIS 版本 3.26.2-Buenos Aires。
- MapBox 開發的 rio-rgbify Python 套件可用於將 GeoTIFF 編碼為 RGB。
- 使用 PostGIS 空間延伸模組的 PostgreSQL 資料庫。
建立等高線向量地圖底圖和 RGB 編碼的 DEM 地圖底圖
本指南使用涵蓋華盛頓州的 36 地圖底圖,可自 USGS EarthExplorer 取得。
自 USGS EarthExplorer 下載點陣地圖底圖
搜尋條件
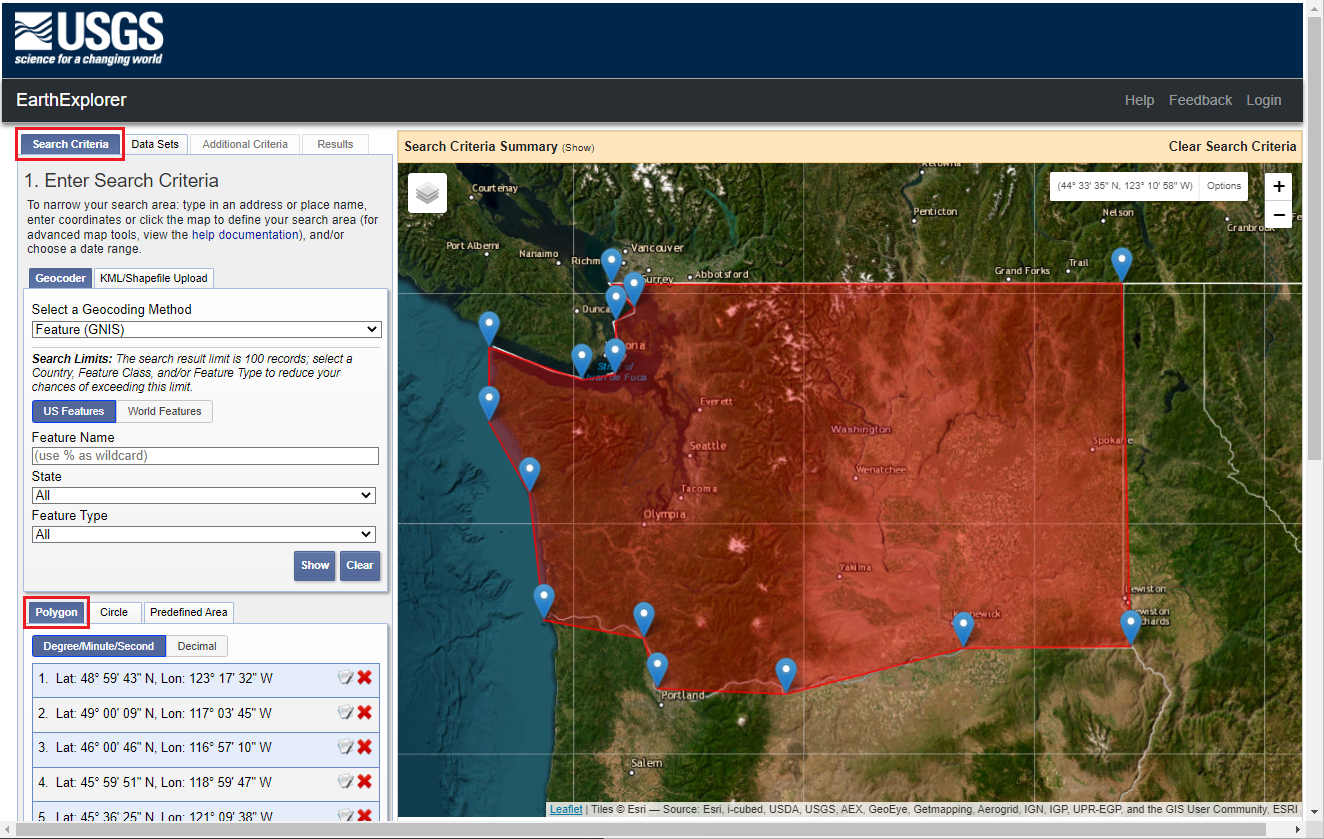
選取您要點陣地圖底圖的區域。 基於示範目的,本指南使用「Polygon」方法來選取地圖上的區域。
瀏覽至 USGS EarthExplorer。
在 [搜尋條件] 索引標籤中,選取 [Polygon],然後選取地圖上的任意處以建立界限。

資料集
選取 [資料集] 索引標籤。
從 [數位標高] 區段選取 [SRTM 1 弧秒全球]。
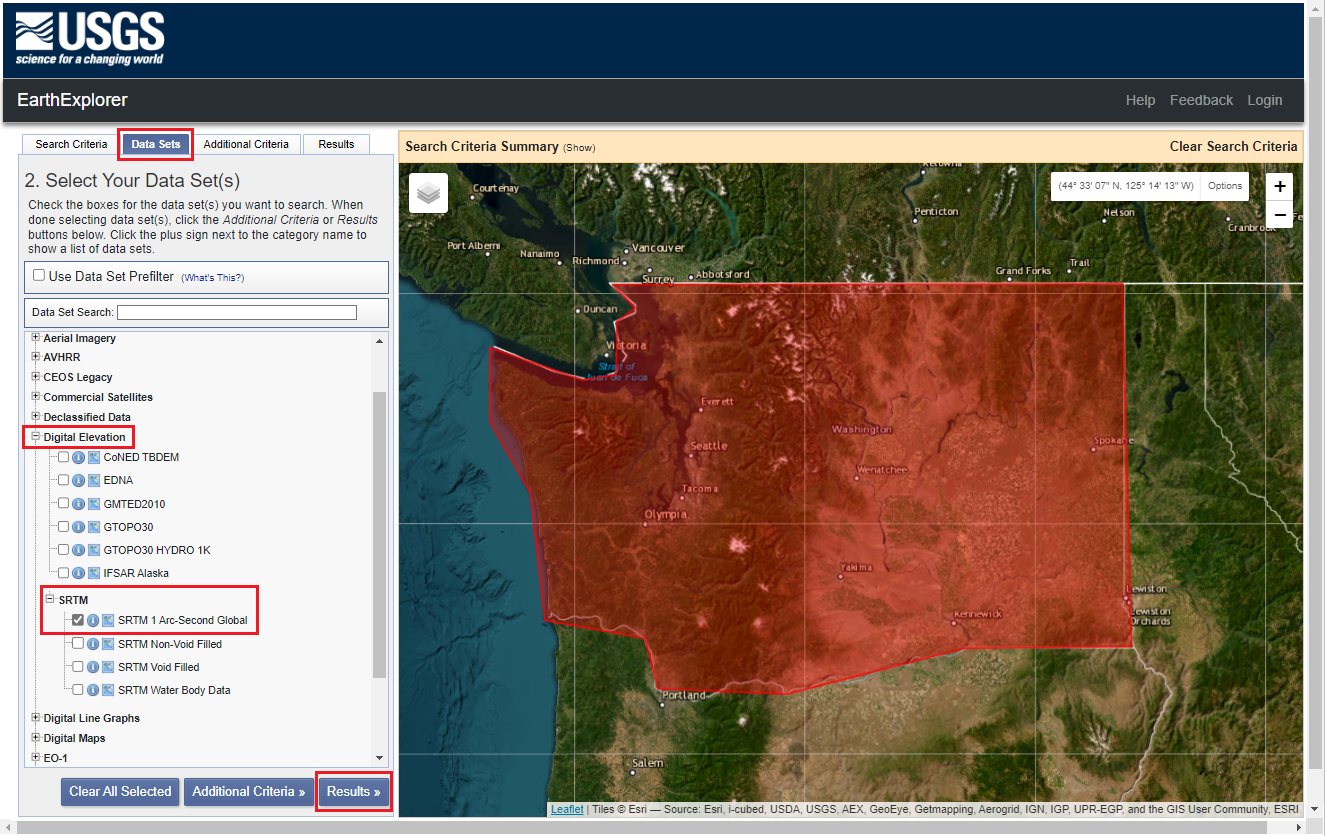

結果
選取 [結果 >>] 以檢視所選區域和資料集的地圖底圖。
可下載地圖底圖的清單會顯示在結果頁面上。 若要僅下載您要的地圖底圖,請針對每個地圖底圖選取結果卡片上的 [下載選項],選取 [GeoTIFF 1 弧秒],然後針對剩餘地圖底圖重複此步驟。
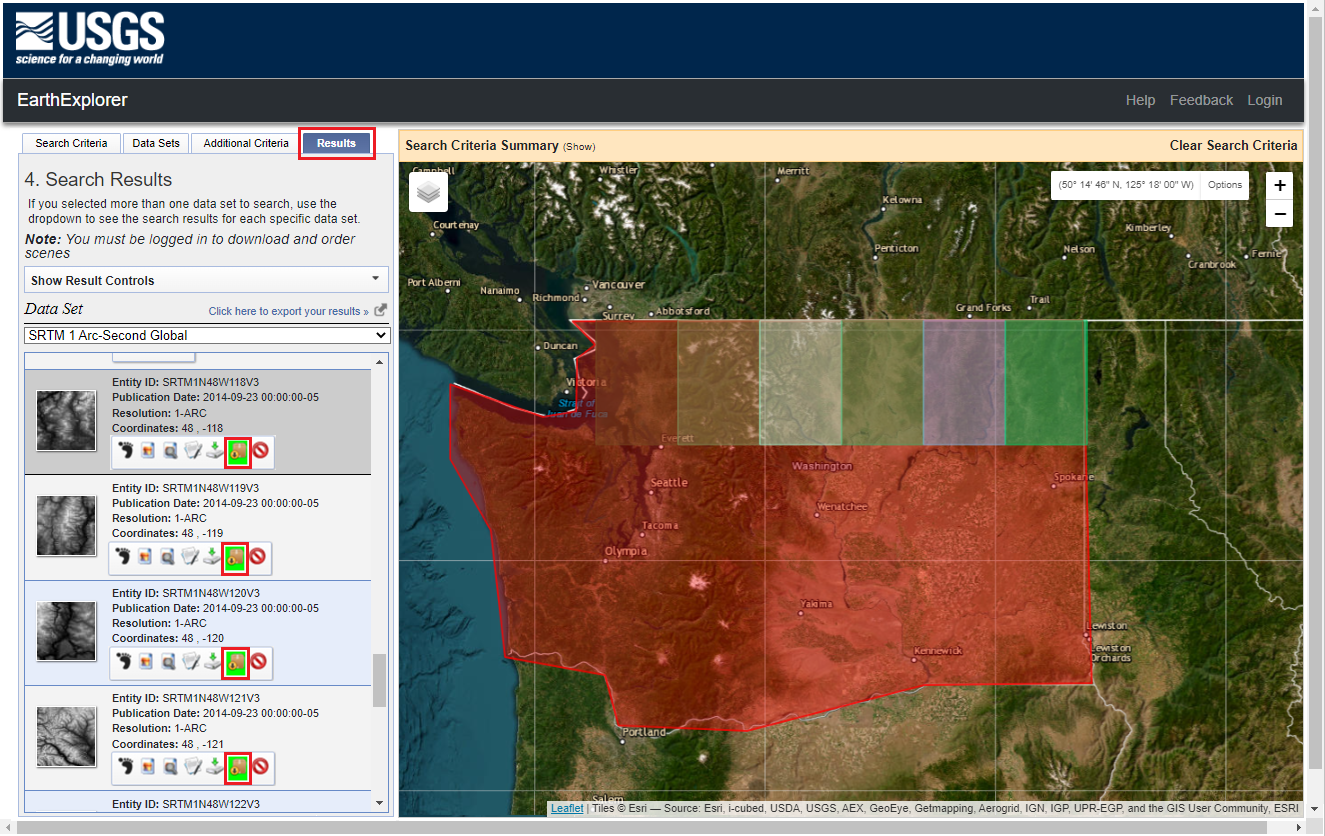
或者,使用大量下載選項並選取 [GeoTIFF 1 弧秒]。

將點陣地圖底圖新增至 QGIS
一旦擁有所需要點陣地圖底圖後,您可將其匯入至 QGIS。
將檔案拖曳至 [QGIS 圖層] 索引標籤或選取 [圖層] 功能表的 [新增圖層],以將點陣圖層新增至 QGIS。
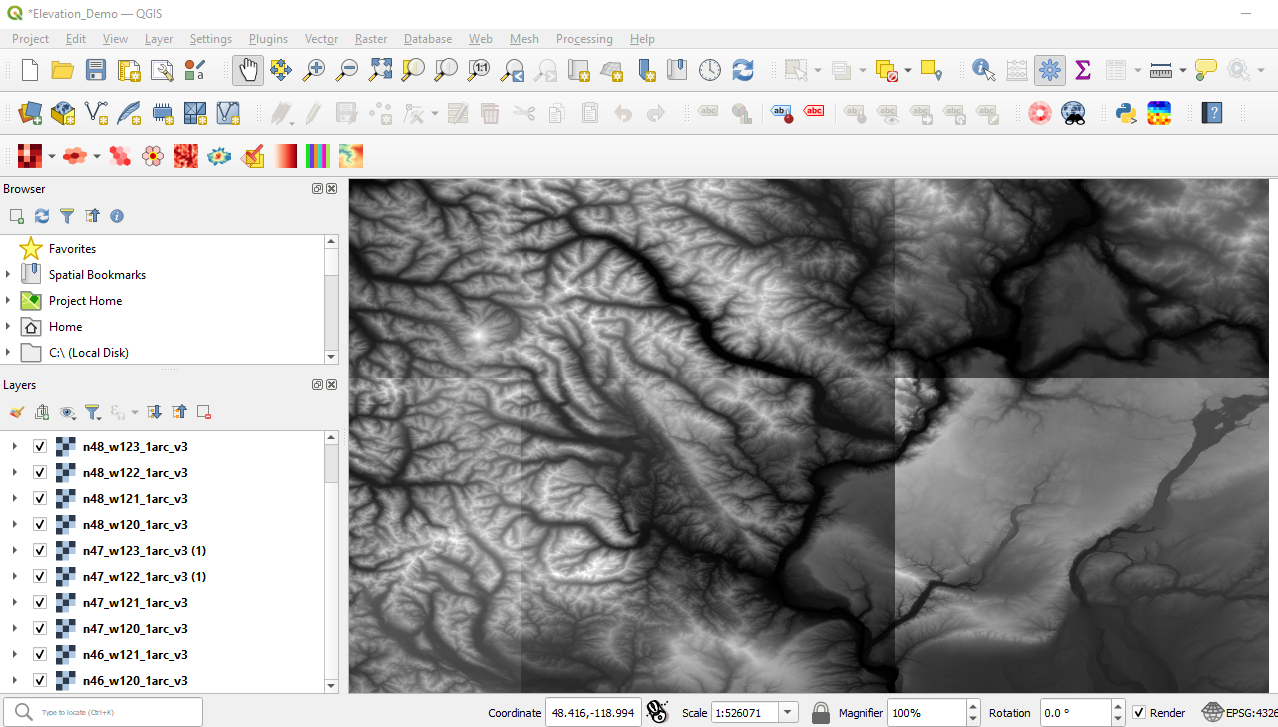
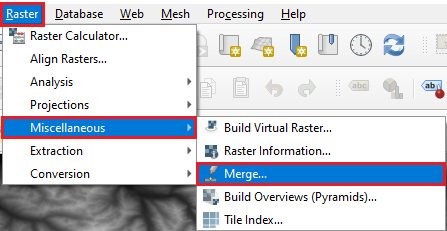
當點陣圖層載入 QGIS 時,可能會有不同的地圖底圖陰影。 透過合併點陣圖層以修正此問題,這會產生 GeoTIFF 格式的單一平滑點陣影像。 若要執行此動作,請從 [點陣] 功能表選取 [其他],然後選取 [合併...]
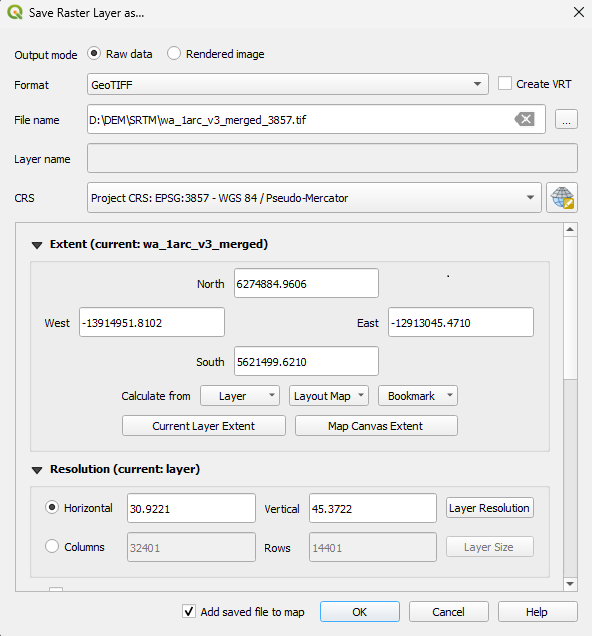
使用 [另存光柵層為] 將合併光柵層重新投影至 EPSG:3857 (WGS84 / Pseudo-Mercator),按一下滑鼠右鍵以在 [目錄] -> [匯出] -> [另存新檔] 選項中存取光柵層。 EPSG:3857 需要與 Azure 地圖服務 Web SDK 同時使用。
如果您僅要建立等高線向量地圖底圖,您可略過下列步驟並移至使用 Azure Function 和 PostgreSQL 建立等高線向量地圖底圖服務。
若要建立標高 API,下一個步驟為以 RGB 編碼 GeoTIFF。 您可使用 MapBox 開發的 rio-rgbify 進行。 在 Windows 中直接執行此工具可能有某些挑戰,因此建議從 WSL 執行。 以下是 WSL 版 Ubuntu 步驟:
sudo apt get update
sudo apt get upgrade
sudo apt install python3-pip
pip install rio-rgbify
PATH="$PATH:/home/<user  /.local/bin"
# The following two steps are only necessary when mounting an external hard drive or USB flash drive:
sudo mkdir /mnt/f
sudo mount -t drvfs D: /mnt/f

rio rgbify -b -10000 -i 0.1 wa_1arc_v3_merged_3857.tif wa_1arc_v3_merged_3857_rgb.tif

# The following steps are only necessary when unmounting an external hard drive or USB flash drive:
cd \~
sudo umount /mnt/f/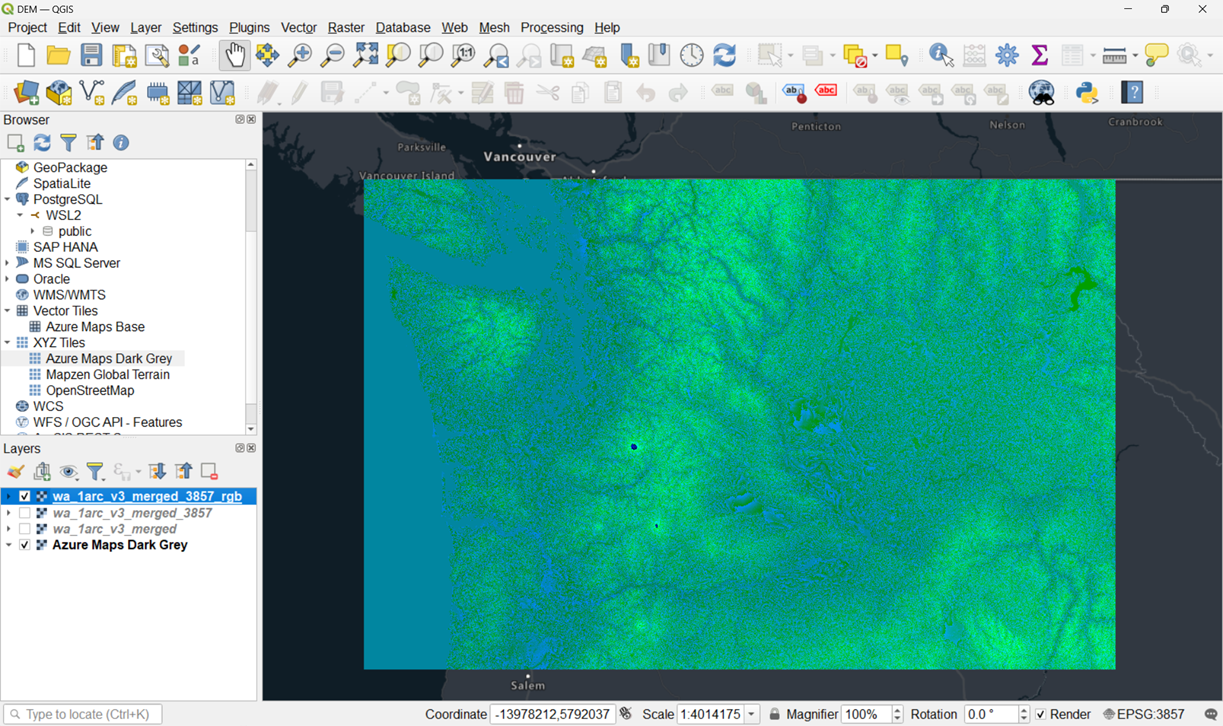
RGB 編碼的 GeoTIFF 允許您擷取像素的 R、G 和 B 值,並計算這些值的標高:
elevation (m) = -10000 + ((R * 256 * 256 + G * 256 + B) * 0.1)接下來,建立圖格集合以用於地圖控制項和/或用來取得地圖底圖集合地圖範圍內地理座標的標高。 您可使用 [產生 XYZ 地圖底圖 (目錄)],在 QGIS 中建立地圖底圖集合。
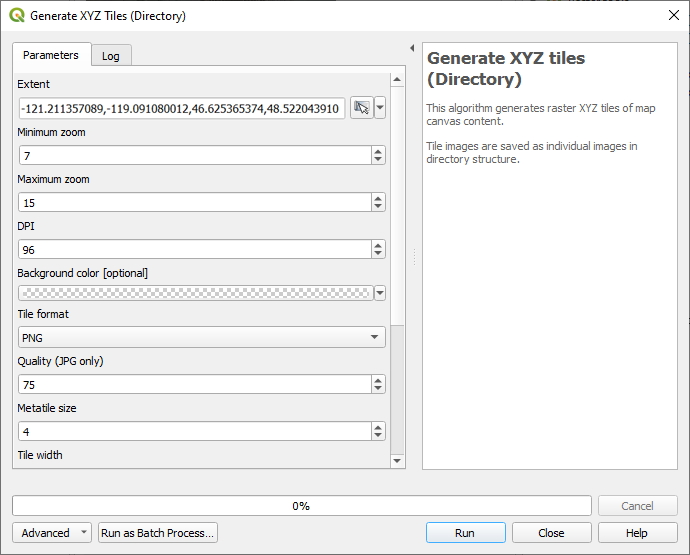
儲存地圖底圖集合的位置,您將在下一節中使用。

使用 Azure Blob Storage 的 Azure Function 和 RGB 編碼的 DEM 地圖底圖來建立標高 API
RGB 編碼的 DEM 地圖底圖需要先上傳至資料庫儲存體,才能用於 Azure Functions 以建立 API。
將此地圖底圖上傳至 Azure Blob 儲存體。 Azure 儲存體總管是適合此用途的工具。
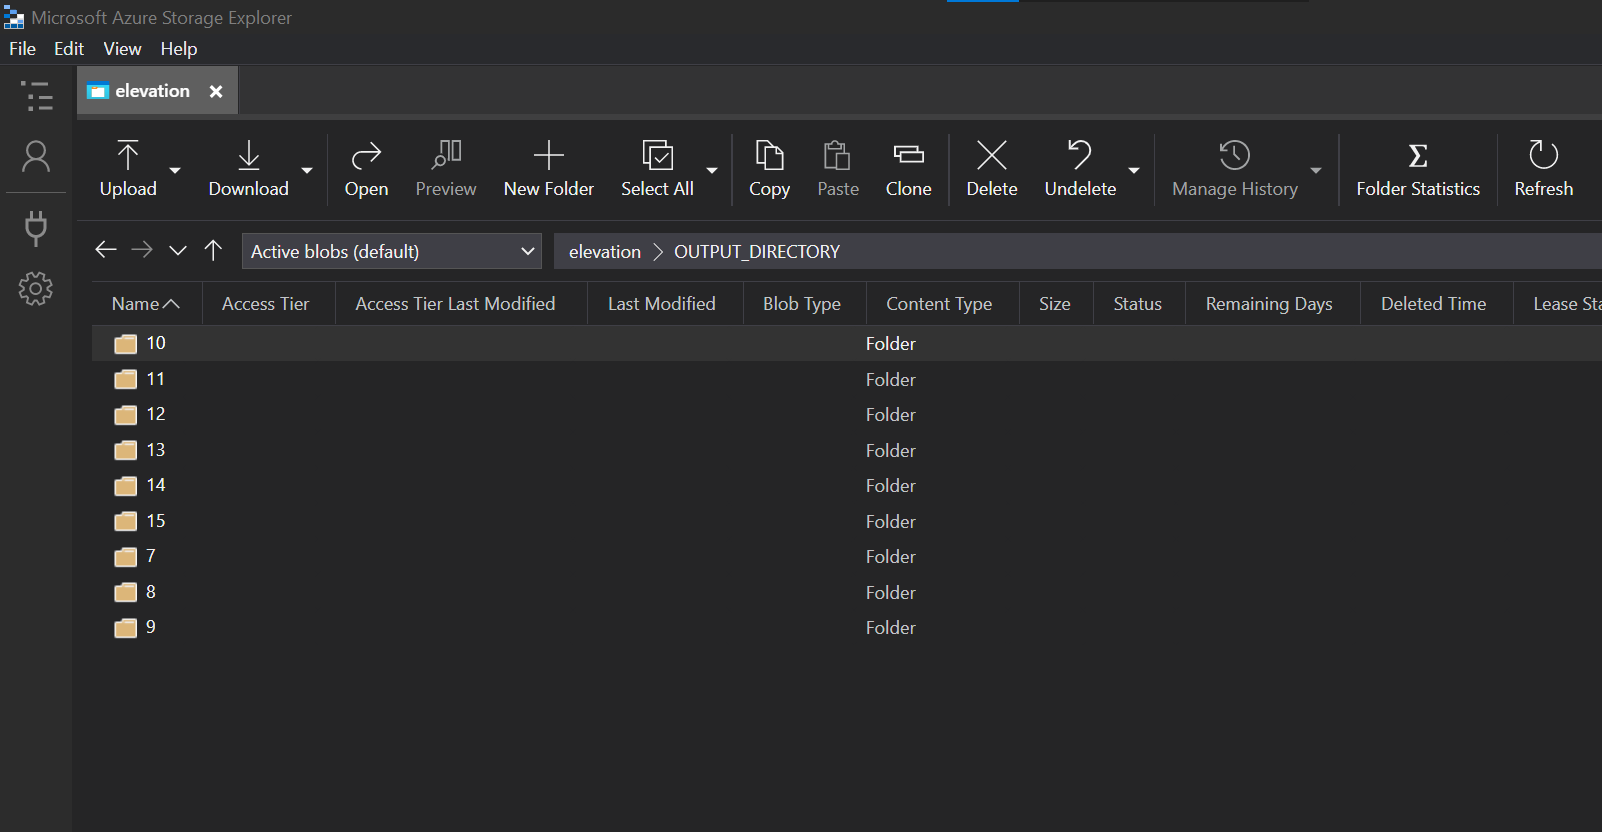
將地圖底圖上傳至 Azure Blob 儲存體可能需要幾分鐘的時間完成。
上傳完成後,您可建立 Azure Function 來建置 API,傳回指定地理座標的標高。
此函式會接收座標組,判斷涵蓋在縮放層級 14 的地圖底圖,接著判斷符合地理座標地圖底圖內的像素座標。 然後擷取地圖底圖,取得像素的 RGB 值,並使用下列格式判斷標高:
elevation (m) = -10000 + ((R * 256 * 256 + G * 256 + B) * 0.1)
import logging
import json
import azure.functions as func
from PIL import Image
import requests
from io import BytesIO
import math

def main(req: func.HttpRequest) -> func.HttpResponse:
    logging.info('Python HTTP trigger function processed a request.')

    # http://localhost:7071/api/GetElevationPoint?lng=-122.01911&lat=47.67091
    zoom = 14
    lng = float(req.params.get('lng'))
    lat = float(req.params.get('lat'))
    logging.info('Lng: ' + str(lng) + ' / lat: ' + str(lat))

    # Calculate th global pixel x and y coordinates for a lng / lat
    gx = (lng + 180) / 360
    sinLat = math.sin(lat * math.pi / 180)
    gy = 0.5 - math.log((1 + sinLat) / (1 - sinLat)) / (4 * math.pi)
    mapSize = math.ceil(256 * math.pow(2, zoom));
    gxc = min(max(gx * mapSize + 0.5, 0), mapSize - 1);
    gyc = min(max(gy * mapSize + 0.5, 0), mapSize - 1);

    # Calculate the tile x and y covering the lng / lat
    tileX = int(gxc / 256)
    tileY = int(gyc / 256)

    # Calculate the pixel coordinates for the tile covering the lng / lat
    tilePixelX = math.floor(gxc - (tileX * 256))
    tilePixelY = math.floor(gyc - (tileY * 256))

    response = requests.get("{BlobStorageURL}" + str(zoom) + "/" + str(tileX) + "/" + str(tileY) + ".png")
    im = Image.open(BytesIO(response.content))

    pix = im.load()
    r = pix[tilePixelX,tilePixelY][0]
    g = pix[tilePixelX,tilePixelY][1]
    b = pix[tilePixelX,tilePixelY][2]

    # elevation (m) = -10000 + ((R * 256 * 256 + G * 256 + B) * 0.1)
    ele = -10000 + ((r * 256 * 256 + g * 256 + b) * 0.1)

    jsonRes = {"elevation": + ele}
    logging.info('Response: ' + json.dumps(jsonRes))

    if lng and lat:
        return func.HttpResponse(
            json.dumps(jsonRes),
            mimetype="application/json",
        )
    else:
        return func.HttpResponse(
            "ERROR: Missing parameter!",
            status_code=400
        )
若要查看程式碼範例的結果,請在本機執行:
localhost:7071/api/GetElevationPoint?lng=-122.01911&lat=47.67091`
使用 Azure Function 和 PostgreSQL 建立等高線向量地圖底圖服務
本節說明在 QGIS 中建立和處理等高線的步驟,將其上傳至 PostgreSQL,然後建立 Azure Function 查詢 PostgreSQL 以傳回向量地圖底圖。
在 QGIS 中,開啟 EPSG:4326 投影的合併點陣地圖底圖,該地圖底圖是在建立等高線向量圖格和 RGB 編碼的 DEM 地圖底圖的步驟 3 所建立。
從 [點陣] 功能表依序選取 [擷取] -> [等高線] 以開啟 [等高線] 工具。
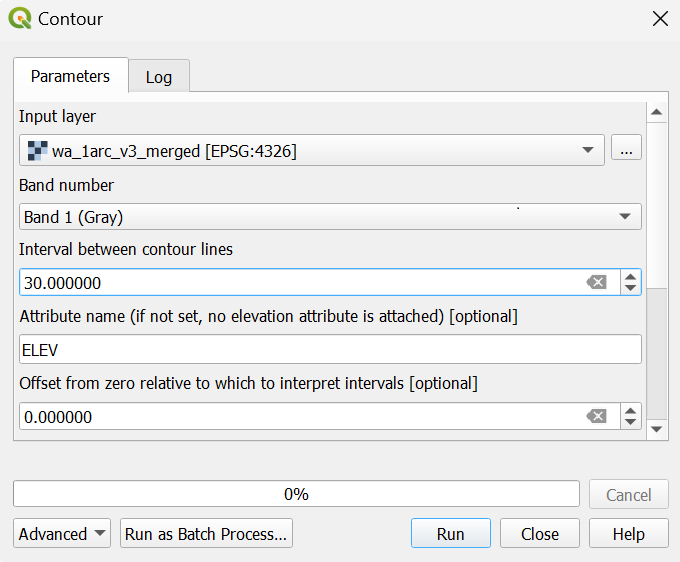
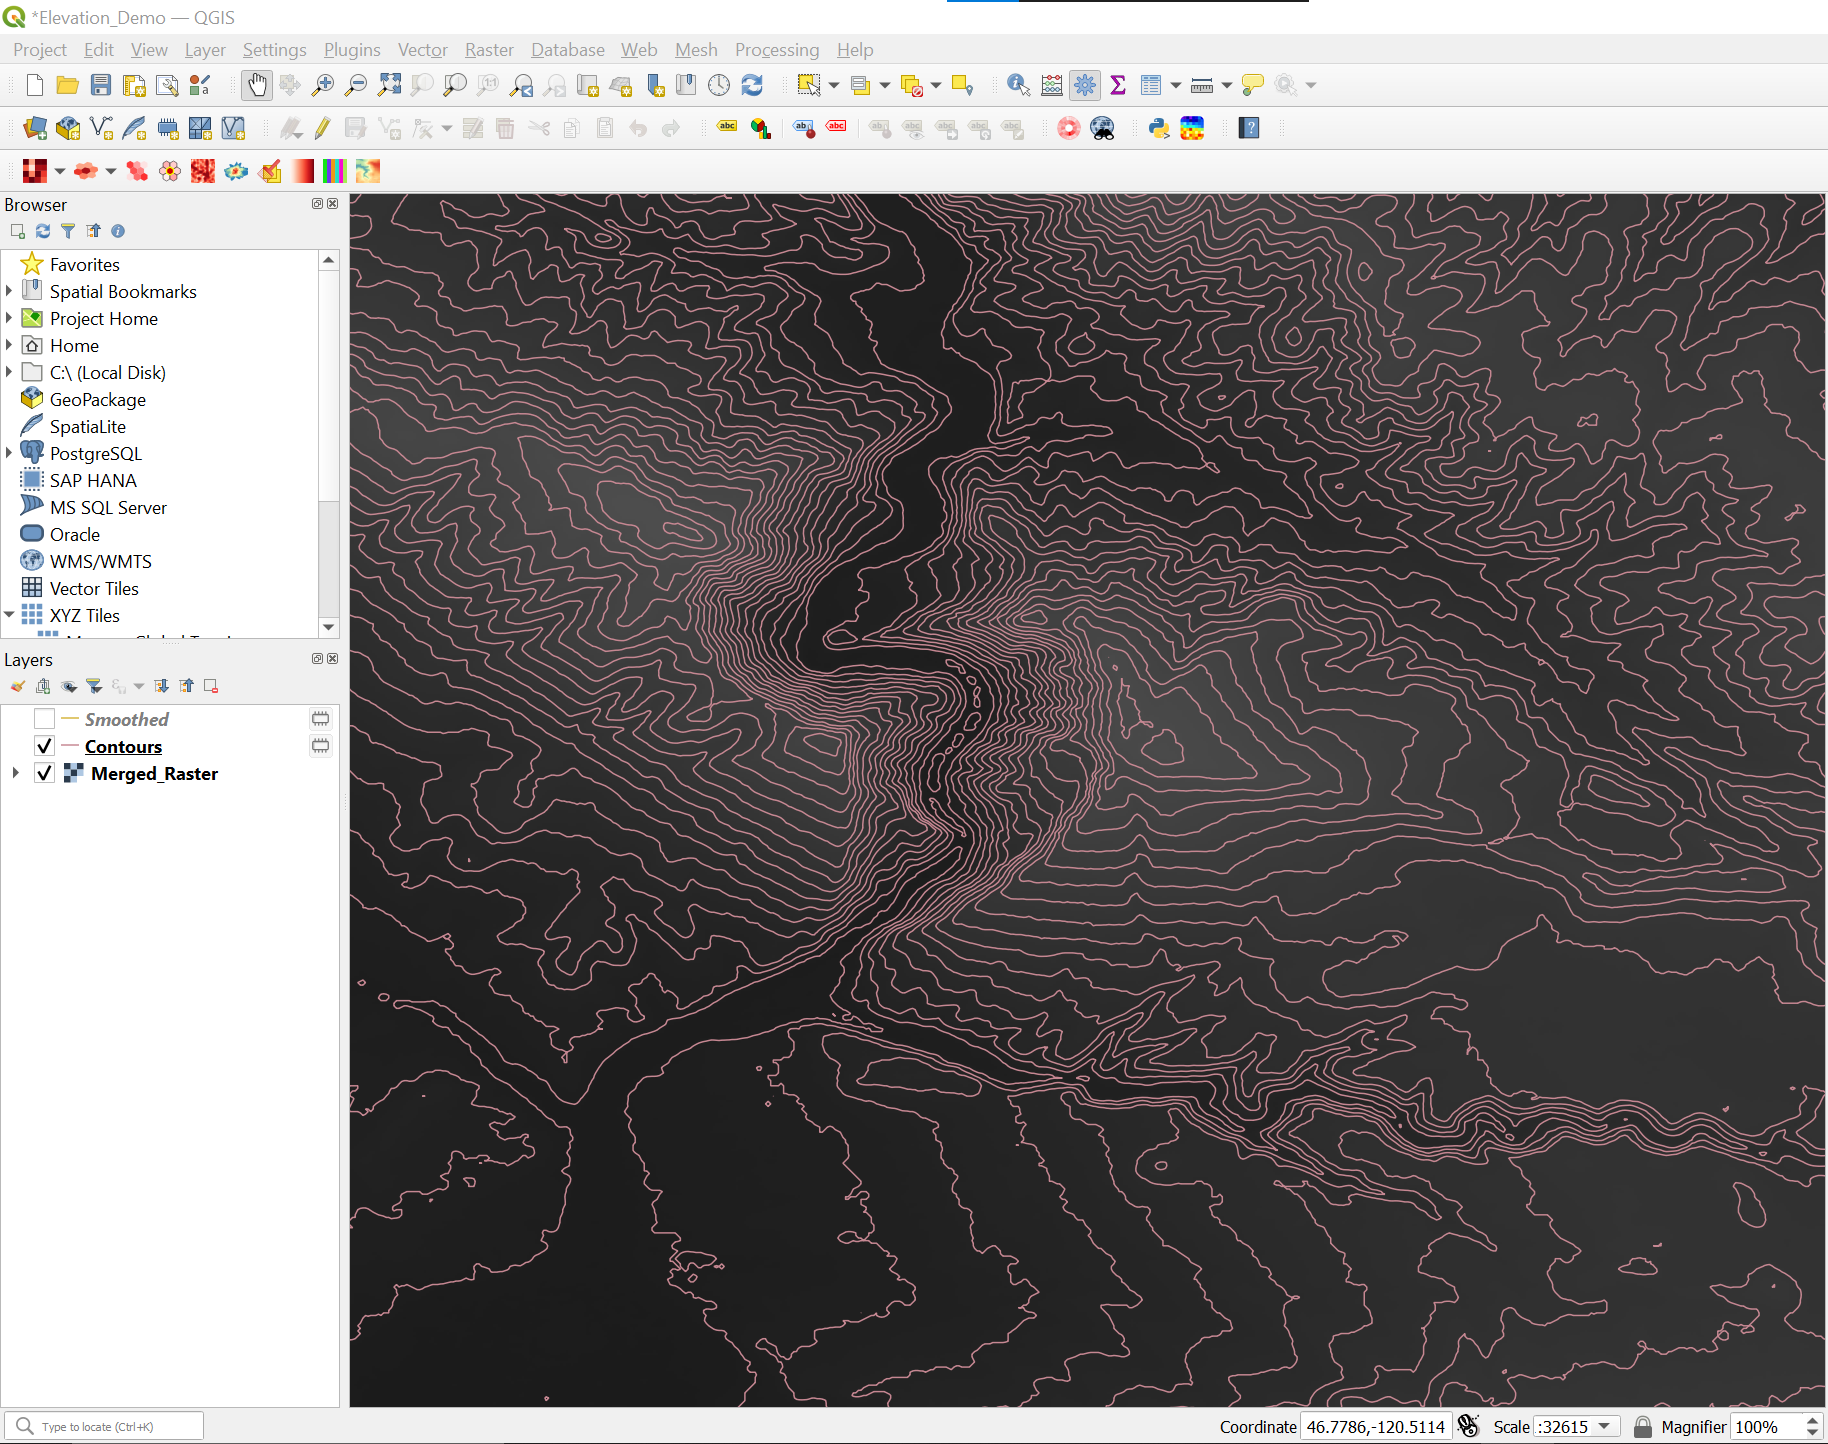
選取 [執行] 建立等高線並將其作為圖層新增至地圖。 有些等高線的邊緣可能不平滑。 下一個步驟將處理此問題。
從 [處理] 功能選選取 [工具箱] 以顯示 [處理工具箱]。
然後在 [處理工具箱] 的 [向量幾何] 區段中選取 [平滑]。
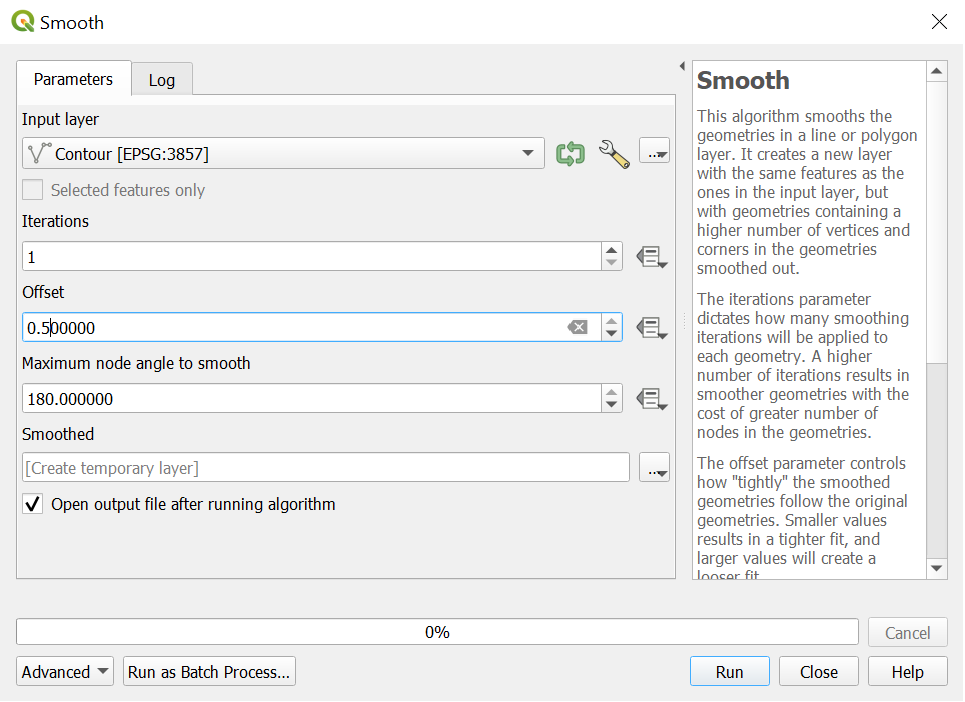
注意
等高線平滑可大幅改善,但代價是增加檔案大小。
將等高線載入資料庫。 本指南使用 localhost 上執行的免費 PostgreSQL 資料庫版本。 您也可將其載入至適用於 PostgreSQL 的 Azure 資料庫。
下一個步驟需要使用 PostGIS 延伸模組的 PostgreSQL 資料庫。
若要建立從 QGIS 到 PostgreSQL 的連線,請從 [圖層] 功能表依序選取 [新增圖層] -> [新增 PostGIS 圖層],然後選取 [新增] 按鈕。
![在 QGIS 中顯示 [建立新的 PostGIG 連線] 對話方塊的螢幕擷取畫面。](media/elevation-services/create-new-postgis-connection.png)
接下來,在 QGIC 中使用資料庫管理員以將資料從 QGIS 載入至 PostgreSQL。 若要執行此動作,請從 [資料庫] 功能表選取 [DB 管理員]。
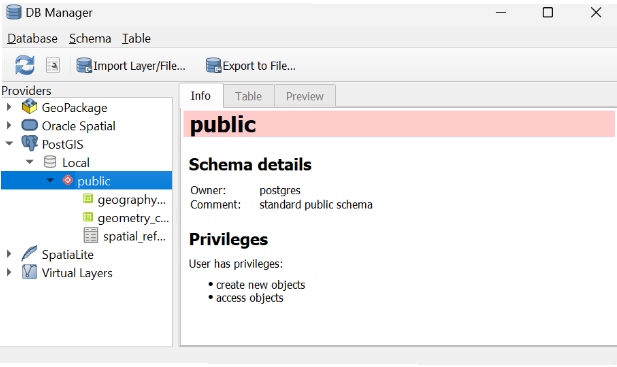
連線至 PostGIS 資料庫,並選取 [匯入圖層/檔案...] 以將等高線匯入至資料庫。
![在 QGIS 中顯示 [匯入向量] 對話方塊的螢幕擷取畫面。](media/elevation-services/import-vector-layer.png)
您現在可使用 Azure Function 以查詢 PostgreSQL,並傳回等高線的向量地圖底圖。 圖格伺服器可與 Azure 地圖服務 Web SDK 一起使用以建立 Web 應用程式,在地圖上顯示等高線。
import logging
from wsgiref import headers
import azure.functions as func
import psycopg2
# Database to connect to
DATABASE = {
    'user':     'postgres',
    'password': '{password}',
    'host':     'localhost',
    'port':     '5432',
    'database': '{database}'
    }
def main(req: func.HttpRequest) -> func.HttpResponse:
    logging.info('Python HTTP trigger function processed a request.')
    DATABASE_CONNECTION = None
    # get url parameters http://localhost:7071/api/tileserver?zoom={z}&x={x}&y={y}
    # http://localhost:7071/api/tileserver?zoom=16&x=10556&y=22870
    zoom = int(req.params.get('zoom'))
    x = int(req.params.get('x'))
    y = int(req.params.get('y'))
    table = req.params.get('table')
    # calculate the envelope of the tile
    # Width of world in EPSG:3857
    worldMercMax = 20037508.3427892
    worldMercMin = -1 * worldMercMax
    worldMercSize = worldMercMax - worldMercMin
    # Width in tiles
    worldTileSize = 2 ** zoom

    # Tile width in EPSG:3857
    tileMercSize = worldMercSize / worldTileSize

    # Calculate geographic bounds from tile coordinates
    # XYZ tile coordinates are in "image space" so origin is
    # top-left, not bottom right
    xmin = worldMercMin + tileMercSize * x
    xmax = worldMercMin + tileMercSize * (x + 1)
    ymin = worldMercMax - tileMercSize * (y + 1)
    ymax = worldMercMax - tileMercSize * y
    # Generate SQL to materialize a query envelope in EPSG:3857.
    # Densify the edges a little so the envelope can be
    # safely converted to other coordinate systems.
    DENSIFY_FACTOR = 4
    segSize = (xmax - xmin)/DENSIFY_FACTOR
    sql01 = 'ST_Segmentize(ST_MakeEnvelope(' + str(xmin) + ', ' + str(ymin) + ', ' + str(xmax) + ', ' + str(ymax) + ', 3857), ' + str(segSize) +')'

    # Generate a SQL query to pull a tile worth of MVT data
    # from the table of interest.
    # Materialize the bounds
    # Select the relevant geometry and clip to MVT bounds
    # Convert to MVT format
    sql02 = 'WITH bounds AS (SELECT ' + sql01 + ' AS geom, ' + sql01 + '::box2d AS b2d), mvtgeom AS (SELECT ST_AsMVTGeom(ST_Transform(t.geom, 3857), bounds.b2d) AS geom, elev FROM contourlines_smooth t, bounds WHERE ST_Intersects(t.geom, ST_Transform(bounds.geom, 4326))) SELECT ST_AsMVT(mvtgeom.*) FROM mvtgeom'

    # Run tile query SQL and return error on failure conditions
    # Make and hold connection to database
    if not DATABASE_CONNECTION:
        try:
            DATABASE_CONNECTION = psycopg2.connect(**DATABASE)
            logging.info('Connected to database.')
        except (Exception, psycopg2.Error) as error:
            logging.error('ERROR: Cannot connect to database.')
    # Query for MVT
    with DATABASE_CONNECTION.cursor() as cur:
        cur.execute(sql02)
        if not cur:
            logging.error('ERROR: SQL Query failed.')
        pbf = cur.fetchone()[0]
        logging.info('Queried database')

    if zoom and x and y:
        return func.HttpResponse(
            # f"This HTTP triggered function executed successfully.\n\nzoom={zoom}\nx={x}\ny={y}\n\nxmin={xmin}\nxmax={xmax}\nymin={ymin}\nymax={ymax}\n\nsql01={sql01}\n\nsql02={sql02}",
            bytes(pbf),
            status_code=200,
            headers={"Content-type": "application/vnd.mapbox-vector-tile","Access-Control-Allow-Origin": "*"}
        )
    else:
        return func.HttpResponse(
            "ERROR: Missing parameter!",
            status_code=400
        )
若要查看程式碼範例的結果,請在本機執行:
http://localhost:7071/api/tileserver?zoom={z}&x={x}&y={y}