教學課程:使用 Jupyter Notebook 將感測器數據與氣象預報數據聯結(Python)
風力發電可替代化石燃料來作為能源來源,以對抗氣候變遷。 由於風本身並不是固定的,因此,風力發電操作員必須建立機器學習 (ML) 模型來預測風力。 此預測是符合電力需求及確保電網穩定性所必需的。 在本教學課程中,我們將逐步解說如何將 Azure 地圖服務的氣象預報資料與天候數據的示範資料結合在一起。 呼叫 Azure 地圖服務氣象服務,即可要求氣象預報資料。
在此教學課程中,您需要:
注意
此專案的 Jupyter Notebook 檔案可從氣象地圖 Jupyter Notebook 存放庫下載。
必要條件
如果您沒有 Azure 訂用帳戶,請在開始前建立免費帳戶。
- Azure 地圖服務帳戶
- 訂用帳戶金鑰
- Visual Studio Code
- VS Code 中 Jupyter Notebook 的工作知識
- 環境設定為在 Jupyter Notebook 中使用 Python。 如需詳細資訊,請參閱 設定您的環境。
注意
如需 Azure 地圖服務中驗證的詳細資訊,請參閱管理 Azure 地圖服務中的驗證。
安裝專案層級套件
EV 路由和可連線範圍專案具有 aioHTTP 和 IPython Python 連結庫的相依性。 您可以使用 pip 在 Visual Studio 終端機中安裝這些專案:
pip install aiohttp
pip install ipython
pip install pandas
在 Visual Studio Code 中開啟 Jupyter Notebook
接著,下載並開啟本教學課程中使用的 Notebook:
在 GitHub 的 AzureMapsJupyterSamples 存放庫中開啟 weatherDataMaps.ipynb 檔案。
選取畫面右上角的 [ 下載源檔 ] 按鈕,在本機儲存盤案。

以滑鼠右鍵按兩下檔案,然後選取 [使用 > Visual Studio Code 開啟],或透過 VS Code 檔案總管 開啟下載的 Notebook。
載入必要的模組和架構
新增程式代碼之後,您可以使用儲存格左邊的[執行] 圖示執行儲存格,而輸出會顯示在程式碼資料格下方。
執行下列文本以載入所有必要的模組和架構。
import aiohttp
import pandas as pd
import datetime
from IPython.display import Image, display

匯入天氣資料
本教學課程使用安裝在四個不同風力發電機組上的感應器所傳來的天氣資料數據。 範例資料包含 30 天的天氣數據。 這些數據是從每個發電機組位置附近的天氣資料中心收集而來。 示範資料包含溫度、風速和風向的資料數據。 您可以從 GitHub 下載包含在 weather_dataset_demo.csv 中的示範資料。 下列指令碼會將示範資料匯入到 Azure Notebook。
df = pd.read_csv("./data/weather_dataset_demo.csv")
要求每日預報資料
在我們的案例中,我們會要求每個感應器位置的每日預報。 下列指令碼會呼叫 Azure 地圖服務氣象服務的每日預測 API。 此 API 會針對每個風力發電機,傳回目前日期後 15 天內的氣象預報。
subscription_key = "Your Azure Maps key"

# Get a lists of unique station IDs and their coordinates
station_ids = pd.unique(df[['StationID']].values.ravel())
coords = pd.unique(df[['latitude','longitude']].values.ravel())

years,months,days = [],[],[]
dates_check=set()
wind_speeds, wind_direction = [], []

# Call azure maps Weather services to get daily forecast data for 15 days from current date
session = aiohttp.ClientSession()
j=-1
for i in range(0, len(coords), 2):
    wind_speeds.append([])
    wind_direction.append([])

    query = str(coords[i])+', '+str(coords[i+1])
    forecast_response = await(await session.get("https://atlas.microsoft.com/weather/forecast/daily/json?query={}&api-version=1.0&subscription-key={Your-Azure-Maps-Subscription-key}&duration=15".format(query, subscription_key))).json()
    j+=1
    for day in range(len(forecast_response['forecasts'])):
            date = forecast_response['forecasts'][day]['date'][:10]
            wind_speeds[j].append(forecast_response['forecasts'][day]['day']['wind']['speed']['value'])
            wind_direction[j].append(forecast_response['forecasts'][day]['day']['windGust']['direction']['degrees'])

            if date not in dates_check:
                year,month,day= date.split('-')
                years.append(year)
                months.append(month)
                days.append(day)
                dates_check.add(date)

await session.close()
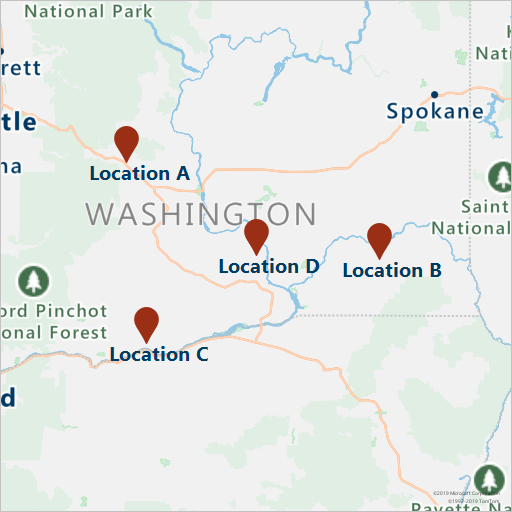
下列指令碼會藉由呼叫取得地圖影像服務,在地圖上呈現發電機組的所在位置。
# Render the turbine locations on the map by calling the Azure Maps Get Map Image service
session = aiohttp.ClientSession()
pins="default|la-25+60|ls12|lc003C62|co9B2F15||'Location A'{} {}|'Location B'{} {}|'Location C'{} {}|'Location D'{} {}".format(coords[1],coords[0],coords[3],coords[2],coords[5],coords[4], coords[7],coords[6])
image_response = "https://atlas.microsoft.com/map/static/png?subscription-key={Your-Azure-Maps-Subscription-key}&api-version=1.0&layer=basic&style=main&zoom=6¢er={},{}&pins={}".format(subscription_key,coords[7],coords[6],pins)
static_map_response = await session.get(image_response)
poi_range_map = await static_map_response.content.read()
await session.close()
display(Image(poi_range_map))
根據工作站的識別碼,將示範資料分組成預測資料。 工作站識別碼代表天氣資料中心。 此分組動作會使用預測資料來擴充示範資料。
# Group forecasted data for all locations
df = df.reset_index(drop=True)
forecast_data = pd.DataFrame(columns=['StationID','latitude','longitude','Year','Month','Day','DryBulbCelsius','WetBulbFarenheit','WetBulbCelsius','DewPointFarenheit','DewPointCelsius','RelativeHumidity','WindSpeed','WindDirection'])

for i in range(len(station_ids)):
    loc_forecast = pd.DataFrame({'StationID':station_ids[i], 'latitude':coords[0], 'longitude':coords[1], 'Year':years, 'Month':months, 'Day':days, 'WindSpeed':wind_speeds[i], 'WindDirection':wind_direction[i]})
    forecast_data = pd.concat([forecast_data,loc_forecast], axis=0, sort=False)

combined_weather_data = pd.concat([df,forecast_data])
grouped_weather_data = combined_weather_data.groupby(['StationID'])
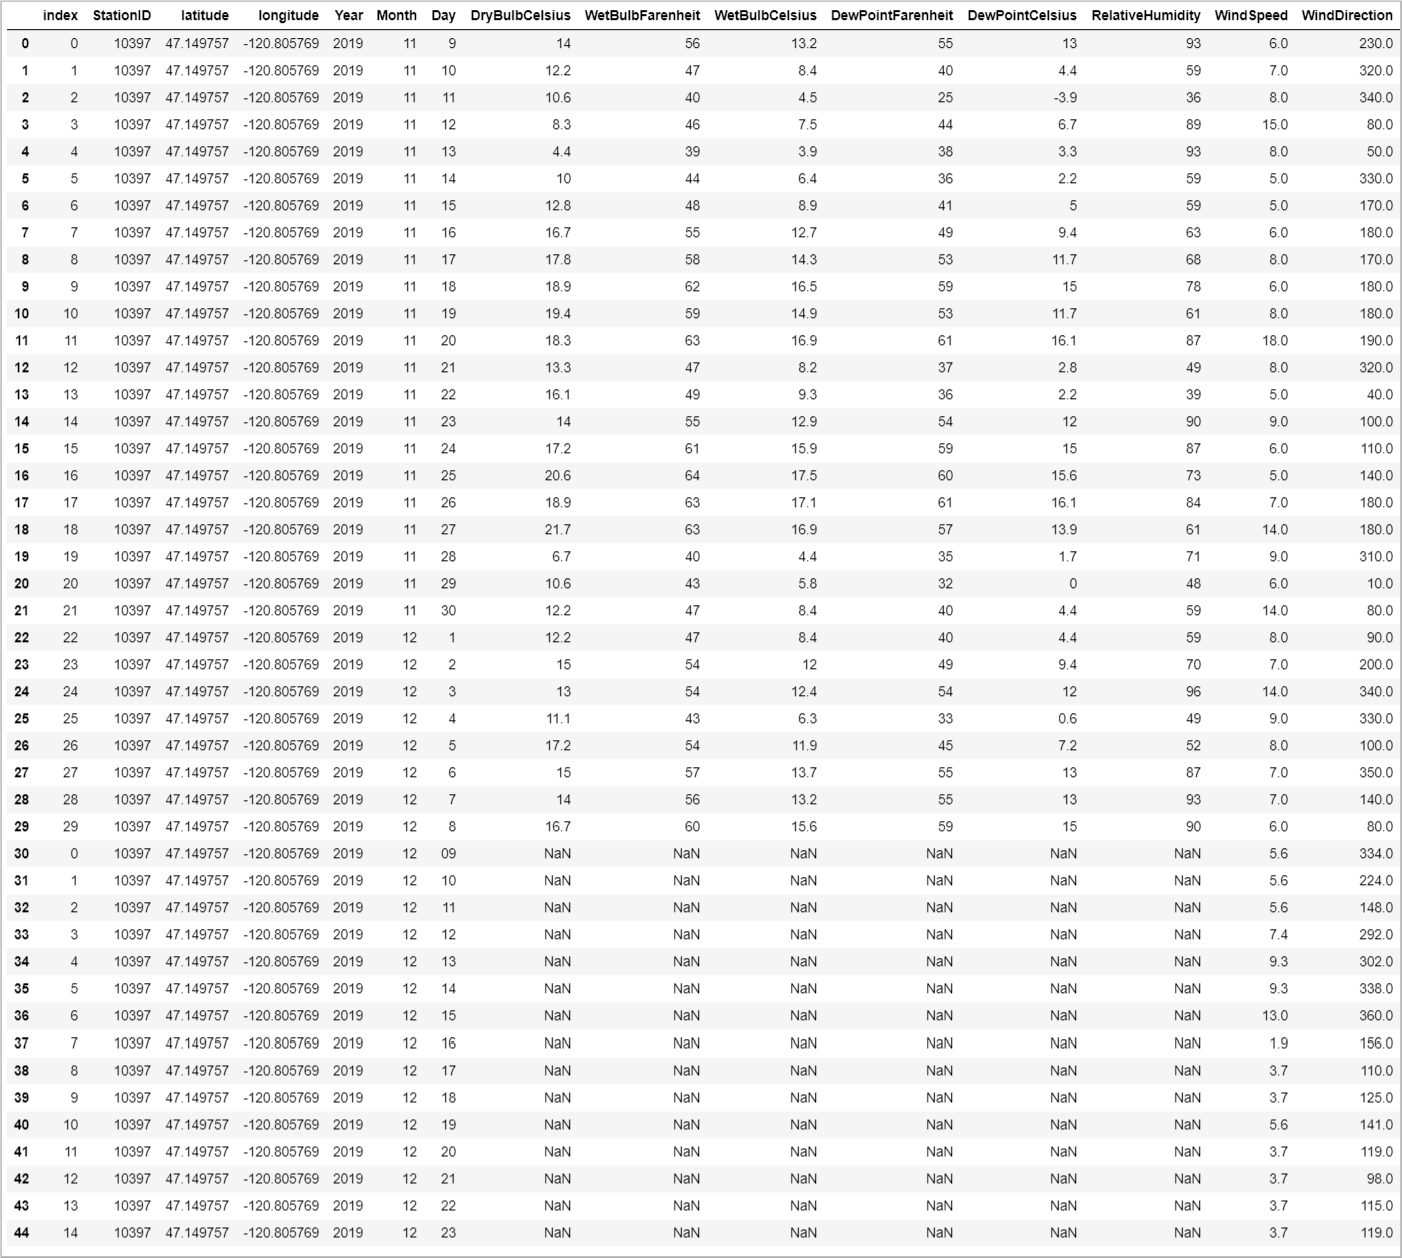
下表顯示其中一個發電機組所在位置的歷史和預報合併資料。
# Display data for first location
grouped_weather_data.get_group(station_ids[0]).reset_index()
繪製預報資料
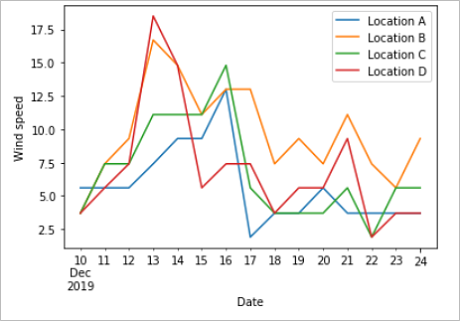
根據預測日期,將預測值繪製成圖。 此圖可讓我們在接下來的 15 天內查看風的速度和方向變更。
# Plot wind speed
curr_date = datetime.datetime.now().date()
windsPlot_df = pd.DataFrame({ 'Location A': wind_speeds[0], 'Location B': wind_speeds[1], 'Location C': wind_speeds[2], 'Location D': wind_speeds[3]}, index=pd.date_range(curr_date,periods=15))
windsPlot = windsPlot_df.plot.line()
windsPlot.set_xlabel("Date")
windsPlot.set_ylabel("Wind speed")
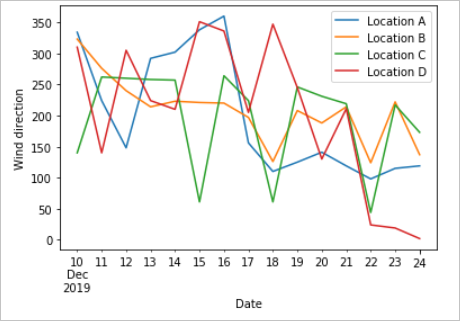
#Plot wind direction
windsPlot_df = pd.DataFrame({ 'Location A': wind_direction[0], 'Location B': wind_direction[1], 'Location C': wind_direction[2], 'Location D': wind_direction[3]}, index=pd.date_range(curr_date,periods=15))
windsPlot = windsPlot_df.plot.line()
windsPlot.set_xlabel("Date")
windsPlot.set_ylabel("Wind direction")
下圖將預測資料視覺化。 針對風速的變更,請參閱左側圖表。 針對風向的變更,請參閱右側圖表。 這些資料是資料索取當天後 15 天的預測。
在本教學課程中,您已了解如何呼叫 Azure 地圖服務 REST API 來取得氣象預報資料。 您也了解如何將圖表上的資料視覺化。
若要探索此教學課程中所使用的 Azure 地圖服務 API,請參閱:
如需 Azure 地圖服務 REST API 的完整清單,請參閱 Azure 地圖服務 REST API \(部分機器翻譯\)。