Send Guest OS metrics to the Azure Monitor metrics database for a Windows virtual machine (classic)
Note
We recommend that you use the Azure Az PowerShell module to interact with Azure. To get started, see Install Azure PowerShell. To learn how to migrate to the Az PowerShell module, see Migrate Azure PowerShell from AzureRM to Az.
The Azure Monitor Diagnostics extension (known as "WAD" or "Diagnostics") allows you to collect metrics and logs from the guest operating system (Guest OS) running as part of a virtual machine, cloud service, or Service Fabric cluster. The extension can send telemetry to many different locations.
This article describes the process for sending Guest OS performance metrics for a Windows virtual machine (classic) to the Azure Monitor metric database. Starting with Diagnostics version 1.11, you can write metrics directly to the Azure Monitor metrics store, where standard platform metrics are already collected.
Storing them in this location allows you to access the same actions as you do for platform metrics. Actions include near-real time alerting, charting, routing, access from a REST API, and more. In the past, the Diagnostics extension wrote to Azure Storage, but not to the Azure Monitor data store.
The process that's outlined in this article only works on classic virtual machines that are running the Windows operating system.
Prerequisites
You must be a service administrator or co-administrator on your Azure subscription.
Your subscription must be registered with Microsoft.Insights.
You need to have either Azure PowerShell or Azure Cloud Shell installed.
Create a classic virtual machine and storage account
Create a classic VM by using the Azure portal.
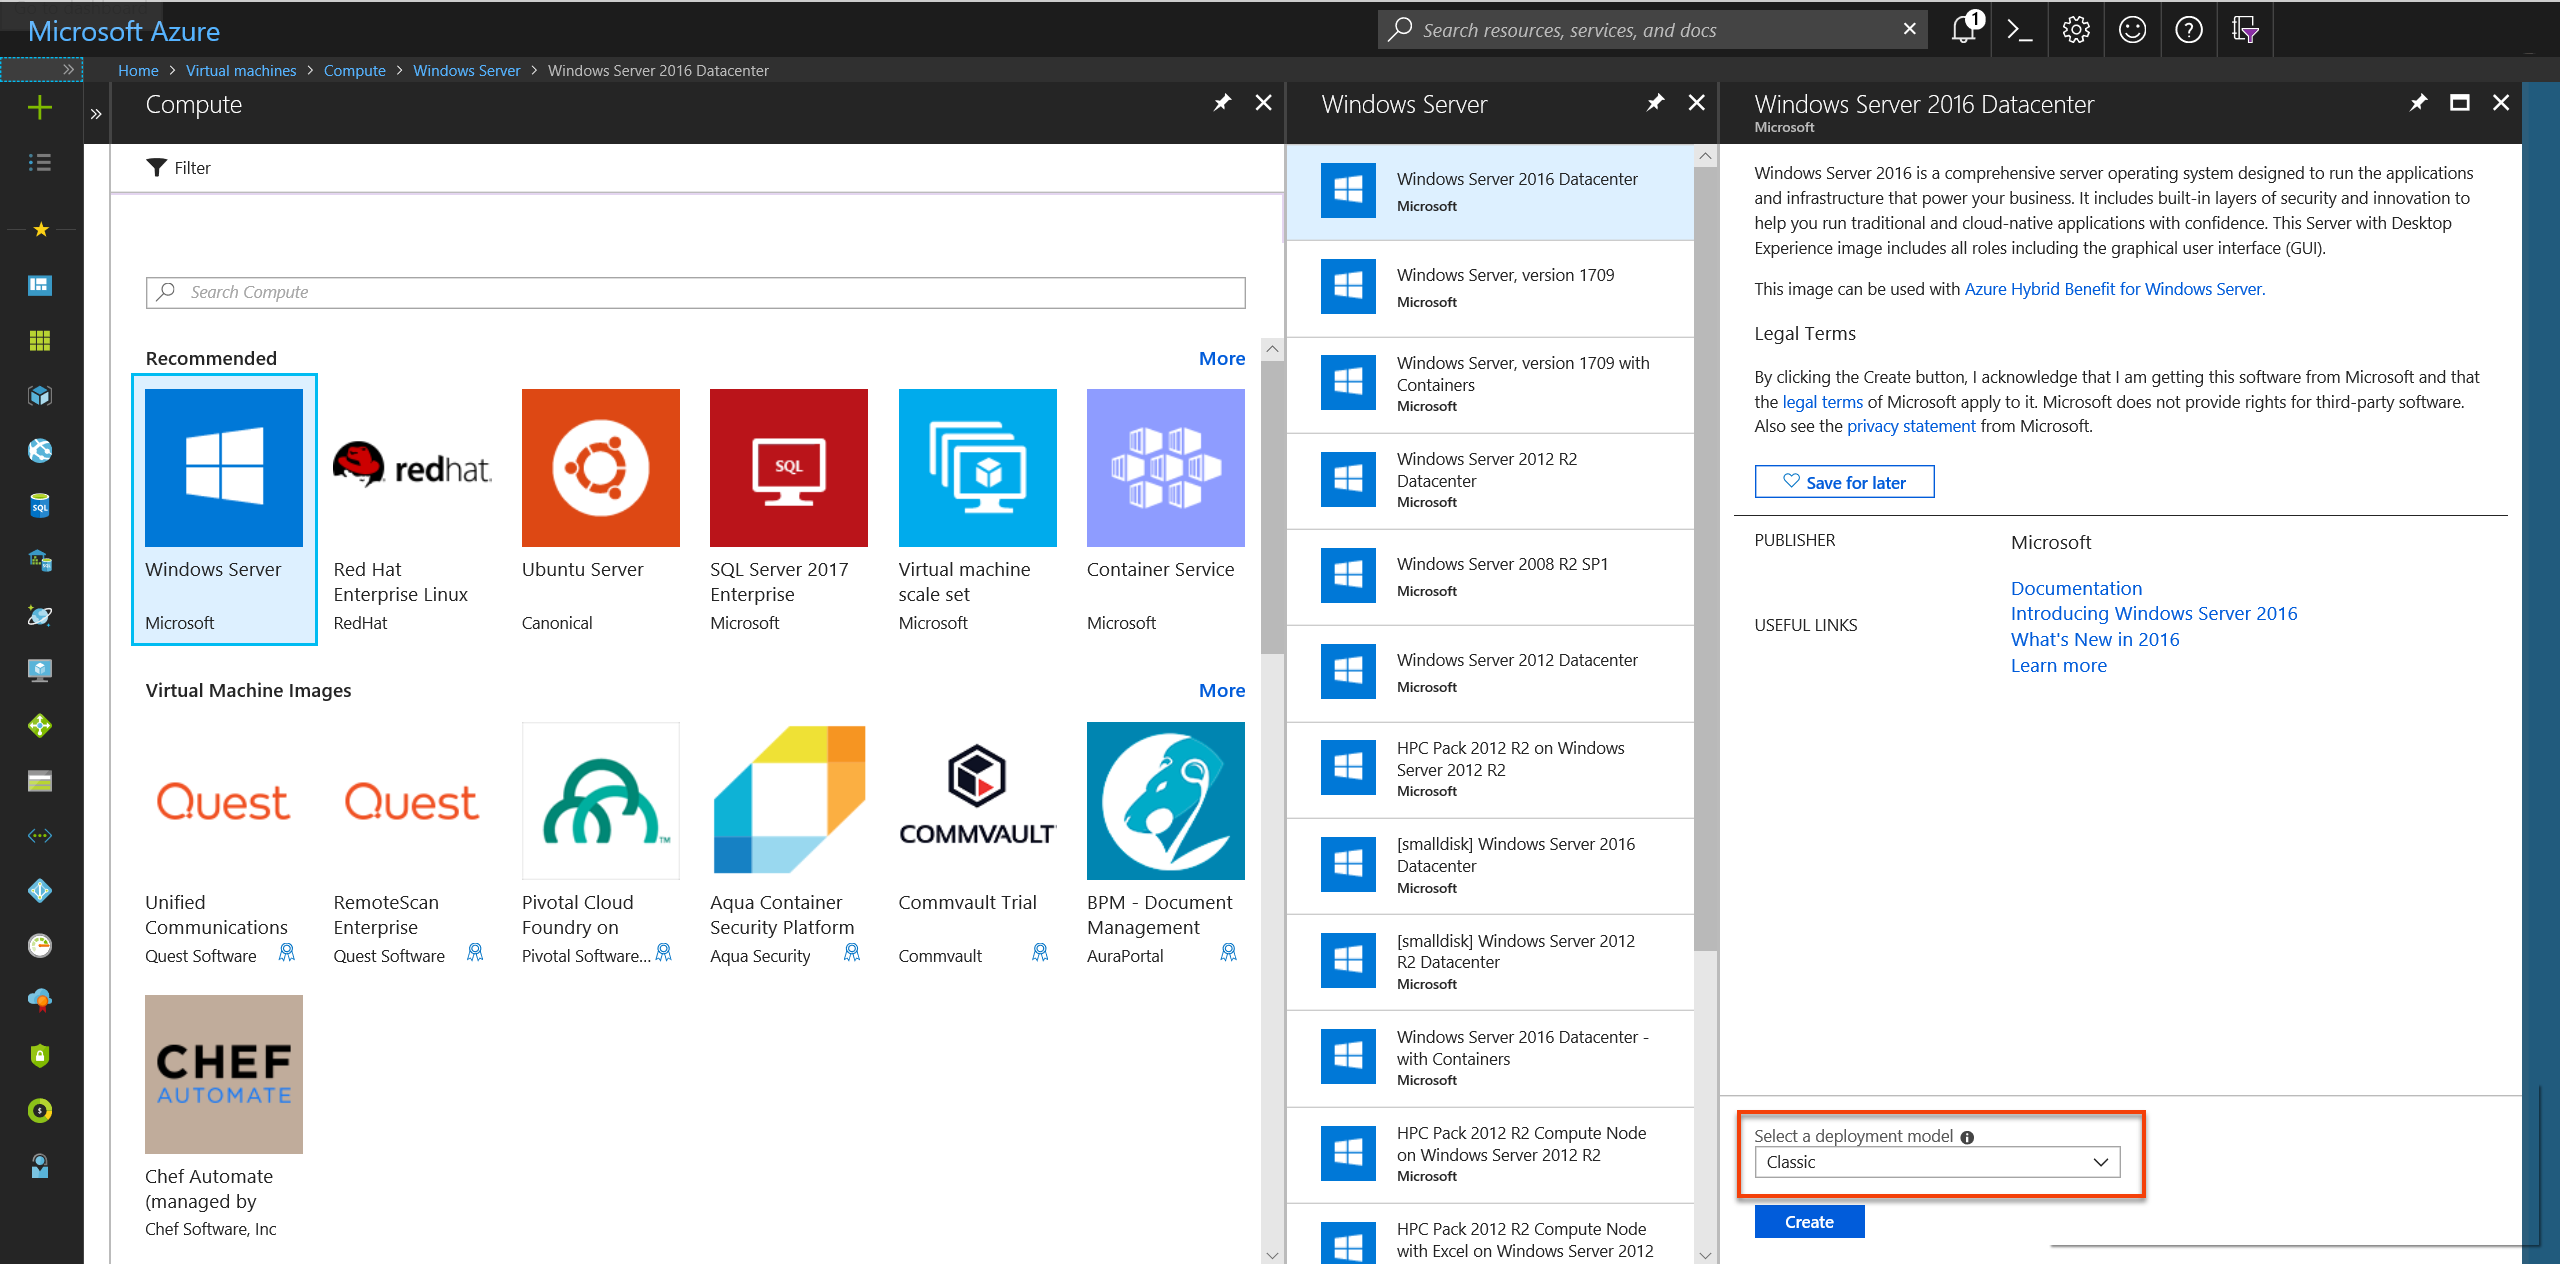
When you're creating this VM, choose the option to create a new classic storage account. We use this storage account in later steps.
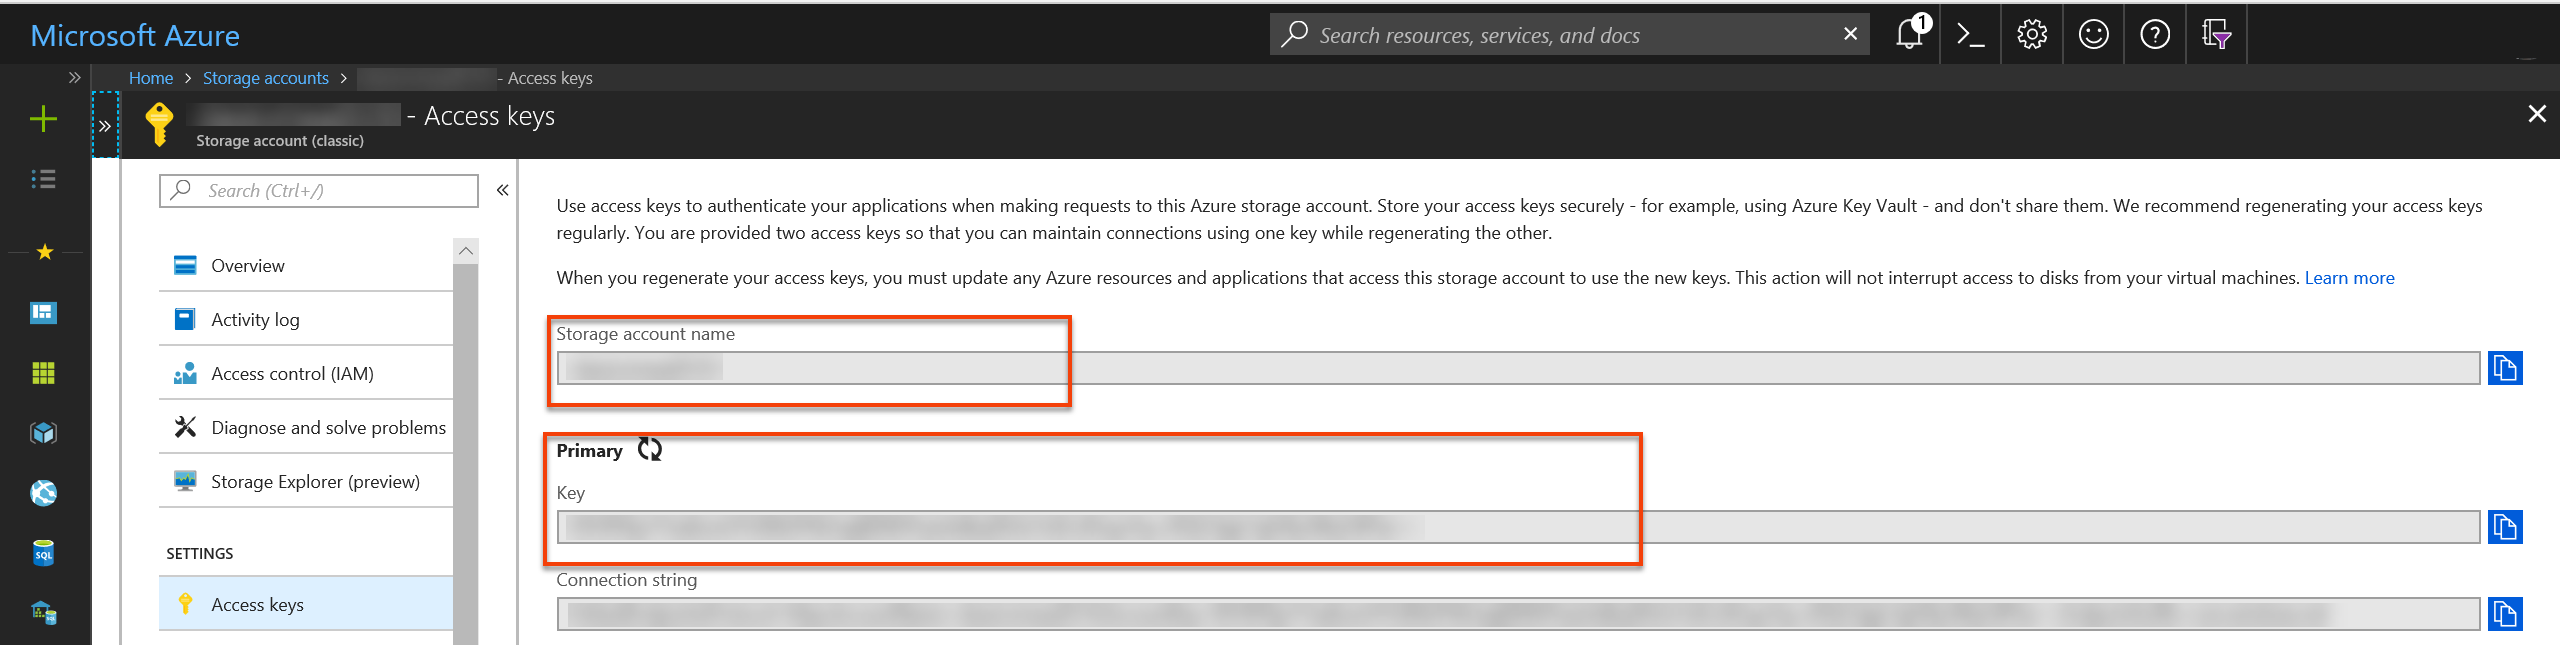
In the Azure portal, go to the Storage accounts resource pane. Select Keys, and take note of the storage account name and storage account key. You need this information in later steps.


Create a service principal
Create a service principal in your Microsoft Entra tenant by using the instructions at Create a service principal. Note the following while going through this process:
- Create new client secret for this app.
- Save the key and the client ID for use in later steps.
Give this app “Monitoring Metrics Publisher” permissions to the resource that you want to emit metrics against. You can use a resource group or an entire subscription.
Note
The Diagnostics extension uses the service principal to authenticate against Azure Monitor and emit metrics for your classic VM.
Author Diagnostics extension configuration
Prepare your Diagnostics extension configuration file. This file dictates which logs and performance counters the Diagnostics extension should collect for your classic VM. Following is an example:
<?xml version="1.0" encoding="utf-8"?>
<DiagnosticsConfiguration xmlns="http://schemas.microsoft.com/ServiceHosting/2010/10/DiagnosticsConfiguration">
<PublicConfig xmlns="http://schemas.microsoft.com/ServiceHosting/2010/10/DiagnosticsConfiguration">
    <WadCfg>
    <DiagnosticMonitorConfiguration overallQuotaInMB="4096" sinks="applicationInsights.errors">
        <DiagnosticInfrastructureLogs scheduledTransferLogLevelFilter="Error" />
        <Directories scheduledTransferPeriod="PT1M">
            <IISLogs containerName="wad-iis-logfiles" />
            <FailedRequestLogs containerName="wad-failedrequestlogs" />
        </Directories>
        <PerformanceCounters scheduledTransferPeriod="PT1M">
            <PerformanceCounterConfiguration counterSpecifier="\Processor(*)\% Processor Time" sampleRate="PT15S" />
            <PerformanceCounterConfiguration counterSpecifier="\Memory\Available Bytes" sampleRate="PT15S" />
            <PerformanceCounterConfiguration counterSpecifier="\Memory\Committed Bytes" sampleRate="PT15S" />
            <PerformanceCounterConfiguration counterSpecifier="\Memory\% Committed Bytes" sampleRate="PT15S" />
            <PerformanceCounterConfiguration counterSpecifier="\LogicalDisk(*)\Disk Read Bytes/sec" sampleRate="PT15S" />
        </PerformanceCounters>
        <WindowsEventLog scheduledTransferPeriod="PT1M">
            <DataSource name="Application!*[System[(Level=1 or Level=2 or Level=3)]]" />
            <DataSource name="Windows Azure!*[System[(Level=1 or Level=2 or Level=3 or Level=4)]]" />
        </WindowsEventLog>
        <CrashDumps>
            <CrashDumpConfiguration processName="WaIISHost.exe" />
            <CrashDumpConfiguration processName="WaWorkerHost.exe" />
            <CrashDumpConfiguration processName="w3wp.exe" />
        </CrashDumps>
        <Logs scheduledTransferPeriod="PT1M" scheduledTransferLogLevelFilter="Error" />
        <Metrics resourceId="/subscriptions/xxxxxxxx-xxxx-xxxx-xxxx-xxxxxxxxxxxx/resourceGroups/MyResourceGroup/providers/Microsoft.ClassicCompute/virtualMachines/MyClassicVM">
            <MetricAggregation scheduledTransferPeriod="PT1M" />
            <MetricAggregation scheduledTransferPeriod="PT1H" />
        </Metrics>
    </DiagnosticMonitorConfiguration>
    <SinksConfig>
    </SinksConfig>
    </WadCfg>
    <StorageAccount />
</PublicConfig>
<PrivateConfig xmlns="http://schemas.microsoft.com/ServiceHosting/2010/10/DiagnosticsConfiguration">
    <StorageAccount name="" endpoint="" />
</PrivateConfig>
<IsEnabled>true</IsEnabled>
</DiagnosticsConfiguration>
In the “SinksConfig” section of your diagnostics file, define a new Azure Monitor sink, as follows:
<SinksConfig>
    <Sink name="AzMonSink">
        <AzureMonitor>
            <ResourceId>Provide the resource ID of your classic VM </ResourceId>
            <Region>The region your VM is deployed in</Region>
        </AzureMonitor>
    </Sink>
</SinksConfig>
In the section of your configuration file where the list of performance counters to be collected is listed, route the performance counters to the Azure Monitor sink "AzMonSink".
<PerformanceCounters scheduledTransferPeriod="PT1M" sinks="AzMonSink">
    <PerformanceCounterConfiguration counterSpecifier="\Processor(_Total)\% Processor Time" sampleRate="PT15S" />
...
</PerformanceCounters>
In the private configuration, define the Azure Monitor account. Then add the service principal information to use to emit metrics.
<PrivateConfig xmlns="http://schemas.microsoft.com/ServiceHosting/2010/10/DiagnosticsConfiguration">
<StorageAccount name="" endpoint="" />
    <AzureMonitorAccount>
        <ServicePrincipalMeta>
            <PrincipalId>clientId for your service principal</PrincipalId>
            <Secret>client secret of your service principal</Secret>
        </ServicePrincipalMeta>
    </AzureMonitorAccount>
</PrivateConfig>
Save this file locally.
Deploy the Diagnostics extension to your cloud service
Launch PowerShell and sign in.
Login-AzAccountStart by setting the context for your classic VM.
$VM = Get-AzureVM -ServiceName <VM’s Service_Name> -Name <VM Name>Set the context of the classic storage account that was created with the VM.
$StorageContext = New-AzStorageContext -StorageAccountName <name of your storage account from earlier steps> -storageaccountkey "<storage account key from earlier steps>"Set the Diagnostics file path to a variable by using the following command:
$diagconfig = “<path of the diagnostics configuration file with the Azure Monitor sink configured>”Prepare the update for your classic VM with the diagnostics file that has the Azure Monitor sink configured.
$VM_Update = Set-AzureVMDiagnosticsExtension -DiagnosticsConfigurationPath $diagconfig -VM $VM -StorageContext $Storage_ContextDeploy the update to your VM by running the following command:
Update-AzureVM -ServiceName "ClassicVMWAD7216" -Name "ClassicVMWAD" -VM $VM_Update.VM
Note
It is still mandatory to provide a storage account as part of the installation of the Diagnostics extension. Any logs or performance counters that are specified in the Diagnostics config file will be written to the specified storage account.
Plot the metrics in the Azure portal
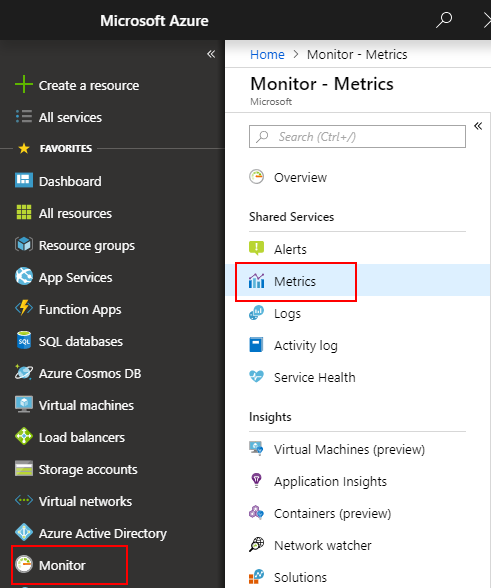
Go to the Azure portal.
On the left menu, select Monitor.
On the Monitor pane on the left, select Metrics.
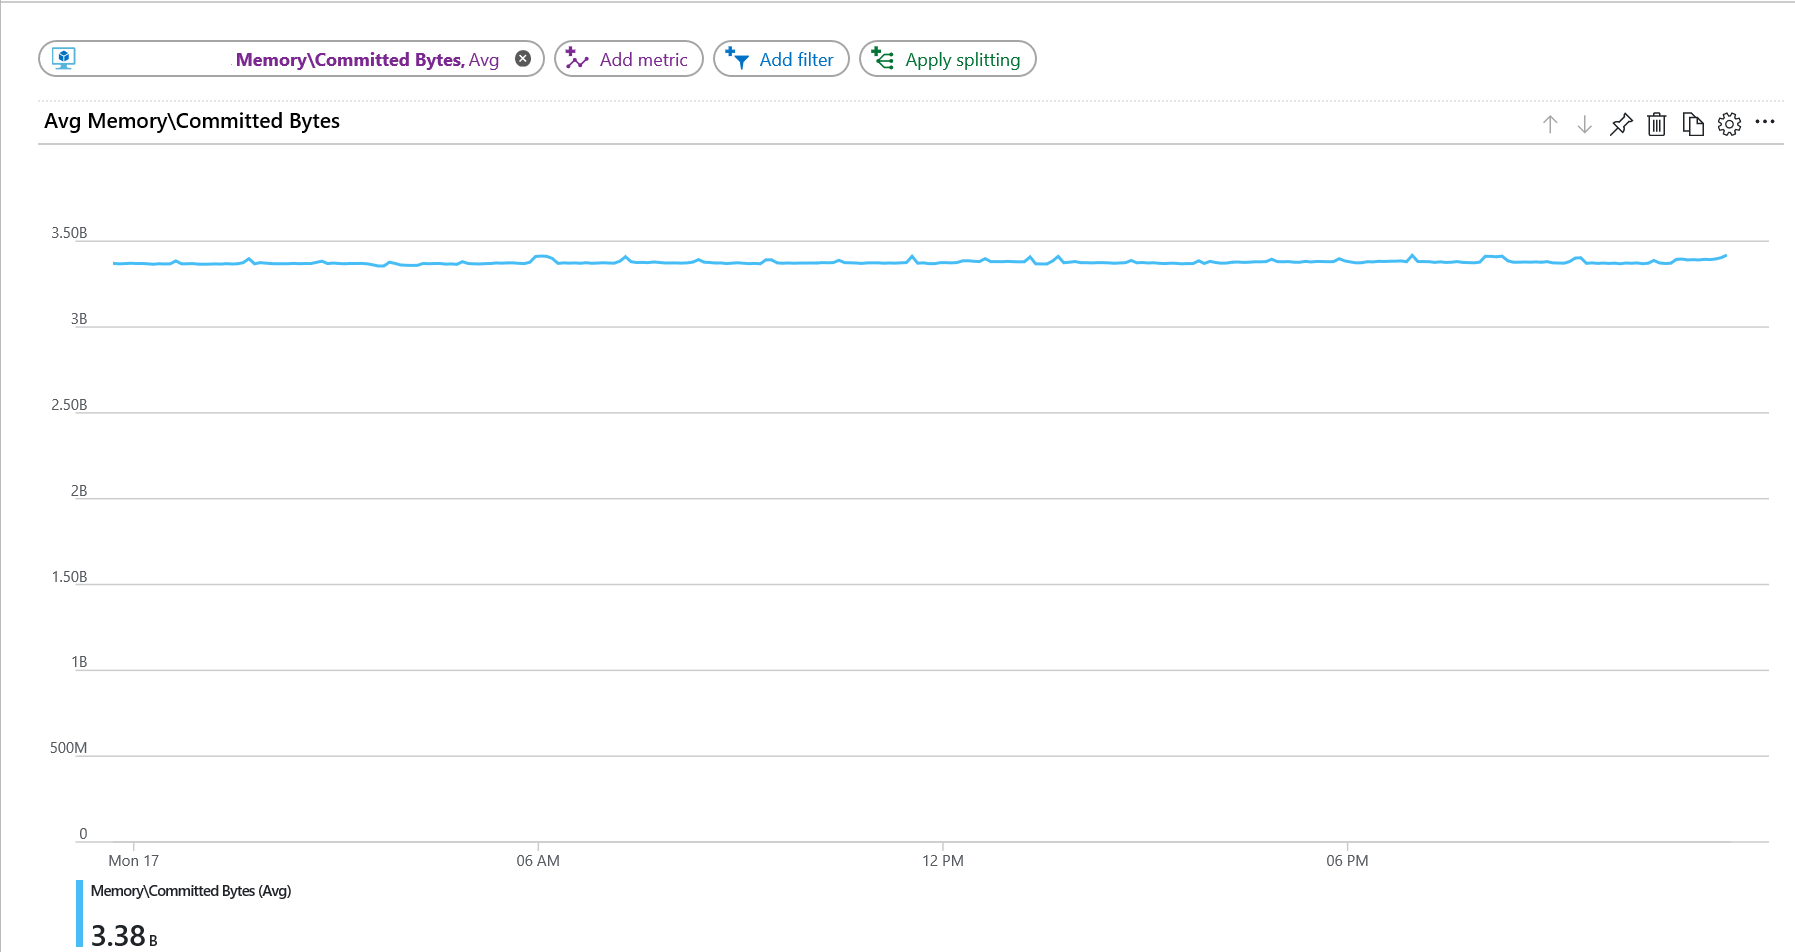
In the resources drop-down menu, select your classic VM.
In the namespaces drop-down menu, select azure.vm.windows.guest.
In the metrics drop-down menu, select Memory\Committed Bytes in Use.


Next steps
- Learn more about custom metrics.