
![螢幕擷取畫面顯示先選取 [監視] 再選取 [計量] 的 Azure 入口網站。](media/collect-custom-metrics-guestos-vm-cloud-service-classic/navigate-metrics.png#lightbox)
事件
將客體作業系統計量傳送至 Azure 監視器計量存放區的傳統雲端服務
注意
建議您使用 Azure Az PowerShell 模組來與 Azure 互動。 若要開始使用,請參閱安裝 Azure PowerShell (部分機器翻譯)。 若要了解如何移轉至 Az PowerShell 模組,請參閱將 Azure PowerShell 從 AzureRM 移轉至 Az。
您可以使用 Azure 監視器診斷擴充功能,從當作虛擬機器、雲端服務或 Service Fabric 叢集一部分執行的客體作業系統 (客體 OS) 收集計量與記錄。 擴充功能可以將遙測資料傳送到許多不同位置。
本文說明將 Azure 傳統雲端服務的客體 OS 效能計量傳送至 Azure 監視器計量存放區的程序。 從診斷 1.11 版開始,您可以直接將計量寫入到已收集標準平台計量的 Azure 監視器計量存放區。
將計量儲存在此位置,可讓您存取與您可對平台計量執行的相同動作。 動作包括近乎即時的警示、圖表、路由、從 REST API 存取以及更多功能。 在過去,診斷擴充功能會寫入到 Azure 儲存體,而不是 Azure 監視器資料存放區。
本文中所述的程序僅適用於 Azure 雲端服務中的效能計數器。 不適合用於其他自訂計量。
您必須是 Azure 訂用帳戶的服務管理員或共同管理員。
您必須先向 Microsoft.Insights 註冊您的訂用帳戶。
您需要安裝 Azure PowerShell 或 Azure Cloud Shell。
建立及部署傳統雲端服務。 您可以在開始使用 Azure 雲端服務和 ASP.NET 找到範例傳統雲端服務應用程式和部署。
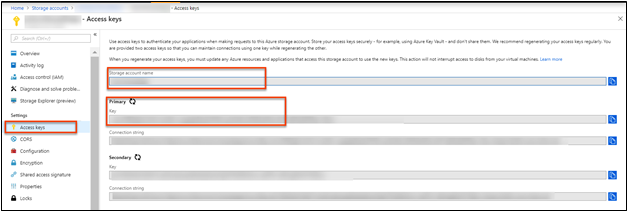
您可以使用現有的儲存體帳戶或部署新的儲存體帳戶。 儲存體帳戶最好能與您建立的傳統雲端服務位於相同的區域中。 在 Azure 入口網站中,移至 [儲存體帳戶] 資源窗格,然後選取 [金鑰]。 記下儲存體帳戶名稱和儲存體帳戶金鑰。 稍後的步驟將會需要這項資訊。
使用使用入口網站來建立可存取資源的 Microsoft Entra 應用程式和服務主體中的指示,在 Microsoft Entra 租用戶中建立服務主體。 進行此流程時,請注意下列事項:
- 您可以將任何 URL 填入為登入 URL。
- 為此應用程式建立新用戶端密碼。
- 儲存金鑰與用戶端識別碼,以便在稍後的步驟中使用。
針對您希望發出計量的資源,將其「監視計量發行者」權限授與在上一個步驟中建立的應用程式。 如果您計劃使用該應用程式對許多資源發出自訂計量,您可以在資源群組或訂用帳戶層級上授與這些權限。
注意
診斷擴充功能會使用服務主體,對 Azure 監視器驗證,並發出雲端服務的計量。
準備診斷擴充功能組態檔。 此檔案指定診斷擴充功能應為雲端服務收集的記錄與效能計數器。 以下是範例診斷組態檔:
XML
<?xml version="1.0" encoding="utf-8"?>
<DiagnosticsConfiguration xmlns="http://schemas.microsoft.com/ServiceHosting/2010/10/DiagnosticsConfiguration">
  <PublicConfig xmlns="http://schemas.microsoft.com/ServiceHosting/2010/10/DiagnosticsConfiguration">
    <WadCfg>
      <DiagnosticMonitorConfiguration overallQuotaInMB="4096">
        <DiagnosticInfrastructureLogs scheduledTransferLogLevelFilter="Error" />
        <Directories scheduledTransferPeriod="PT1M">
          <IISLogs containerName="wad-iis-logfiles" />
          <FailedRequestLogs containerName="wad-failedrequestlogs" />
        </Directories>
        <PerformanceCounters scheduledTransferPeriod="PT1M">
          <PerformanceCounterConfiguration counterSpecifier="\Processor(_Total)\% Processor Time" sampleRate="PT15S" />
          <PerformanceCounterConfiguration counterSpecifier="\Memory\Available MBytes" sampleRate="PT15S" />
          <PerformanceCounterConfiguration counterSpecifier="\Memory\Committed Bytes" sampleRate="PT15S" />
          <PerformanceCounterConfiguration counterSpecifier="\Memory\Page Faults/sec" sampleRate="PT15S" />
        </PerformanceCounters>
        <WindowsEventLog scheduledTransferPeriod="PT1M">
          <DataSource name="Application!*[System[(Level=1 or Level=2 or Level=3)]]" />
          <DataSource name="Windows Azure!*[System[(Level=1 or Level=2 or Level=3 or Level=4)]]" />
        </WindowsEventLog>
        <CrashDumps>
          <CrashDumpConfiguration processName="WaIISHost.exe" />
          <CrashDumpConfiguration processName="WaWorkerHost.exe" />
          <CrashDumpConfiguration processName="w3wp.exe" />
        </CrashDumps>
        <Logs scheduledTransferPeriod="PT1M" scheduledTransferLogLevelFilter="Error" />
      </DiagnosticMonitorConfiguration>
      <SinksConfig>
      </SinksConfig>
    </WadCfg>
    <StorageAccount />
  </PublicConfig>
  <PrivateConfig xmlns="http://schemas.microsoft.com/ServiceHosting/2010/10/DiagnosticsConfiguration">
    <StorageAccount name="" endpoint="" />
</PrivateConfig>
  <IsEnabled>true</IsEnabled>
</DiagnosticsConfiguration>
在診斷檔案的 "SinksConfig" 區段中,定義新的 Azure 監視器接收:
XML
  <SinksConfig>
    <Sink name="AzMonSink">
    <AzureMonitor>
      <ResourceId>-Provide ClassicCloudService’s Resource ID-</ResourceId>
      <Region>-Azure Region your Cloud Service is deployed in-</Region>
    </AzureMonitor>
    </Sink>
  </SinksConfig>
在組態檔列出所要收集之效能計數器的區段中,新增 Azure 監視器接收。 此項目可確保將您指定的所有效能計數器作為計量,路由傳送到 Azure 監視器。 您可以根據需求新增或移除效能計數器。
XML
    <PerformanceCounters scheduledTransferPeriod="PT1M" sinks="AzMonSink">
        <PerformanceCounterConfiguration counterSpecifier="\Processor(_Total)\% Processor Time" sampleRate="PT15S" />
    ...
    </PerformanceCounters>
最後,在私人設定中,新增 [Azure 監視器帳戶] 區段。 輸入先前建立的服務主體用戶端識別碼和密碼。
XML
<PrivateConfig xmlns="http://schemas.microsoft.com/ServiceHosting/2010/10/DiagnosticsConfiguration">
  <StorageAccount name="" endpoint="" />
    <AzureMonitorAccount>
      <ServicePrincipalMeta>
        <PrincipalId>clientId from step 3</PrincipalId>
        <Secret>client secret from step 3</Secret>
      </ServicePrincipalMeta>
    </AzureMonitorAccount>
</PrivateConfig>
在本機儲存此診斷檔案。
啟動 PowerShell 並登入 Azure。
PowerShell
Login-AzAccount
使用下列命令來儲存您稍早建立的儲存體帳戶詳細資料。
PowerShell
$storage_account = <name of your storage account from step 3>
$storage_keys = <storage account key from step 3>
同樣地,使用下列命令,將診斷檔案路徑設定為變數:
PowerShell
$diagconfig = “<path of the Diagnostics configuration file with the Azure Monitor sink configured>”
透過使用下列命令設定的 Azure 監視器接收,使用診斷檔案將診斷擴充功能部署到您的雲端服務:
PowerShell
Set-AzureServiceDiagnosticsExtension -ServiceName <classicCloudServiceName> -StorageAccountName $storage_account -StorageAccountKey $storage_keys -DiagnosticsConfigurationPath $diagconfig
注意
在安裝診斷擴充功能期間,仍會強制您提供儲存體帳戶。 診斷組態檔中指定的任何記錄或效能計數器,都會寫入指定的儲存體帳戶。
前往 Azure 入口網站。
![螢幕擷取畫面顯示先選取 [監視] 再選取 [計量] 的 Azure 入口網站。](media/collect-custom-metrics-guestos-vm-cloud-service-classic/navigate-metrics.png)
在左側功能表上,選取 [監視]。
在 [監視] 窗格上,選取 [計量預覽] 索引標籤。
在 [資源] 下拉式功能表中,選取您的傳統雲端服務。
在 [命名空間] 下拉式功能表中,選取 azure.vm.windows.guest。
在 [計量] 下拉式功能表中,選取 [記憶體\認可的位元組 (使用中)]。
您可使用維度篩選與分割功能,檢視特定角色或角色執行個體所使用的記憶體總數。

- 深入了解自訂計量。
其他資源
訓練
文件
-
Azure 監視器記錄參考 - AGSGrafanaLoginEvents - Azure Monitor
Azure 監視器記錄中的 AGSGrafanaLoginEvents 數據表參考。
-
Azure 監視器記錄參考 - AppAvailabilityResults - Azure Monitor
Azure 監視器記錄中 AppAvailabilityResults 數據表的參考。
-
構成 Azure 服務和應用程式之完整監視策略的各種 Microsoft 服務和功能的概觀。
-
支援的記錄類別 - Microsoft.Automation/automationAccounts - Azure Monitor
Azure 監視器記錄中Microsoft.Automation/automationAccounts 的參考。