整合 Log Analytics 與 Excel
您可以使用 M 查詢和 Log Analytics API,來整合 Azure 監視器 Log Analytics 和 Microsoft Excel。 這項整合可讓您傳送特定數目的記錄和 MB 的資料。 這些限制記載於 Azure 入口網站 一節中的 Azure 監視器 Log Analytics 工作區限制中。
注意
Excel 是本地用戶端應用程式,因此本地硬體和軟體限制會影響其效能和處理大型資料集的能力。
必要條件
若要整合 Log Analytics 和 Excel,您需要:
- Excel 本機用戶端應用程式。
- 包含一些資料的 Log Analytics 工作區。 如有需要,請建立診斷設定以將資料傳送至 Log Analytics 工作區。
需要的權限
例如,對於查詢的 Log Analytics 工作區,您必須擁有 Microsoft.OperationalInsights/workspaces/query/*/read 權限,如 Log Analytics 讀取器內建角色所提供。
在 Log Analytics 中建立 M 查詢
就像平常一樣,在記錄分析中建立並執行查詢。 如果您達到使用者介面中的記錄數目限制,請不要擔心。 建議您使用相對日期,例如「ago」函數或 UI 時間選擇器,因此 Excel 會重新整理正確的資料集。
匯出查詢 - 一旦您滿意查詢及其結果之後,請使用 [匯出] 功能表下的 Log Analytics [匯出至 Power BI (M 查詢)] 功能表選擇,將查詢匯出至 M:
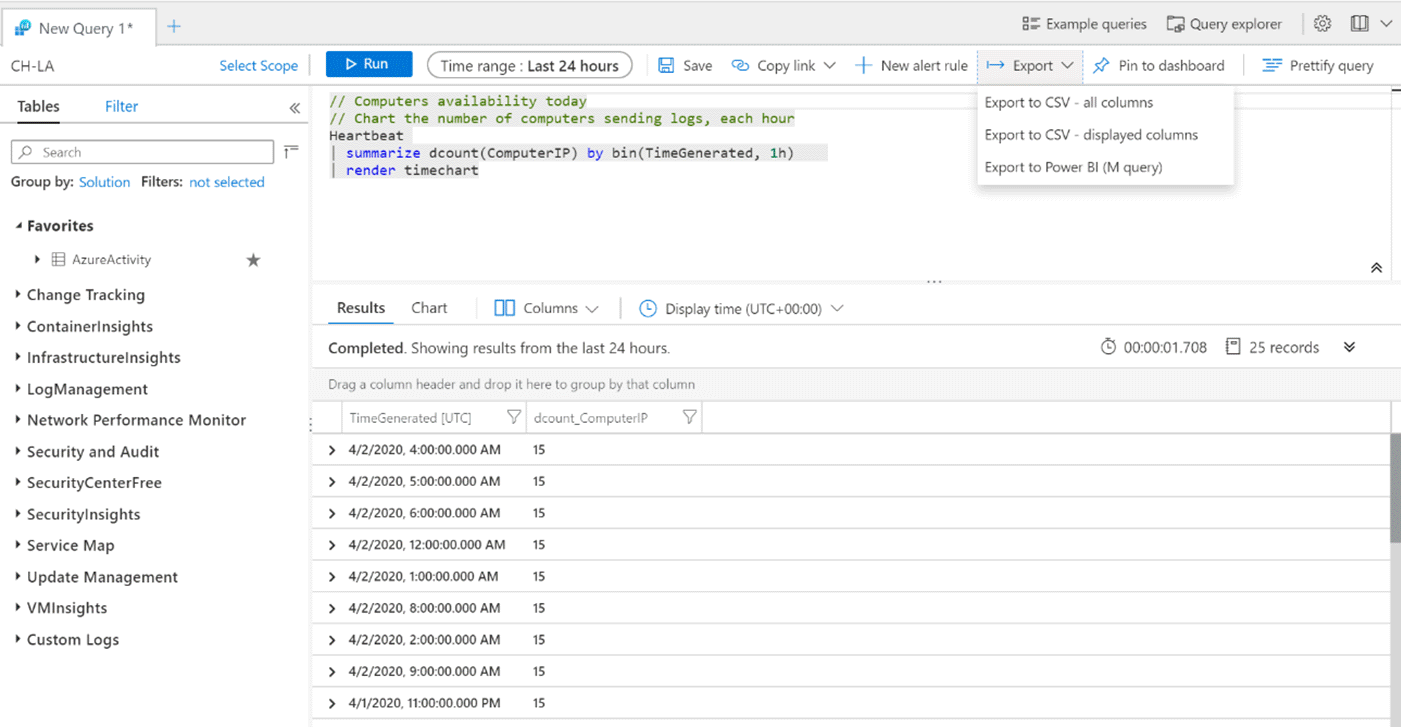
選擇此選項會下載 .txt 檔案,其中包含您可以在 Excel 中使用的 M 程式碼。
上述查詢會匯出下列 M 程式碼。 以下是針對範例中查詢匯出的 M 程式碼範例:
/*
The exported Power Query Formula Language (M Language ) can be used with Power Query in Excel
and Power BI Desktop.
For Power BI Desktop follow the instructions below:
1) Download Power BI Desktop from https://powerbi.microsoft.com/desktop/
2) In Power BI Desktop select: 'Get Data' -> 'Blank Query'->'Advanced Query Editor'
3) Paste the M Language script into the Advanced Query Editor and select 'Done'
*/

let AnalyticsQuery =
let Source = Json.Document(Web.Contents("https://api.loganalytics.io/v1/workspaces/ddcfc599-cae0-48ee-9026-fffffffffffff/query",
[Query=[#"query"="

Heartbeat
| summarize dcount(ComputerIP) by bin(TimeGenerated, 1h)
| render timechart
",#"x-ms-app"="OmsAnalyticsPBI",#"timespan"="P1D",#"prefer"="ai.response-thinning=true"],Timeout=#duration(0,0,4,0)])),
TypeMap = #table(
{ "AnalyticsTypes", "Type" },
{
{ "string",   Text.Type },
{ "int",      Int32.Type },
{ "long",     Int64.Type },
{ "real",     Double.Type },
{ "timespan", Duration.Type },
{ "datetime", DateTimeZone.Type },
{ "bool",     Logical.Type },
{ "guid",     Text.Type },
{ "dynamic",  Text.Type }
}),
DataTable = Source[tables]{0},
Columns = Table.FromRecords(DataTable[columns]),
ColumnsWithType = Table.Join(Columns, {"type"}, TypeMap , {"AnalyticsTypes"}),
Rows = Table.FromRows(DataTable[rows], Columns[name]),
Table = Table.TransformColumnTypes(Rows, Table.ToList(ColumnsWithType, (c) => { c{0}, c{3}}))
in
Table
in AnalyticsQuery
將查詢連線至 Excel
若要匯入查詢。
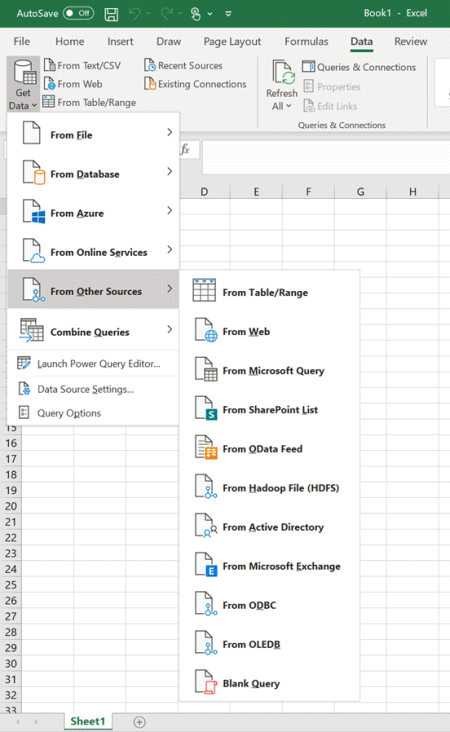
開啟 Microsoft Excel。
在功能區中,移至 [資料] 功能表。 選取 [取得資料]。 從 [其他來源] 選取 [空白查詢]:
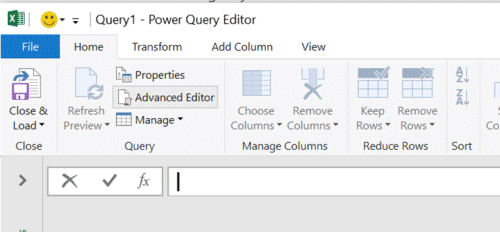
在 [Power Query] 視窗中,選取 [進階編輯器]:
將進階編輯器中的文字取代為從 Log Analytics 匯出的查詢:
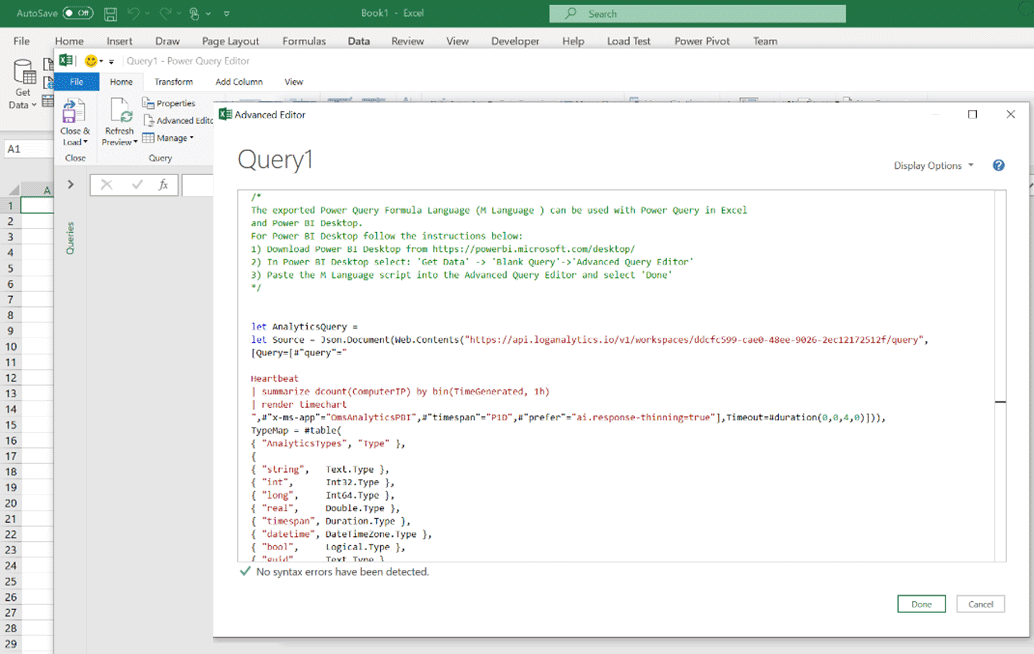
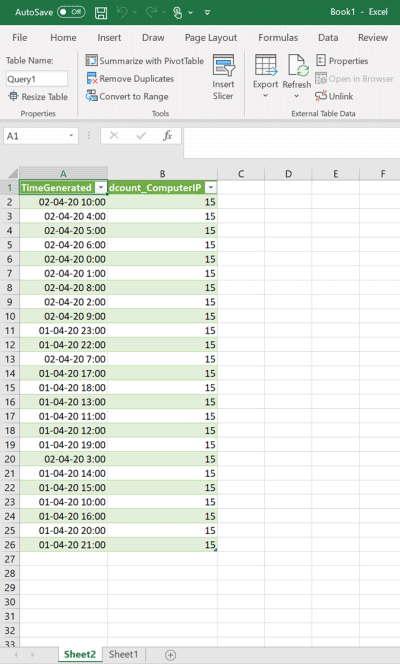
選取 [完成],然後選取 [載入並關閉]。 Excel 會使用 Log Analytics API 和結果集來執行查詢,然後顯示結果集。
注意
如果記錄數目小於預期,結果的數量可能會超過 61MiB 限制。 請嘗試在查詢中使用 project 或 project-away,以將資料行限制為您需要的資料行。
重新整理資料
您可以直接從 Excel 重新整理資料。 在 Excel 功能區的 [資料] 功能表群組中,選取 [重新整理] 按鈕。
下一步
如需 Excel 與外部資料源整合的詳細資訊,請參閱從外部資料來源匯入資料 (Power Query)