使用動態管理檢視來監視 Azure SQL Database 效能
適用於:![]() Azure SQL 資料庫
Azure SQL 資料庫
可以使用動態管理檢視 (DMV) 來監視工作負載效能並診斷效能問題,這些問題可能是由於封鎖或長時間執行查詢、資源瓶頸、不佳的查詢計畫等原因所導致。
本文提供如何透過 T-SQL 查詢動態管理檢視來偵測常見效能問題的相關資訊。 您可以使用任何查詢工具,例如:
權限
在 Azure SQL Database 中,根據計算大小和部署選項以及 DMV 中的資料,查詢 DMV 可能需要 VIEW DATABASE STATE、VIEW SERVER PERFORMANCE STATE 或 VIEW SERVER SECURITY STATE 權限。 最後兩個權限會包含在 VIEW SERVER STATE 權限中。 透過對應伺服器角色中的成員資格授與檢視伺服器狀態權限。 若要判斷查詢特定 DMV 所需的權限,請參閱動態管理檢視,並查找描述 DMV 的文章。
若要將 VIEW DATABASE STATE 權限授與給資料庫使用者,請執行下列查詢,並將 database_user 取代為資料庫中的使用者主體名稱:
GRANT VIEW DATABASE STATE TO [database_user];
若要將 ##MS_ServerStateReader## 伺服器角色的成員資格授與給邏輯伺服器中名為 login_name 的登入者,請連線至 master 資料庫,然後執行下列查詢作為範例:
ALTER SERVER ROLE [##MS_ServerStateReader##] ADD MEMBER [login_name];
需要數分鐘時間,所授與的權限才能生效。 如需詳細資訊,請參閱伺服器層級角色的限制。
監視資源使用量
可以使用下列檢視來監視資料庫層級的資源使用狀況。 這些檢視適用於獨立資料庫和彈性集區中的資料庫。
可以使用下列檢視來監視彈性集區層級的資源使用狀況:
您可以在 Azure 入口網站中使用 SQL Database 查詢效能深入解析,或透過查詢存放區,監視查詢層級的資源使用狀況。
sys.dm_db_resource_stats
您可以在每一個資料庫中使用 sys.dm_db_resource_stats 檢視表。 sys.dm_db_resource_stats 檢視會顯示相對於計算大小限制的最新資源使用資料。 每 15 秒間隔會記錄 CPU、資料 I/O、記錄寫入、背景工作執行緒和記憶體使用量的百分比,並維持大約一小時。
因為此檢視會提供更細微的資源使用狀況資料,請先使用 sys.dm_db_resource_stats 來進行任何現狀分析或疑難排解。 例如,下列查詢會顯示目前的資料庫在過去一小時的平均和最大資源使用量:
SELECT
    database_name = DB_NAME(),
    AVG(avg_cpu_percent) AS 'Average CPU use in percent',
    MAX(avg_cpu_percent) AS 'Maximum CPU use in percent',
    AVG(avg_data_io_percent) AS 'Average data IO in percent',
    MAX(avg_data_io_percent) AS 'Maximum data IO in percent',
    AVG(avg_log_write_percent) AS 'Average log write use in percent',
    MAX(avg_log_write_percent) AS 'Maximum log write use in percent',
    AVG(avg_memory_usage_percent) AS 'Average memory use in percent',
    MAX(avg_memory_usage_percent) AS 'Maximum memory use in percent',
    MAX(max_worker_percent) AS 'Maximum worker use in percent'
FROM sys.dm_db_resource_stats
如需其他查詢的資訊,請參閱 sys.dm_db_resource_stats 中的範例。
sys.resource_stats
master 資料庫中的 sys.resource_stats 檢視有其他資訊,可協助您監視資料庫在其特定服務層級和計算大小上的效能。 每隔 5 分鐘就會收集一次資料,並且會維持大約 14 天。 此檢視適合用來對資料庫如何使用資源進行長期歷程分析。
下圖顯示了具有 P2 計算大小的進階版資料庫一週內每小時的 CPU 資源使用情況。 此圖表從週一開始,顯示了五個工作日,然後顯示週末,此時應用程式的使用率要少得多。
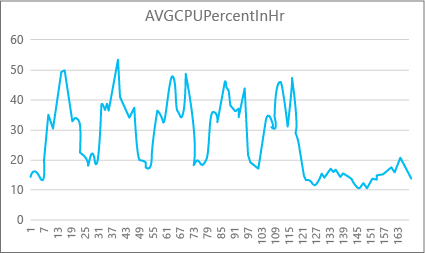
根據資料情況,此資料庫目前尖峰 CPU 負載相對於 P2 計算大小的 CPU 使用率略高於 50% (週二中午)。 如果 CPU 是應用程式資源設定檔中的主要因素,則您可決定 P2 是正確的計算大小,以保證工作負載始終符合。 如果您預期應用程式會隨著時間成長,最好有額外的資源緩衝,以便應用程式始終不會達到效能層級限制。 如果您增加計算大小,您可以協助避免當資料庫沒有足夠能力有效處理要求時,可能發生的客戶可見錯誤,特別是在對延遲敏感的環境中。
對於其他應用程式類型,您可能會對相同圖形進行不同解譯。 例如,如果應用程式每天嘗試處理薪資資料,而且具有相同圖表,這種「批次工作」模型可能會在 P1 計算大小上正常運作。 P1 計算大小具有 100 個 DTU,而 P2 計算大小則為 200 個 DTU。 P1 計算大小提供的效能僅為 P2 計算大小的一半。 因此,P2 中 50% 的 CPU 使用量等於 P1 中的 100% CPU 使用量。 如果應用程式沒有逾時,那麼是要耗費 2 小時或 2.5 小時完成工作,還是要今天完成,都可能並不重要。 此類別中的應用程式可能會使用 P1 計算大小。 您可以利用這一事實,即一天中的某一時間段資源使用量較低,因此在當天低點之後都可能會出現任何「高點」。 P1 計算大小可能適合這類應用程式 (並節省成本),只要工作可以每天準時完成。
資料庫引擎會在每個邏輯伺服器中 master 資料庫的 sys.resource_stats 檢視中,公開每個使用中的資料庫的已耗用資源資訊。 檢視中的資料會以 5 分鐘為間隔進行彙總。 可能需要數分鐘的時間,資料才會出現在資料表中,因此相較於近即時分析,sys.resource_stats 更適合用於歷程記錄分析。 查詢 sys.resource_stats 檢視,以查看資料庫的最新歷程記錄,並驗證您選擇的計算大小是否在需要時提供了您想要的效能。
注意
您必須連線到 master 資料庫,才能在下列範例中查詢 sys.resource_stats。
此範例顯示 sys.resource_stats 中的資料:
SELECT TOP 10 *
FROM sys.resource_stats
WHERE database_name = 'userdb1'
ORDER BY start_time DESC;
下一個範例顯示以不同方式使用 sys.resource_stats 目錄檢視,以取得資料庫如何使用資源的相關資訊:
若要查看使用者資料庫
userdb1過去一週的資源使用,您可以執行此查詢,並替換您自己的資料庫名稱:SELECT * FROM sys.resource_stats WHERE database_name = 'userdb1' AND start_time > DATEADD(day, -7, GETDATE()) ORDER BY start_time DESC;若要評估您的工作負載與計算大小的符合程度,您必須深入分析資源計量的每個層面:CPU、資料 I/O、記錄寫入、背景工作角色數目和工作階段數目。 以下是使用
sys.resource_stats修訂過的查詢,可報告這些資源計量的平均值和最大值,針對已佈建資料庫的每個計算大小:SELECT rs.database_name , rs.sku , storage_mb = MAX(rs.storage_in_megabytes) , 'Average CPU Utilization In %' = AVG(rs.avg_cpu_percent) , 'Maximum CPU Utilization In %' = MAX(rs.avg_cpu_percent) , 'Average Data IO In %' = AVG(rs.avg_data_io_percent) , 'Maximum Data IO In %' = MAX(rs.avg_data_io_percent) , 'Average Log Write Utilization In %' = AVG(rs.avg_log_write_percent) , 'Maximum Log Write Utilization In %' = MAX(rs.avg_log_write_percent) , 'Maximum Requests In %' = MAX(rs.max_worker_percent) , 'Maximum Sessions In %' = MAX(rs.max_session_percent) FROM sys.resource_stats AS rs WHERE rs.database_name = 'userdb1' AND rs.start_time > DATEADD(day, -7, GETDATE()) GROUP BY rs.database_name, rs.sku;藉助每項資源計量的平均值和最大值的相關資訊,您可以評估您的工作負載與計算大小的符合程度。 通常,
sys.resource_stats的平均值可提供良好的基準,以針對目標大小來使用。對於 DTU 購買模型資料庫:
例如,您可能使用具有 S2 計算大小的標準服務層級。 CPU 和 I/O 讀取和寫入的平均使用百分比低於 40%,背景工作角色的平均數目低於 50,而工作階段的平均數目低於 200。 您的工作負載可能符合 S1 計算大小。 您可以輕鬆地查看資料庫是否符合背景工作角色和工作階段限制。 若要查看資料庫是否符合較低的計算大小,請將較低計算大小的 DTU 數目除以目前計算大小的 DTU 數目,然後將結果乘以 100:
S1 DTU / S2 DTU * 100 = 20 / 50 * 100 = 40所得結果即為兩個計算大小之間的相對效能差異,以百分比表示。 如果您的資源使用量未超過此百分比,則工作負載可能符合較低的計算大小。 不過,您需要查看資源使用值的所有範圍,並依百分比判斷資料庫工作負載符合較低計算大小的頻率。 下列查詢會根據我們在本範例中計算的 40% 閾值,輸出每個資源維度的符合百分比:
 SELECT database_name,
     100*((COUNT(database_name) - SUM(CASE WHEN avg_cpu_percent >= 40 THEN 1 ELSE 0 END) * 1.0) / COUNT(database_name)) AS 'CPU Fit Percent',
     100*((COUNT(database_name) - SUM(CASE WHEN avg_log_write_percent >= 40 THEN 1 ELSE 0 END) * 1.0) / COUNT(database_name)) AS 'Log Write Fit Percent',
     100*((COUNT(database_name) - SUM(CASE WHEN avg_data_io_percent >= 40 THEN 1 ELSE 0 END) * 1.0) / COUNT(database_name)) AS 'Physical Data IO Fit Percent'
 FROM sys.resource_stats
 WHERE start_time > DATEADD(day, -7, GETDATE())
 AND database_name = 'sample' --remove to see all databases
 GROUP BY database_name;
根據您的資料庫服務層級,您可以決定您的工作負載是否符合較低的計算大小。 如果您的資料庫工作負載目標為 99.9%,而上述查詢針對所有三個資源維度傳回的值均大於 99.9%,則您的工作負載可能會符合較低的計算大小。
查看符合百分比也可讓您深入了解是否應該移至下一個較高的計算大小,以符合您的目標。 例如,過去一週範例資料庫的 CPU 使用量:
平均 CPU 百分比 最大 CPU 百分比 24.5 100.00 平均 CPU 大約是計算大小限制的四分之一,這很符合資料庫的計算大小。
對於 DTU 購買模型和虛擬核心購買模型資料庫:
最大值顯示,資料庫達到計算大小的限制。 您是否需要移至下一個較高的計算大小? 查看工作負載達到 100% 的次數,然後將其與資料庫工作負載目標進行比較。
 SELECT database_name,
     100*((COUNT(database_name) - SUM(CASE WHEN avg_cpu_percent >= 100 THEN 1 ELSE 0 END) * 1.0) / COUNT(database_name)) AS 'CPU Fit Percent',
     100*((COUNT(database_name) - SUM(CASE WHEN avg_log_write_percent >= 100 THEN 1 ELSE 0 END) * 1.0) / COUNT(database_name)) AS 'Log Write Fit Percent',
     100*((COUNT(database_name) - SUM(CASE WHEN avg_data_io_percent >= 100 THEN 1 ELSE 0 END) * 1.0) / COUNT(database_name)) AS 'Physical Data IO Fit Percent'
 FROM sys.resource_stats
 WHERE start_time > DATEADD(day, -7, GETDATE())
 AND database_name = 'sample'  --remove to see all databases
 GROUP BY database_name;
這些百分比是符合目前計算大小的工作負載範例數目。 如果此查詢針對三個資源維度中任何一個傳回的值小於 99.9%,則取樣的平均工作負載會超過限制。 請考慮移至下一個較高的計算大小或使用應用程式微調技術,來減少資料庫的負載。
sys.dm_elastic_pool_resource_stats
類似於 sys.dm_db_resource_stats,sys.dm_elastic_pool_resource_stats 為彈性集區提供最新且細微的資源使用狀況資料。 可以在彈性集區的任何資料庫中查詢檢視,為整個集區而非任何特定資料庫提供資源使用狀況資料。 此 DMV 所報告的百分比值接近彈性集區的限制,這可能高於集區中資料庫的限制。
此範例顯示過去 15 分鐘內目前彈性集區的摘要資源使用狀況資料:
SELECT dso.elastic_pool_name,
       AVG(eprs.avg_cpu_percent) AS avg_cpu_percent,
       MAX(eprs.avg_cpu_percent) AS max_cpu_percent,
       AVG(eprs.avg_data_io_percent) AS avg_data_io_percent,
       MAX(eprs.avg_data_io_percent) AS max_data_io_percent,
       AVG(eprs.avg_log_write_percent) AS avg_log_write_percent,
       MAX(eprs.avg_log_write_percent) AS max_log_write_percent,
       MAX(eprs.max_worker_percent) AS max_worker_percent,
       MAX(eprs.used_storage_percent) AS max_used_storage_percent,
       MAX(eprs.allocated_storage_percent) AS max_allocated_storage_percent
FROM sys.dm_elastic_pool_resource_stats AS eprs
CROSS JOIN sys.database_service_objectives AS dso
WHERE eprs.end_time >= DATEADD(minute, -15, GETUTCDATE())
GROUP BY dso.elastic_pool_name;
如果發現任何資源使用狀況在相當長的時間內接近 100%,您可能需要檢閱相同彈性集區中個別資料庫的資源使用狀況,以判斷每個資料庫對集區層級資源使用狀況的貢獻量。
sys.elastic_pool_resource_stats
類似於 sys.resource_stats,master 資料庫中的 sys.elastic_pool_resource_stats 會為邏輯伺服器上的所有彈性集區提供歷史資源使用狀況資料。 可以使用 sys.elastic_pool_resource_stats 進行過去 14 天的歷史記錄監視,包括使用量趨勢分析。
此範例顯示目前邏輯伺服器上所有彈性集區在過去七天內摘要的資源使用狀況資料。 在 master 資料庫中執行查詢。
SELECT elastic_pool_name,
       AVG(avg_cpu_percent) AS avg_cpu_percent,
       MAX(avg_cpu_percent) AS max_cpu_percent,
       AVG(avg_data_io_percent) AS avg_data_io_percent,
       MAX(avg_data_io_percent) AS max_data_io_percent,
       AVG(avg_log_write_percent) AS avg_log_write_percent,
       MAX(avg_log_write_percent) AS max_log_write_percent,
       MAX(max_worker_percent) AS max_worker_percent,
       AVG(avg_storage_percent) AS avg_used_storage_percent,
       MAX(avg_storage_percent) AS max_used_storage_percent,
       AVG(avg_allocated_storage_percent) AS avg_allocated_storage_percent,
       MAX(avg_allocated_storage_percent) AS max_allocated_storage_percent
FROM sys.elastic_pool_resource_stats
WHERE start_time >= DATEADD(day, -7, GETUTCDATE())
GROUP BY elastic_pool_name
ORDER BY elastic_pool_name ASC;
並行要求數
若要查看目前的並行要求數目,請在使用者資料庫上執行下列查詢:
SELECT COUNT(*) AS [Concurrent_Requests]
FROM sys.dm_exec_requests;
這只是單一時間點的快照。 若要進一步了解您的工作負載和並行要求需求,您必須收集一段時間內的許多範例。
平均要求時間
此範例示範如何查找資料庫或彈性集區中資料庫在一段時間內的平均要求率。 在此範例中,時間週期會設定為 30 秒。 可以修改 WAITFOR DELAY 陳述式來調整它。 在使用者資料庫中執行此查詢。 如果資料庫位於彈性集區中,而且您有足夠的權限,則結果會包含彈性集區中的其他資料庫。
DECLARE @DbRequestSnapshot TABLE (
                                 database_name sysname PRIMARY KEY,
                                 total_request_count bigint NOT NULL,
                                 snapshot_time datetime2 NOT NULL DEFAULT (SYSDATETIME())
                                 );

INSERT INTO @DbRequestSnapshot
(
database_name,
total_request_count
)
SELECT rg.database_name,
       wg.total_request_count
FROM sys.dm_resource_governor_workload_groups AS wg
INNER JOIN sys.dm_user_db_resource_governance AS rg
ON wg.name = CONCAT('UserPrimaryGroup.DBId', rg.database_id);

WAITFOR DELAY '00:00:30';

SELECT rg.database_name,
       (wg.total_request_count - drs.total_request_count) / DATEDIFF(second, drs.snapshot_time, SYSDATETIME()) AS requests_per_second
FROM sys.dm_resource_governor_workload_groups AS wg
INNER JOIN sys.dm_user_db_resource_governance AS rg
ON wg.name = CONCAT('UserPrimaryGroup.DBId', rg.database_id)
INNER JOIN @DbRequestSnapshot AS drs
ON rg.database_name = drs.database_name;
目前工作階段
若要查看目前作用中的工作階段數目,請在資料庫上執行下列查詢:
SELECT COUNT(*) AS [Sessions]
FROM sys.dm_exec_sessions
WHERE is_user_process = 1;
此查詢會傳回時間點計數。 如果您在一段時間內收集多個樣本,就能充分了解工作階段使用量。
要求、工作階段和背景工作角色的最近歷程記錄
此範例會傳回資料庫或彈性集區中資料庫之要求、工作階段和背景工作執行緒的最近歷史使用情況。 每個資料列都代表資料庫某個時間點的資源使用狀況快照。 requests_per_second 資料行是在 snapshot_time 結束時的時間間隔內的平均要求速率。 如果資料庫位於彈性集區中,而且您有足夠的權限,則結果會包含彈性集區中的其他資料庫。
SELECT rg.database_name,
       wg.snapshot_time,
       wg.active_request_count,
       wg.active_worker_count,
       wg.active_session_count,
       CAST(wg.delta_request_count AS decimal) / duration_ms * 1000 AS requests_per_second
FROM sys.dm_resource_governor_workload_groups_history_ex AS wg
INNER JOIN sys.dm_user_db_resource_governance AS rg
ON wg.name = CONCAT('UserPrimaryGroup.DBId', rg.database_id)
ORDER BY snapshot_time DESC;
計算資料庫和物件大小
下列查詢會傳回資料庫的資料大小 (以 MB 為單位):
-- Calculates the size of the database.
SELECT SUM(CAST(FILEPROPERTY(name, 'SpaceUsed') AS bigint) * 8192.) / 1024 / 1024 AS size_mb
FROM sys.database_files
WHERE type_desc = 'ROWS';
下列查詢會傳回您資料庫中個別物件的大小 (以 MB 為單位):
-- Calculates the size of individual database objects.
SELECT o.name, SUM(ps.reserved_page_count) * 8.0 / 1024 AS size_mb
FROM sys.dm_db_partition_stats AS ps
    INNER JOIN sys.objects AS o
        ON ps.object_id = o.object_id
GROUP BY o.name
ORDER BY size_mb DESC;
識別 CPU 效能問題
本節協助您識別最消耗 CPU 的個別查詢。
如果 CPU 耗用量長的時間高於 80%,請考慮下列疑難排解步驟,而無論 CPU 問題現在正在發生還是過去已發生。 您也可以遵循本節中的步驟,主動識別最消耗 CPU 的查詢並加以調整。 在某些情況下,降低 CPU 使用量可能會縮減資料庫和彈性集區,並節省成本。
獨立資料庫和彈性集區中的資料庫的疑難排解步驟相同。 在使用者資料庫中執行所有查詢。
CPU 問題現在正在發生
如果正在發生問題,有兩個可能的案例:
許多累積耗用大量 CPU 的個別查詢
使用下列查詢,透過查詢雜湊來識別常見查詢:
PRINT '-- top 10 Active CPU Consuming Queries (aggregated)--';
SELECT TOP 10 GETDATE() runtime, *
FROM (SELECT query_stats.query_hash, SUM(query_stats.cpu_time) 'Total_Request_Cpu_Time_Ms', SUM(logical_reads) 'Total_Request_Logical_Reads', MIN(start_time) 'Earliest_Request_start_Time', COUNT(*) 'Number_Of_Requests', SUBSTRING(REPLACE(REPLACE(MIN(query_stats.statement_text), CHAR(10), ' '), CHAR(13), ' '), 1, 256) AS "Statement_Text"
    FROM (SELECT req.*, SUBSTRING(ST.text, (req.statement_start_offset / 2)+1, ((CASE statement_end_offset WHEN -1 THEN DATALENGTH(ST.text)ELSE req.statement_end_offset END-req.statement_start_offset)/ 2)+1) AS statement_text
            FROM sys.dm_exec_requests AS req
                CROSS APPLY sys.dm_exec_sql_text(req.sql_handle) AS ST ) AS query_stats
    GROUP BY query_hash) AS t
ORDER BY Total_Request_Cpu_Time_Ms DESC;
耗用 CPU 的長時間執行的查詢仍在執行
使用下列查詢識別下列查詢:
PRINT '--top 10 Active CPU Consuming Queries by sessions--';
SELECT TOP 10 req.session_id, req.start_time, cpu_time 'cpu_time_ms', OBJECT_NAME(ST.objectid, ST.dbid) 'ObjectName', SUBSTRING(REPLACE(REPLACE(SUBSTRING(ST.text, (req.statement_start_offset / 2)+1, ((CASE statement_end_offset WHEN -1 THEN DATALENGTH(ST.text)ELSE req.statement_end_offset END-req.statement_start_offset)/ 2)+1), CHAR(10), ' '), CHAR(13), ' '), 1, 512) AS statement_text
FROM sys.dm_exec_requests AS req
    CROSS APPLY sys.dm_exec_sql_text(req.sql_handle) AS ST
ORDER BY cpu_time DESC;
GO
發生在過去的 CPU 問題
如果問題發生在過去,而且您想要執行根本原因分析,請使用查詢存放區。 具有資料庫存取權的使用者可以使用 T-SQL 查詢「查詢存放區」資料。 根據預設,查詢存放區會擷取一小時間隔的彙總查詢統計資料。
使用下列查詢查看耗用大量 CPU 查詢的活動。 此查詢會傳回前 15 個耗用 CPU 的查詢。 請記得變更
rsi.start_time >= DATEADD(hour, -2, GETUTCDATE()以查看過去兩小時以外的時間週期:-- Top 15 CPU consuming queries by query hash -- Note that a query hash can have many query ids if not parameterized or not parameterized properly WITH AggregatedCPU AS ( SELECT q.query_hash ,SUM(count_executions * avg_cpu_time / 1000.0) AS total_cpu_ms ,SUM(count_executions * avg_cpu_time / 1000.0) / SUM(count_executions) AS avg_cpu_ms ,MAX(rs.max_cpu_time / 1000.00) AS max_cpu_ms ,MAX(max_logical_io_reads) max_logical_reads ,COUNT(DISTINCT p.plan_id) AS number_of_distinct_plans ,COUNT(DISTINCT p.query_id) AS number_of_distinct_query_ids ,SUM(CASE WHEN rs.execution_type_desc = 'Aborted' THEN count_executions ELSE 0 END) AS Aborted_Execution_Count ,SUM(CASE WHEN rs.execution_type_desc = 'Regular' THEN count_executions ELSE 0 END) AS Regular_Execution_Count ,SUM(CASE WHEN rs.execution_type_desc = 'Exception' THEN count_executions ELSE 0 END) AS Exception_Execution_Count ,SUM(count_executions) AS total_executions ,MIN(qt.query_sql_text) AS sampled_query_text FROM sys.query_store_query_text AS qt INNER JOIN sys.query_store_query AS q ON qt.query_text_id = q.query_text_id INNER JOIN sys.query_store_plan AS p ON q.query_id = p.query_id INNER JOIN sys.query_store_runtime_stats AS rs ON rs.plan_id = p.plan_id INNER JOIN sys.query_store_runtime_stats_interval AS rsi ON rsi.runtime_stats_interval_id = rs.runtime_stats_interval_id WHERE rs.execution_type_desc IN ('Regular','Aborted','Exception') AND rsi.start_time >= DATEADD(HOUR, - 2, GETUTCDATE()) GROUP BY q.query_hash ) ,OrderedCPU AS ( SELECT query_hash ,total_cpu_ms ,avg_cpu_ms ,max_cpu_ms ,max_logical_reads ,number_of_distinct_plans ,number_of_distinct_query_ids ,total_executions ,Aborted_Execution_Count ,Regular_Execution_Count ,Exception_Execution_Count ,sampled_query_text ,ROW_NUMBER() OVER ( ORDER BY total_cpu_ms DESC ,query_hash ASC ) AS query_hash_row_number FROM AggregatedCPU ) SELECT OD.query_hash ,OD.total_cpu_ms ,OD.avg_cpu_ms ,OD.max_cpu_ms ,OD.max_logical_reads ,OD.number_of_distinct_plans ,OD.number_of_distinct_query_ids ,OD.total_executions ,OD.Aborted_Execution_Count ,OD.Regular_Execution_Count ,OD.Exception_Execution_Count ,OD.sampled_query_text ,OD.query_hash_row_number FROM OrderedCPU AS OD WHERE OD.query_hash_row_number <= 15 --get top 15 rows by total_cpu_ms ORDER BY total_cpu_ms DESC;一旦您識別有問題的查詢之後,就可以調整這些查詢,以減少 CPU 使用率。 或者,可以選擇增加資料庫或彈性集區的計算大小,以解決此問題。
如需在 Azure SQL 資料庫中處理 CPU 效能問題的詳細資訊,請參閱對 Azure SQL 資料庫上的高 CPU 進行診斷和疑難排解。
識別 I/O 效能問題
識別儲存體輸入/輸出 (I/O) 效能問題時,常見等候類型如下:
PAGEIOLATCH_*資料檔案 I/O 問題 (包括
PAGEIOLATCH_SH、PAGEIOLATCH_EX、PAGEIOLATCH_UP)。 如果等候類型名稱中有 IO,則指向 I/O 問題。 如果在頁面閂鎖等候名稱中沒有任何 IO,就會指向與儲存體效能無關的不同類型的問題 (例如,tempdb爭用)。WRITE_LOG交易記錄 I/O 問題。
如果正在發生 I/O 問題
使用 sys.dm_exec_requests 或 sys.dm_os_waiting_tasks 查看 wait_type 和 wait_time。
識別資料並記錄 I/O 使用率
使用下列查詢,識別資料並記錄 I/O 使用率。
SELECT
    database_name = DB_NAME()
,   UTC_time = end_time
,   'Data IO In % of Limit'                   = rs.avg_data_io_percent
,   'Log Write Utilization In % of Limit'     = rs.avg_log_write_percent
FROM sys.dm_db_resource_stats AS rs  --past hour only
ORDER BY  rs.end_time DESC;
如需使用 sys.dm_db_resource_stats 的更多範例,請參閱本文稍後的監視資源使用率一節。
如果已達到 I/O 限制,則會有兩個選項:
- 升級計算大小或服務層級
- 識別並微調耗用最多 I/O 的查詢。
使用「查詢存放區」檢視與緩衝區相關的 I/O
若要按照 I/O 相關等候來識別常見查詢,可以使用下列查詢存放區查詢來檢視過去兩小時追蹤的活動:
-- Top queries that waited on buffer
-- Note these are finished queries
WITH Aggregated AS (SELECT q.query_hash, SUM(total_query_wait_time_ms) total_wait_time_ms, SUM(total_query_wait_time_ms / avg_query_wait_time_ms) AS total_executions, MIN(qt.query_sql_text) AS sampled_query_text, MIN(wait_category_desc) AS wait_category_desc
                    FROM sys.query_store_query_text AS qt
                         INNER JOIN sys.query_store_query AS q ON qt.query_text_id=q.query_text_id
                         INNER JOIN sys.query_store_plan AS p ON q.query_id=p.query_id
                         INNER JOIN sys.query_store_wait_stats AS waits ON waits.plan_id=p.plan_id
                         INNER JOIN sys.query_store_runtime_stats_interval AS rsi ON rsi.runtime_stats_interval_id=waits.runtime_stats_interval_id
                    WHERE wait_category_desc='Buffer IO' AND rsi.start_time>=DATEADD(HOUR, -2, GETUTCDATE())
                    GROUP BY q.query_hash), Ordered AS (SELECT query_hash, total_executions, total_wait_time_ms, sampled_query_text, wait_category_desc, ROW_NUMBER() OVER (ORDER BY total_wait_time_ms DESC, query_hash ASC) AS query_hash_row_number
                                                        FROM Aggregated)
SELECT OD.query_hash, OD.total_executions, OD.total_wait_time_ms, OD.sampled_query_text, OD.wait_category_desc, OD.query_hash_row_number
FROM Ordered AS OD
WHERE OD.query_hash_row_number <= 15 -- get top 15 rows by total_wait_time_ms
ORDER BY total_wait_time_ms DESC;
GO
也可以使用 sys.query_store_runtime_stats 檢視,重點關註 avg_physical_io_reads 和 avg_num_physical_io_reads 資料行中具有較大值的查詢。
檢視 WRITELOG 等候的總記錄 I/O
如果等候類型是 WRITELOG,使用下列查詢可依陳述式檢視總記錄 I/O:
-- Top transaction log consumers
-- Adjust the time window by changing
-- rsi.start_time >= DATEADD(hour, -2, GETUTCDATE())
WITH AggregatedLogUsed
AS (SELECT q.query_hash,
           SUM(count_executions * avg_cpu_time / 1000.0) AS total_cpu_ms,
           SUM(count_executions * avg_cpu_time / 1000.0) / SUM(count_executions) AS avg_cpu_ms,
           SUM(count_executions * avg_log_bytes_used) AS total_log_bytes_used,
           MAX(rs.max_cpu_time / 1000.00) AS max_cpu_ms,
           MAX(max_logical_io_reads) max_logical_reads,
           COUNT(DISTINCT p.plan_id) AS number_of_distinct_plans,
           COUNT(DISTINCT p.query_id) AS number_of_distinct_query_ids,
           SUM(   CASE
                      WHEN rs.execution_type_desc = 'Aborted' THEN
                          count_executions
                      ELSE 0
                  END
              ) AS Aborted_Execution_Count,
           SUM(   CASE
                      WHEN rs.execution_type_desc = 'Regular' THEN
                          count_executions
                      ELSE 0
                  END
              ) AS Regular_Execution_Count,
           SUM(   CASE
                      WHEN rs.execution_type_desc = 'Exception' THEN
                          count_executions
                      ELSE 0
                  END
              ) AS Exception_Execution_Count,
           SUM(count_executions) AS total_executions,
           MIN(qt.query_sql_text) AS sampled_query_text
    FROM sys.query_store_query_text AS qt
        INNER JOIN sys.query_store_query AS q ON qt.query_text_id = q.query_text_id
        INNER JOIN sys.query_store_plan AS p ON q.query_id = p.query_id
        INNER JOIN sys.query_store_runtime_stats AS rs ON rs.plan_id = p.plan_id
        INNER JOIN sys.query_store_runtime_stats_interval AS rsi ON rsi.runtime_stats_interval_id = rs.runtime_stats_interval_id
    WHERE rs.execution_type_desc IN ( 'Regular', 'Aborted', 'Exception' )
          AND rsi.start_time >= DATEADD(HOUR, -2, GETUTCDATE())
    GROUP BY q.query_hash),
     OrderedLogUsed
AS (SELECT query_hash,
           total_log_bytes_used,
           number_of_distinct_plans,
           number_of_distinct_query_ids,
           total_executions,
           Aborted_Execution_Count,
           Regular_Execution_Count,
           Exception_Execution_Count,
           sampled_query_text,
           ROW_NUMBER() OVER (ORDER BY total_log_bytes_used DESC, query_hash ASC) AS query_hash_row_number
    FROM AggregatedLogUsed)
SELECT OD.total_log_bytes_used,
       OD.number_of_distinct_plans,
       OD.number_of_distinct_query_ids,
       OD.total_executions,
       OD.Aborted_Execution_Count,
       OD.Regular_Execution_Count,
       OD.Exception_Execution_Count,
       OD.sampled_query_text,
       OD.query_hash_row_number
FROM OrderedLogUsed AS OD
WHERE OD.query_hash_row_number <= 15 -- get top 15 rows by total_log_bytes_used
ORDER BY total_log_bytes_used DESC;
GO
識別 tempdb 效能問題
與 tempdb 問題相關的常見等待類型為 PAGELATCH_* (而非 PAGEIOLATCH_*)。 不過,PAGELATCH_* 等候不一定表示您有 tempdb 爭用。 這個等候也表示您有使用者物件資料頁面爭用,因為針對相同的資料頁面進行並行要求。 若要進一步確認 tempdb 競爭,請使用 sys.dm_exec_requests 確認 wait_resource 值開頭為 2:x:y,其中 2 tempdb 是資料庫識別碼、x 是檔案識別碼,而 y 是分頁識別碼。
對於 tempdb 競爭,常見的方法是減少或重新撰寫依賴 tempdb 的應用程式程式碼。 常見的 tempdb 使用區域包括:
- 暫存資料表
- 資料表變數
- 資料表值參數
- 具有使用排序、雜湊聯結和多工緩衝處理之查詢計劃的查詢
如需詳細資訊,請參閱 Azure SQL 中的 tempdb。
彈性集區中的所有資料庫會共用相同的 tempdb 資料庫。 一個資料庫的高 tempdb 空間使用率可能會影響相同彈性集區中的其他資料庫。
使用資料表變數和暫存資料表的常見查詢
使用下列查詢識別使用資料表變數和暫存資料表的常見查詢:
SELECT plan_handle, execution_count, query_plan
INTO #tmpPlan
FROM sys.dm_exec_query_stats
     CROSS APPLY sys.dm_exec_query_plan(plan_handle);
GO

WITH XMLNAMESPACES('http://schemas.microsoft.com/sqlserver/2004/07/showplan' AS sp)
SELECT plan_handle, stmt.stmt_details.value('@Database', 'varchar(max)') AS 'Database'
, stmt.stmt_details.value('@Schema', 'varchar(max)') AS 'Schema'
, stmt.stmt_details.value('@Table', 'varchar(max)') AS 'table'
INTO #tmp2
FROM
    (SELECT CAST(query_plan AS XML) sqlplan, plan_handle FROM #tmpPlan) AS p
        CROSS APPLY sqlplan.nodes('//sp:Object') AS stmt(stmt_details);
GO

SELECT t.plan_handle, [Database], [Schema], [table], execution_count
FROM
    (SELECT DISTINCT plan_handle, [Database], [Schema], [table]
     FROM #tmp2
     WHERE [table] LIKE '%@%' OR [table] LIKE '%#%') AS t
        INNER JOIN #tmpPlan AS t2 ON t.plan_handle=t2.plan_handle;
GO
DROP TABLE #tmpPlan
DROP TABLE #tmp2
識別長時間執行的交易
使用下列查詢識別長時間執行的交易。 長時間執行的交易可防止持續版本存放區 (PVS) 清除。 如需詳細資訊,請參閱針對加速資料庫復原進行疑難排解。
SELECT DB_NAME(dtr.database_id) 'database_name',
       sess.session_id,
       atr.name AS 'tran_name',
       atr.transaction_id,
       transaction_type,
       transaction_begin_time,
       database_transaction_begin_time,
       transaction_state,
       is_user_transaction,
       sess.open_transaction_count,
       TRIM(REPLACE(
                REPLACE(
                            SUBSTRING(
                                        SUBSTRING(
                                                    txt.text,
                                                    (req.statement_start_offset / 2) + 1,
                                                    ((CASE req.statement_end_offset
                                                            WHEN -1 THEN
                                                                DATALENGTH(txt.text)
                                                            ELSE
                                                                req.statement_end_offset
                                                        END - req.statement_start_offset
                                                    ) / 2
                                                    ) + 1
                                                ),
                                        1,
                                        1000
                                    ),
                            CHAR(10),
                            ' '
                        ),
                CHAR(13),
                ' '
            )
            ) Running_stmt_text,
       recenttxt.text 'MostRecentSQLText'
FROM sys.dm_tran_active_transactions AS atr
    INNER JOIN sys.dm_tran_database_transactions AS dtr
        ON dtr.transaction_id = atr.transaction_id
    LEFT JOIN sys.dm_tran_session_transactions AS sess
        ON sess.transaction_id = atr.transaction_id
    LEFT JOIN sys.dm_exec_requests AS req
        ON req.session_id = sess.session_id
           AND req.transaction_id = sess.transaction_id
    LEFT JOIN sys.dm_exec_connections AS conn
        ON sess.session_id = conn.session_id
    OUTER APPLY sys.dm_exec_sql_text(req.sql_handle) AS txt
    OUTER APPLY sys.dm_exec_sql_text(conn.most_recent_sql_handle) AS recenttxt
WHERE atr.transaction_type != 2
      AND sess.session_id != @@spid
ORDER BY start_time ASC;
識別記憶體授與等候效能問題
如果常見等待類型為 RESOURCE_SEMAPHORE,您可能會遇到記憶體授與等待問題,查詢在取得足夠大的記憶體授與之前無法開始執行。
判斷 RESOURCE_SEMAPHORE 等候是否為最高等候
使用下列查詢判斷 RESOURCE_SEMAPHORE 等候是否為最高等候。 這也表示,在最新歷程記錄中,等待時間的排名上升到 RESOURCE_SEMAPHORE。 如需針對記憶體授與等候問題進行疑難排解的詳細資訊,請參閱疑難排解 SQL Server 中記憶體授與所造成的效能緩慢或記憶體不足問題。
SELECT wait_type,
       SUM(wait_time) AS total_wait_time_ms
FROM sys.dm_exec_requests AS req
    INNER JOIN sys.dm_exec_sessions AS sess
        ON req.session_id = sess.session_id
WHERE is_user_process = 1
GROUP BY wait_type
ORDER BY SUM(wait_time) DESC;
識別高記憶體耗用的陳述式
如果在 Azure SQL 資料庫中發生記憶體不足的錯誤,請檢閱 sys.dm_os_out_of_memory_events。 如需詳細資訊,請參閱針對 Azure SQL 資料庫中的記憶體不足錯誤進行疑難排解。
首先,修改下列指令碼,以更新 start_time 和 end_time 的相關值。 然後,執行下列查詢,以識別高記憶體取用陳述式:
SELECT IDENTITY(INT, 1, 1) rowId,
    CAST(query_plan AS XML) query_plan,
    p.query_id
INTO #tmp
FROM sys.query_store_plan AS p
    INNER JOIN sys.query_store_runtime_stats AS r
        ON p.plan_id = r.plan_id
    INNER JOIN sys.query_store_runtime_stats_interval AS i
        ON r.runtime_stats_interval_id = i.runtime_stats_interval_id
WHERE start_time > '2018-10-11 14:00:00.0000000'
      AND end_time < '2018-10-17 20:00:00.0000000';

WITH cte
AS (SELECT query_id,
        query_plan,
        m.c.value('@SerialDesiredMemory', 'INT') AS SerialDesiredMemory
    FROM #tmp AS t
        CROSS APPLY t.query_plan.nodes('//*:MemoryGrantInfo[@SerialDesiredMemory[. > 0]]') AS m(c) )
SELECT TOP 50
    cte.query_id,
    t.query_sql_text,
    cte.query_plan,
    CAST(SerialDesiredMemory / 1024. AS DECIMAL(10, 2)) SerialDesiredMemory_MB
FROM cte
    INNER JOIN sys.query_store_query AS q
        ON cte.query_id = q.query_id
    INNER JOIN sys.query_store_query_text AS t
        ON q.query_text_id = t.query_text_id
ORDER BY SerialDesiredMemory DESC;
識別前 10 個有效記憶體授與
使用下列查詢識別前 10 個有效記憶體授與:
SELECT TOP 10
    CONVERT(VARCHAR(30), GETDATE(), 121) AS runtime,
       r.session_id,
       r.blocking_session_id,
       r.cpu_time,
       r.total_elapsed_time,
       r.reads,
       r.writes,
       r.logical_reads,
       r.row_count,
       wait_time,
       wait_type,
       r.command,
       OBJECT_NAME(txt.objectid, txt.dbid) 'Object_Name',
       TRIM(REPLACE(REPLACE(SUBSTRING(SUBSTRING(TEXT, (r.statement_start_offset / 2) + 1,
        (  (
            CASE r.statement_end_offset
                WHEN - 1
                    THEN DATALENGTH(TEXT)
                ELSE r.statement_end_offset
                END - r.statement_start_offset
            ) / 2
        ) + 1), 1, 1000), CHAR(10), ' '), CHAR(13), ' ')) AS stmt_text,
       mg.dop,                                               --Degree of parallelism
       mg.request_time,                                      --Date and time when this query requested the memory grant.
       mg.grant_time,                                        --NULL means memory has not been granted
       mg.requested_memory_kb / 1024.0 requested_memory_mb,  --Total requested amount of memory in megabytes
       mg.granted_memory_kb / 1024.0 AS granted_memory_mb,   --Total amount of memory actually granted in megabytes. NULL if not granted
       mg.required_memory_kb / 1024.0 AS required_memory_mb, --Minimum memory required to run this query in megabytes.
       max_used_memory_kb / 1024.0 AS max_used_memory_mb,
       mg.query_cost,                                        --Estimated query cost.
       mg.timeout_sec,                                       --Time-out in seconds before this query gives up the memory grant request.
       mg.resource_semaphore_id,                             --Non-unique ID of the resource semaphore on which this query is waiting.
       mg.wait_time_ms,                                      --Wait time in milliseconds. NULL if the memory is already granted.
       CASE mg.is_next_candidate --Is this process the next candidate for a memory grant
           WHEN 1 THEN
               'Yes'
           WHEN 0 THEN
               'No'
           ELSE
               'Memory has been granted'
       END AS 'Next Candidate for Memory Grant',
       qp.query_plan
FROM sys.dm_exec_requests AS r
    INNER JOIN sys.dm_exec_query_memory_grants AS mg
        ON r.session_id = mg.session_id
           AND r.request_id = mg.request_id
    CROSS APPLY sys.dm_exec_sql_text(mg.sql_handle) AS txt
    CROSS APPLY sys.dm_exec_query_plan(r.plan_handle) AS qp
ORDER BY mg.granted_memory_kb DESC;
監視連線
您可以使用 sys.dm_exec_connections 檢視,以擷取對特定資料庫所建立連線的相關資訊,以及每個連線的詳細資料。 如果資料庫位於彈性集區中,而且您有足夠的權限,則檢視會傳回彈性集區中所有資料庫的連線集合。 此外,sys.dm_exec_sessions 檢視有助於擷取所有作用中使用者的連接資訊和內部工作。
檢視目前的工作階段
下列查詢會擷取目前連線和工作階段的資訊。 若要檢視所有連線和工作階段,請移除 WHERE 子句。
在執行 sys.dm_exec_requests 和 sys.dm_exec_sessions 檢視時,只有對資料庫擁有 VIEW DATABASE STATE 權限,才會看到資料庫上的所有正執行的工作階段。 否則,您僅會看到目前的工作階段。
SELECT
    c.session_id, c.net_transport, c.encrypt_option,
    c.auth_scheme, s.host_name, s.program_name,
    s.client_interface_name, s.login_name, s.nt_domain,
    s.nt_user_name, s.original_login_name, c.connect_time,
    s.login_time
FROM sys.dm_exec_connections AS c
    INNER JOIN sys.dm_exec_sessions AS s
        ON c.session_id = s.session_id
WHERE c.session_id = @@SPID; --Remove to view all sessions, if permissions allow
監視查詢效能
速度慢或長時間執行的查詢可能會耗用大量系統資源。 本節示範如何使用 sys.dm_exec_query_stats 動態管理檢視,偵測幾個常見的查詢效能問題。 此檢視在快取計畫中的每個查詢陳述式包含一個資料列,而資料列的存留期則會繫結至計畫本身。 從快取中移除計畫時,對應的資料列也會從這個檢視中刪除。 如果查詢沒有快取的計劃,例如因為已使用 OPTION (RECOMPILE),則此檢視的結果中不會顯示它。
依 CPU 時間尋找熱門查詢
下列範例會傳回以每個執行的平均 CPU 時間排名的前 15 個查詢的相關資訊。 此範例會根據查詢雜湊來彙總查詢,使在邏輯上等同的查詢依其累積資源耗用量進行分組。
SELECT TOP 15 query_stats.query_hash AS Query_Hash,
    SUM(query_stats.total_worker_time) / SUM(query_stats.execution_count) AS Avg_CPU_Time,
     MIN(query_stats.statement_text) AS Statement_Text
FROM
    (SELECT QS.*,
        SUBSTRING(ST.text, (QS.statement_start_offset/2) + 1,
            ((CASE statement_end_offset
                WHEN -1 THEN DATALENGTH(ST.text)
                ELSE QS.statement_end_offset END
            - QS.statement_start_offset)/2) + 1) AS statement_text
FROM sys.dm_exec_query_stats AS QS
    CROSS APPLY sys.dm_exec_sql_text(QS.sql_handle) AS ST
    ) AS query_stats
GROUP BY query_stats.query_hash
ORDER BY Avg_CPU_Time DESC;
監視累計 CPU 時間的查詢計畫
效率不佳的查詢計畫也可能會增加 CPU 耗用量。 下列範例能判斷哪個查詢會使用最新歷程記錄中最多累計的 CPU。
SELECT
    highest_cpu_queries.plan_handle,
    highest_cpu_queries.total_worker_time,
    q.dbid,
    q.objectid,
    q.number,
    q.encrypted,
    q.[text]
FROM
    (SELECT TOP 15
            qs.plan_handle,
            qs.total_worker_time
        FROM
            sys.dm_exec_query_stats AS qs
        ORDER BY qs.total_worker_time desc
    ) AS highest_cpu_queries
CROSS APPLY sys.dm_exec_sql_text(plan_handle) AS q
ORDER BY highest_cpu_queries.total_worker_time DESC;
監視封鎖的查詢
速度慢或長時間執行的查詢會造成過度的資源耗用,並且會導致封鎖查詢的後果。 導致封鎖的原因可能是不佳的應用程式設計、不良的查詢計畫、缺乏有用的索引等等。
您可以使用 sys.dm_tran_locks 檢視表來取得資料庫中目前鎖定活動的相關資訊。 如需程式碼範例,請參閱 sys.dm_tran_locks。 如需針對封鎖進行疑難排解的詳細資訊,請參閱了解和解決 Azure SQL Database 封鎖問題。
監視鎖死
在某些情況下,兩個或以上的查詢可能會彼此相互封鎖,從而導致鎖死。
您可以建立「擴充事件」追蹤,以擷取鎖死事件,接著在查詢存放區中尋找相關的查詢及其執行計畫。 若要深入了解,請參閱分析並防止 Azure SQL 資料庫中的鎖死,包括會在 AdventureWorksLT 中造成死結的實驗室。 深入了解可能發生死結的資源的類型。
相關內容
意見反應
即將登場:在 2024 年,我們將逐步淘汰 GitHub 問題作為內容的意見反應機制,並將它取代為新的意見反應系統。 如需詳細資訊,請參閱:https://aka.ms/ContentUserFeedback。
提交並檢視相關的意見反應