地理空間視覺效果
您可以使用 Kusto Desktop Explorer 或 Azure Data Explorer Web UI 中的轉譯運算符,將地理空間數據可視化。 若要下載 Kusto Desktop Explorer,請參閱 Kusto.Explorer 安裝和使用者介面。
如需視覺效果選項的詳細資訊,請參閱使用 Azure Data Explorer 的數據視覺效果。 如需地理空間叢集的詳細資訊,請參閱 地理空間叢集。
在地圖上可視化點
您可以使用 [經度、緯度] 數據行或 GeoJSON 數據行,將點可視化。 使用數位數據行是選擇性的。 [經度、緯度] 配對會依該順序定義每個點。
範例:在地圖上將點可視化
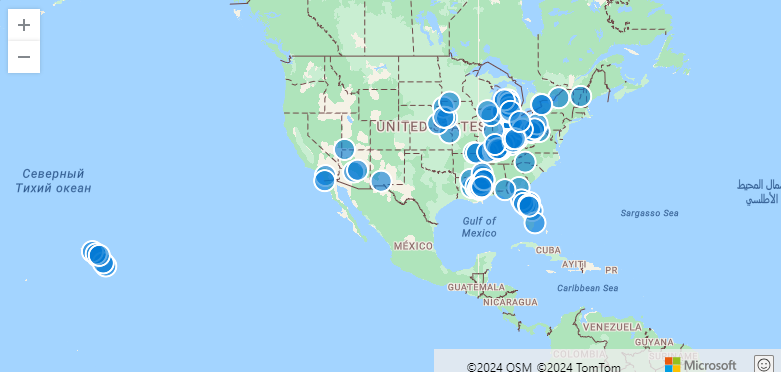
下列範例會尋找 Storm 事件,並在地圖上可視化 100。
StormEvents
| take 100
| project BeginLon, BeginLat
| render scatterchart with (kind = map)
範例:在地圖上可視化多個點數列
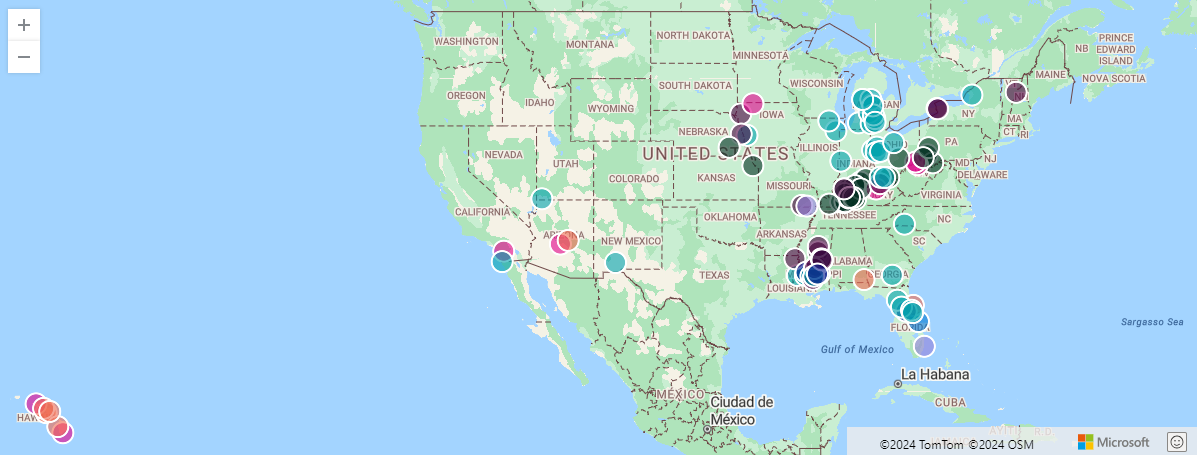
下列範例會將多個點數列可視化,其中 [經度,緯度] 配對會定義每個點,而第三個數據行會定義數列。 在這裡範例中,數列是 EventType。
StormEvents
| take 100
| project BeginLon, BeginLat, EventType
| render scatterchart with (kind = map)
範例:以多個數據行可視化數據上的數列點
下列範例會將地圖上的一系列點可視化。 如果結果中有多個數據行,則必須指定要用於 xcolumn (經度) 、ycolumn (Latitude) 和數列的數據行。
StormEvents
| take 100
| render scatterchart with (kind = map, xcolumn = BeginLon, ycolumns = BeginLat, series = EventType)
範例:將 GeoJSON 動態值所定義地圖上的點可視化
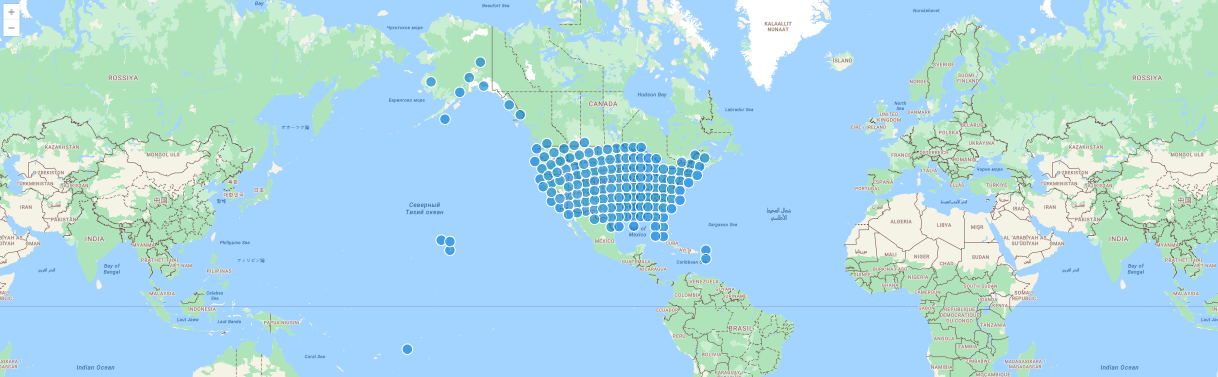
下列範例使用 GeoJSON 動態值來定義點,將地圖上的點可視化。
StormEvents
| project BeginLon, BeginLat
| summarize by hash=geo_point_to_s2cell(BeginLon, BeginLat, 5)
| project geo_s2cell_to_central_point(hash)
| render scatterchart with (kind = map)
地圖上的pies或泡泡視覺效果
您可以使用 [經度、緯度] 數據行或 GeoJSON 數據行,將 pies 或泡泡可視化。 您可以使用色彩或數值軸來建立這些視覺效果。
範例:依位置將餅圖可視化
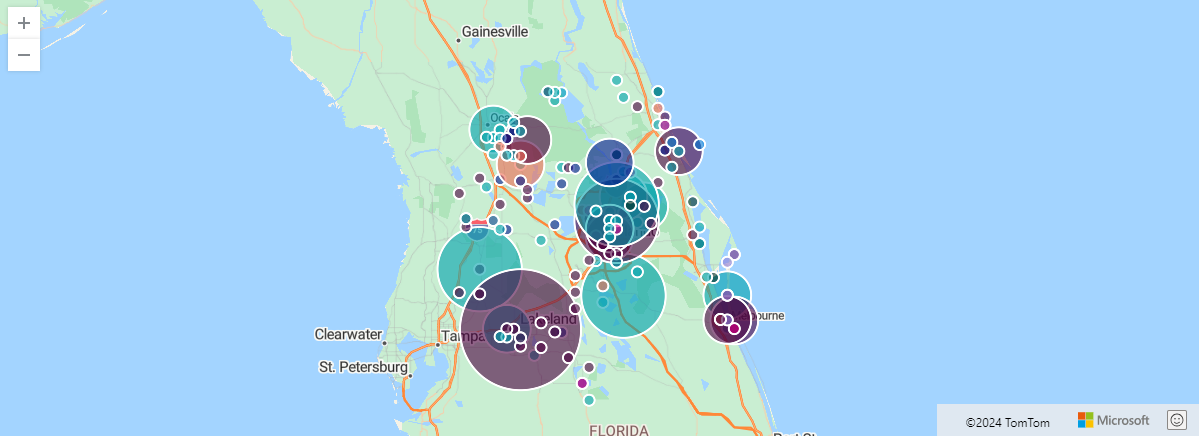
下列範例顯示 S2 儲存格所匯總的 Storm 事件。 圖表會依位置匯總餅圖中的事件。
StormEvents
| project BeginLon, BeginLat, EventType
| where geo_point_in_circle(BeginLon, BeginLat, real(-81.3891), 28.5346, 1000 * 100)
| summarize count() by EventType, hash = geo_point_to_s2cell(BeginLon, BeginLat)
| project geo_s2cell_to_central_point(hash), EventType, count_
| render piechart with (kind = map) // pie map rendering available only in Kusto Explorer desktop
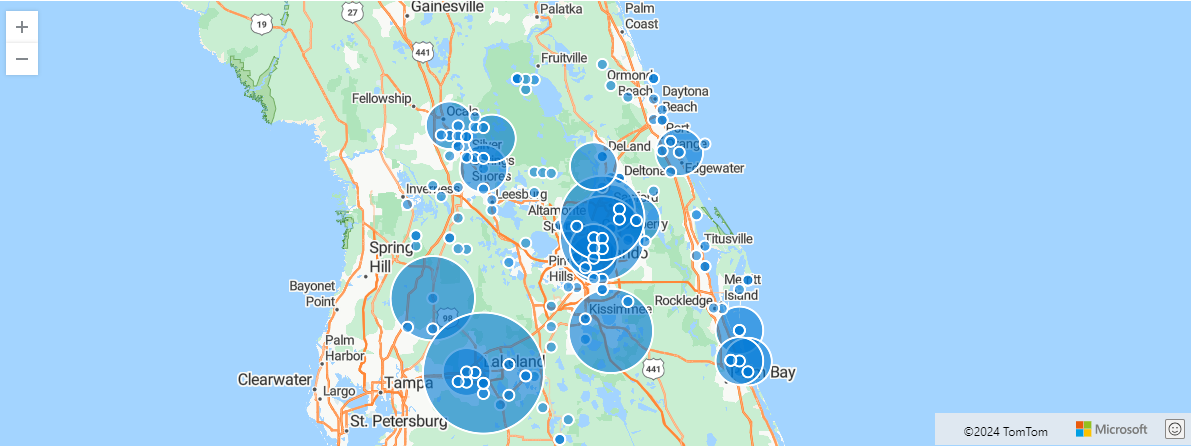
範例:使用色彩軸將泡泡可視化
下列範例顯示 S2 儲存格所匯總的 Storm 事件。 圖表會依位置匯總泡泡中的事件。 由於所有事件的色彩軸 (“count”) 相同, render 因此運算符會產生泡泡。
StormEvents
| project BeginLon, BeginLat, EventType
| where geo_point_in_circle(BeginLon, BeginLat, real(-81.3891), 28.5346, 1000 * 100)
| summarize count() by EventType, hash = geo_point_to_s2cell(BeginLon, BeginLat)
| project geo_s2cell_to_central_point(hash), count_
| extend Events = "count"
| render piechart with (kind = map) // pie map rendering available only in Kusto Explorer desktop
相關內容
- 地理空間叢集
- 轉譯運算符
- 汽車測試車隊的數據分析 (地理空間叢集使用案例)
- 瞭解地理空間數據處理和分析的 Azure 架構
意見反應
即將登場:在 2024 年,我們將逐步淘汰 GitHub 問題作為內容的意見反應機制,並將它取代為新的意見反應系統。 如需詳細資訊,請參閱:https://aka.ms/ContentUserFeedback。
提交並檢視相關的意見反應