檢閱記錄以診斷管線問題
Azure DevOps Services | Azure DevOps Server 2022 - Azure DevOps Server 2019
管線記錄提供一個功能強大的工具來判斷管線失敗的原因,而且可以設定詳細信息記錄來提供更多診斷資訊。
典型的起點是檢閱已完成組建或發行中的記錄。 您可以流覽至管線執行摘要,然後選取作業和工作,以檢視記錄。 如果特定工作失敗,請檢查該工作的記錄。 設定詳細資訊記錄 以包含更多診斷資訊。
設定詳細信息記錄
若要協助進行疑難排解,您可以將記錄設定為更詳細。
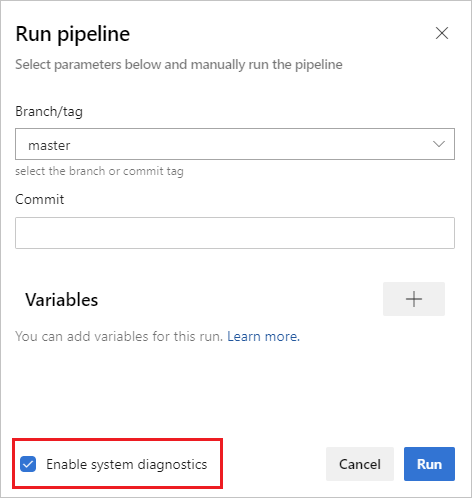
若要設定單一執行的詳細信息記錄,您可以選擇 [執行管線],然後選取 [啟用系統診斷]、[執行] 來啟動新的組建。
若要設定所有執行的詳細資訊記錄,您可以新增名為
system.debug的變數,並將其值設定為true。
若要設定單一執行的詳細信息記錄,您可以選擇 [佇列組建],並將變數的值設定為
true,以啟動新的組建。system.debug若要設定所有執行的詳細信息記錄,請編輯組建、流覽至 [變數 ] 索引標籤,然後新增名為
system.debug的變數、將其值設定為true,然後選取 [ 在佇列時間允許]。若要設定 YAML 管線的詳細資訊記錄,請在 區段中新增
system.debug變數variables:variables: system.debug: true
Azure 管線記錄現在可以擷取資源使用率計量,例如記憶體、CPU 使用量和可用的磁碟空間。 記錄也包含管線代理程式和子進程所使用的資源,包括工作在作業中執行的工作。 如果您懷疑管線作業可能會遇到資源條件約束,請啟用詳細信息記錄,讓資源使用率資訊插入管線記錄中。 任何代理程式都可以使用資源使用率計量,與裝載模型無關。
若要檢視擷取的資源使用率計量, 請在記錄中 搜尋 Agent environment resources 每個步驟的專案。
2024-02-28T17:41:15.1315148Z ##[debug]Agent environment resources - Disk: D:\ Available 12342.00 MB out of 14333.00 MB, Memory: Used 1907.00 MB out of 7167.00 MB, CPU: Usage 17.23%
檢視和下載記錄
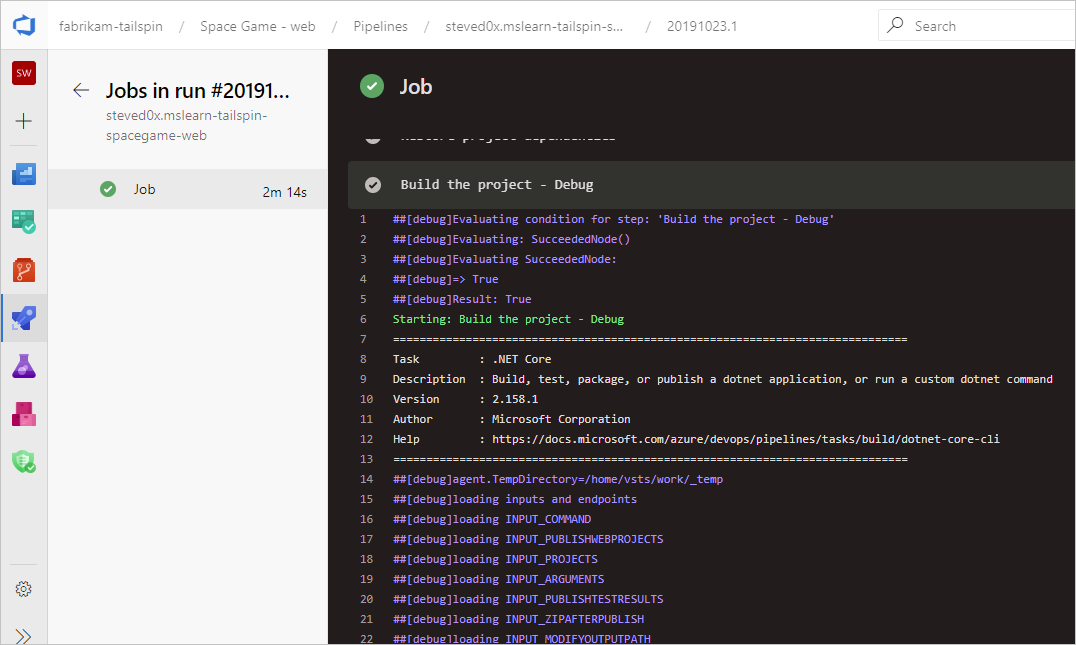
若要檢視每個步驟的個別記錄,請流覽至執行的建置結果,然後選取作業和步驟。
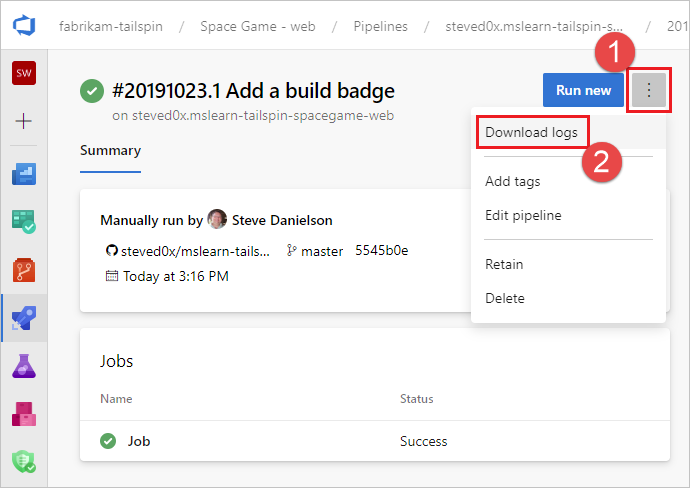
若要下載所有記錄,請流覽至執行中的組建結果,選取 ...,然後選擇 [ 下載記錄]。
若要下載所有記錄,請流覽至執行中的組建結果,選擇 [ 將所有記錄下載為 zip]。
除了管線診斷記錄之外,還有下列特製化記錄類型可供使用,而且可能包含可協助您進行疑難解答的資訊。
背景工作診斷記錄
您可以在組建代理程式上取得背景工作進程所產生的已完成組建診斷記錄。 尋找 worker 具有已完成組建之日期和時間戳的記錄檔。 例如: worker_20160623-192022-utc_6172.log 。
代理程式診斷記錄
代理程式診斷記錄提供代理程式設定方式,以及執行時所發生狀況的記錄。 尋找 agent 記錄檔。 例如: agent_20160624-144630-utc.log 。 代理程式記錄檔有兩種:
執行 時
config.cmd所產生的記錄檔。 此紀錄:包含靠近頂端的這一行:
Adding Command: configure顯示所做的組態選擇。
執行 時
run.cmd所產生的記錄檔。 此紀錄:在進程終止之前,無法開啟。
嘗試連線到您的 Azure DevOps 組織或 Team Foundation Server。
顯示每個作業何時執行,以及其完成方式
這兩個記錄會顯示如何偵測並設定代理程式功能。
自我裝載代理程式的網路診斷
將 Agent.Diagnostic 的值設定為 true,以收集可用來對自我裝載式代理程式的網路問題進行疑難排解的其他記錄。
| 檔案 | 資訊 | 適用於 |
|---|---|---|
cloudinit.* |
Cloud-init 成功完成 (如果使用) | Linux |
BrokenPackages.* |
套件處於一致狀態 | Linux |
Agent.* |
環境變數 | Linux、Windows |
waagentConf.txt |
Azure VM 代理程序 (waagent.conf) | Azure:Linux、Windows |
environment.txt / agent.* |
帳戶群組成員資格清單 | Windows |
注意
System.Debug 如果設定為 true,Agent.Diagnostic 會自動設定為 true。
Agent.Diagnostic本節所述的變數和記錄適用於 Agent v2.200.0 和更新版本。
如需詳細資訊,請參閱 microsoft/azure-pipelines-agent Azure Pipelines 代理程序開放原始碼代理程式存放庫中的代理程式疑難解答。
其他記錄
您會在診斷記錄內找到 environment.txt 與 capabilities.txt。
檔案 environment.txt 具有組建執行所在的環境的各種資訊。 這包括執行哪些工作、是否啟用防火牆、PowerShell 版本資訊,以及其他一些項目等資訊。 我們會持續新增至此數據,使其更實用。
此 capabilities.txt 檔案提供全新的方式來查看執行組建的組建計算機上所安裝的所有功能。
HTTP 追蹤記錄
重要
HTTP 追蹤和追蹤檔案可以包含密碼和其他秘密。 請勿將它們張貼在公用網站上。
使用內建 HTTP 追蹤
如果您的代理程式是 2.114.0 版或更新版本,您可以追蹤 HTTP 流量標頭,並將其寫入診斷記錄中。 啟動 agent.listener 之前, VSTS_AGENT_HTTPTRACE 請先設定環境變數。
Windows:
    set VSTS_AGENT_HTTPTRACE=true

macOS/Linux:
    export VSTS_AGENT_HTTPTRACE=true
使用完整的 HTTP 追蹤 - Windows
啟動 Fiddler。
建議您只接聽代理程式流量。 檔案 > 擷取流量關閉 (F12)
啟用解密 HTTPS 流量。 [工具 > Fiddler 選項 HTTPS] 索引 > 標籤。解密 HTTPS 流量
讓代理程式知道使用 Proxy:
set VSTS_HTTP_PROXY=http://127.0.0.1:8888以互動方式執行代理程式。 如果您是以服務身分執行,您可以在服務執行身分的帳戶控制面板中設定為環境變數。
重新啟動代理程式。
使用完整的 HTTP 追蹤 - macOS 和 Linux
使用 Charles Proxy (類似於 Windows 上的 Fiddler)來擷取代理程式的 HTTP 追蹤。
啟動 Charles Proxy。
Charles:Proxy Proxy > 設定 > SSL 索引標籤。啟用。 新增 URL。
Charles:Proxy > Mac OSX Proxy。 建議停用,只查看代理程式流量。
export VSTS_HTTP_PROXY=http://127.0.0.1:8888以互動方式執行代理程式。 如果是以服務的形式執行,您可以在 .env 檔案中設定 。 請參閱nix service
重新啟動代理程式。
擷取自定義記錄
除了內建記錄之外,您還可以使用工作和腳本來擷取管線中的自定義記錄。 下列範例示範如何擷取資源使用率、網路追蹤、記憶體傾印和 perfview 追蹤。 如果您使用客戶支援,系統可能會要求您擷取這類記錄。
- 擷取資源使用率詳細數據
- 使用 ProcDump 擷取 dotnet 進程記憶體轉儲
- 擷取託管代理程式的 ETW 追蹤
- Capture perfview traces for Visual Studio build
擷取自定義記錄
在管線中擷取自定義記錄之後,您必須上傳它,才能擷取以供檢閱。 您可以將自定義記錄上傳為標準管線記錄的一部分,也可以上傳為成品。 下列各節中的範例顯示上傳自定義記錄的兩種方式。
將記錄上傳為標準記錄的一部分
若要將自定義記錄上傳為標準管線記錄的一部分,請使用 ##vso[task.uploadfile] 來上傳所需的檔案。 若要使用此命令,請將它指定為腳本命令的一部分,如下列範例所示。 檔案可以 下載並檢視 為標準管線記錄的一部分。 方法 ##vso[task.uploadfile] 很適合上傳單一記錄檔。 如果您有一個以上的記錄檔,則必須針對每個檔案使用不同的 ##vso[task.uploadfile] 行。
- pwsh: Write-Host "##vso[task.uploadfile]$(Agent.TempDirectory)\resource-usage.txt"
如需詳細資訊,請參閱 記錄命令 和 UploadFile:上傳可使用工作記錄下載的檔案。
將記錄上傳為管線成品
若要將自定義記錄上傳為管線成品,請使用 PublishPipelineArtifact@1 工作。 PublishPipelineArtifact@1 可以上傳單一檔案或目錄路徑中的檔案,而且如果您有許多要上傳的自定義記錄檔,則很有用。
- task: PublishPipelineArtifact@1
  inputs:
    targetPath: '$(Pipeline.Workspace)/s/trace'
    artifact: 'file_result.pcap'
    publishLocation: 'pipeline'
如需詳細資訊,請參閱 發佈管線成品。
擷取資源使用率詳細數據
使用 Azure DevOps Services 時,您可以藉由啟用 詳細信息記錄,在記錄中看到資源使用率,包括磁碟使用量、記憶體使用量和 CPU 使用率。 當管線完成時,搜尋Agent environment resources每個步驟的項目記錄。
2024-02-28T17:41:15.1315148Z ##[debug]Agent environment resources - Disk: D:\ Available 12342.00 MB out of 14333.00 MB, Memory: Used 1907.00 MB out of 7167.00 MB, CPU: Usage 17.23%
如果您使用 Azure DevOps Server,或想要收集其他計量,您可以使用 PowerShell 來擷取資源使用率,並將它上傳至管線記錄。 當管線執行完成時,您可以 下載管線記錄並檢視擷取的數據。 Upload resource usage from pipeline run如果步驟是作業中的第六個步驟,則記錄檔中的檔名將會6_resource-usage.txt。
# Place this task in your pipeline to log the current resource utilization
# of the pipeline. This task appends the specified resource usage to a logfile
# which is uploaded at the end of the current pipeline job.
- pwsh: |
      $logFile = '$(Agent.TempDirectory)\resource-usage.txt'
      if (!(Test-Path $logFile))
      {
        New-Item $logFile
      }
      Get-Date | Out-File -FilePath $logFile -Append
      Get-Volume | Out-File -FilePath $logFile -Append
      Get-Counter '\Memory\Available MBytes' | Out-File -FilePath $logFile -Append
      Get-Counter '\Processor(_Total)\% Processor Time' | Out-File -FilePath $logFile -Append
      sleep 10
  displayName: 'Check resource utilization'

# Other tasks here, and you can repeat the "Check resource utilization"
# step if desired, and the results will be appended to the resource-usage.txt file

- pwsh: Write-Host "##vso[task.uploadfile]$(Agent.TempDirectory)\resource-usage.txt"
  displayName: 'Upload resource usage from pipeline run'
  condition: always()
使用 ProcDump 擷取 dotnet 進程記憶體轉儲
如果您有當機的測試執行,客戶支援可能會要求您在測試執行失敗之後擷取 dotnet 進程的記憶體轉儲。 使用 condition: always()在 Visual Studio 測試工作之後新增下列工作。 當管線執行完成時,您可以 下載管線記錄,包括記憶體轉儲。
# Run this task after your test execution crashes
# with a condition of alway() so that it always runs
- pwsh: |
    Invoke-WebRequest https://download.sysinternals.com/files/Procdump.zip -OutFile $(Agent.TempDirectory)\Procdump.zip
    mkdir $(Agent.TempDirectory)\Procdump
    unzip $(Agent.TempDirectory)\Procdump.zip -d Procdump
    cd $(Agent.TempDirectory)\Procdump
    Get-Process dotnet | % { $(Agent.TempDirectory)\procdump.exe -accepteula -ma $_.Id dotnet-$($_.Id).dmp }
    Compress-Archive *.dmp -DestinationPath $(Agent.TempDirectory)\dump_files.zip
    Write-Host "##vso[task.uploadfile]$(Agent.TempDirectory)\dump_files.zip"
  condition: always()
  displayName: 'Create and upload a dotnet process memory dump'
擷取託管代理程式的 ETW 追蹤
如果您要針對 Microsoft 裝載的代理程式的網路問題進行疑難解答,客戶支援可能會要求您收集 ETW 追蹤。 當管線執行完成時,可以下載管線記錄,包括 ETW 追蹤。
# Add this task to start the ETW trace
- script: netsh trace start scenario=InternetClient capture=yes tracefile=$(Agent.TempDirectory)\networktrace.etl
  displayName: 'Start ETW trace'

# Other tasks here

# Add these 2 tasks to stop the trace and upload
# the trace to the pipeline logs
- script: netsh trace stop
  displayName: 'Stop ETW trace'

- pwsh: |
    Write-Host "##vso[task.uploadfile]$(Agent.TempDirectory)\networktrace.etl"
    Write-Host "##vso[task.uploadfile]$(Agent.TempDirectory)\networktrace.cab"
  displayName: 'Upload ETW trace logs'
擷取 perfview Visual Studio 組建的追蹤
如果客戶支援要求您建立 perfview Visual Studio 組建的追蹤,請在 Visual Studio 建置步驟前後,將下列工作新增至管線。
執行管線之後,您可以從管線執行詳細數據下載 PerfViewLog 成品,並傳送該檔案客戶支援。
steps:
- task: PowerShell@2 # download the perfview exe
  inputs:
    targetType: 'inline'
    script: |
      invoke-webrequest https://github.com/microsoft/perfview/releases/download/v3.1.7/PerfView.exe -OutFile PerfView.exe

- task: PowerShell@2
  inputs:
    targetType: 'inline' # start perfview to capture the traces before build build task
    script: '$(System.DefaultWorkingDirectory)\PerfView.exe "/DataFile:PerfViewData.etl" /accepteula /BufferSizeMB:512 /StackCompression /CircularMB:5000 /Providers:"Microsoft-Windows-IIS" /logfile:"PerfView.log" /zip:true /norundown start'

- task: VSBuild@1
  displayName: '$(solution)' # build of the solution, note the msbuildargs might be different for your scenario
  inputs:
    solution: '$(solution)'
    clean: true
    msbuildArgs: '/p:DeployOnBuild=true /p:PrecompileBeforePublish=true /p:WebPublishMethod=Package /p:PackageAsSingleFile=true /p:SkipInvalidConfigurations=true /p:PackageLocation="$(Build.ArtifactStagingDirectory)" /p:TransformWebConfigEnabled=false /p:AutoParameterizationWebConfigConnectionStrings=false /p:MarkWebConfigAssistFilesAsExclude=false /p:ProfileTransformWebConfigEnabled=false /p:IsTransformWebConfigDisabled=true'
    platform: '$(buildPlatform)'
    configuration: '$(buildConfiguration)'

- task: PowerShell@2 # stop the perfview tracing
  inputs:
    targetType: 'inline'
    script: |
      $(System.DefaultWorkingDirectory)\perfview.exe /accepteula /logfile:"PerfView.log" stop

- task: PowerShell@2 # abort perfview, it seems required.
  inputs:
    targetType: 'inline'
    script: '$(System.DefaultWorkingDirectory)\perfview.exe /accepteula /logfile:"PerfView.log" abort'

- task: PowerShell@2 # add a sleep of 5 mins, to givet time for required for traces to be complete
  inputs:
    targetType: 'inline'
    script: 'Start-Sleep -Seconds 300'

- task: PublishPipelineArtifact@1 # upload the traces
  displayName: 'Publish Pipeline Artifact'
  inputs:
    artifactName: webapp