啟用 Application Insights 來監視 API 要求、失敗和追蹤資訊。
重要
Application Insights 擁有 Azure Static Web Apps 的獨立定價模式。
注意
要搭配 Azure Static Web Apps 使用 Application Insights,就需要具有 API 的應用程式。
新增監視功能
利用下列步驟將 Application Insights 監視新增至您的靜態 Web 應用程式。
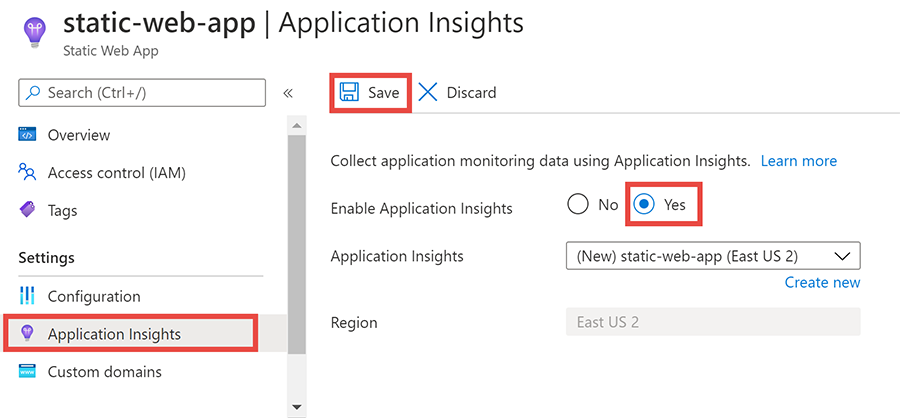
在 Azure 入口網站中開啟 Static Web Apps 執行個體。
從功能表中選取 [Application Insights]。
在啟用 Application Insights 旁邊,選取是。
選擇 <儲存>。
建立 Application Insights 執行個體之後,它會在用來連結服務的 Azure Static Web Apps 執行個體中建立相關聯的應用程式設定。
注意
如果您想要追蹤端對端用戶端如何使用您 Web 應用程式的不同功能,您可以在 JavaScript 程式碼中插入追蹤呼叫。 如需詳細資訊,請參閱適用於網頁的 Application Insights。
存取資料
在您靜態 Web 應用程式中的 [概觀] 視窗中,選取 [資源群組] 旁的連結。
在清單中選取具有與靜態 Web 應用程式相同名稱前綴的 Application Insights 執行個體。
下表醒目提示了入口網站中的幾個位置,您可以用它們來檢查您應用程式 API 端點的各個層面。
注意
如需 Application Insights 使用方式的詳細資訊,請參閱 AppInsights 概觀。
| 類型 | 功能表的位置 | 描述 |
|---|---|---|
| 失敗 | 調查>失敗 | 檢閱失敗的要求。 |
| 伺服器要求 | 調查效能> | 檢閱個別 API 要求。 |
| 記錄 | 監視>日誌 | 與編輯器互動以查詢交易記錄。 |
| 計量 | 監視 > 計量 | 與設計師互動以使用各種指標建立自訂圖表。 |
痕跡
利用以下步驟來檢視應用程式中的追蹤。
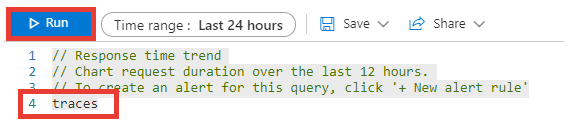
選取 [監視] 下方的 [記錄]。
將滑鼠懸停在 [查詢] 視窗中的任何卡片上。
選取 載入編輯器。
以
traces這個字取代產生的查詢。選取執行。
限制記錄
在某些情況下,您會想要限制記錄,而且同時還要能擷取錯誤和警告的詳細資料。 若要這樣做,您可以對 Azure Functions 應用程式的 host.json 檔案進行以下變更。
{
    "version": "2.0",
    "logging": {
        "applicationInsights": {
            "samplingSettings": {
              "isEnabled": true
            },
            "enableDependencyTracking": false
        },
        "logLevels": {
            "default": "Warning"
        }
    }
}