Azure Kubernetes 網路原則
網路原則提供 Pod 的微型分割,就像網路安全性群組 (NSG) 提供 VM 的微型分割一樣。 Azure 網路原則管理員實作支援標準 Kubernetes 網路原則規格。 您可以使用標籤選取一組 Pod,並定義輸入和輸出規則清單,以篩選進出這些 Pod 的流量。 在 Kubernetes 文件中深入了解 Kubernetes 網路原則。
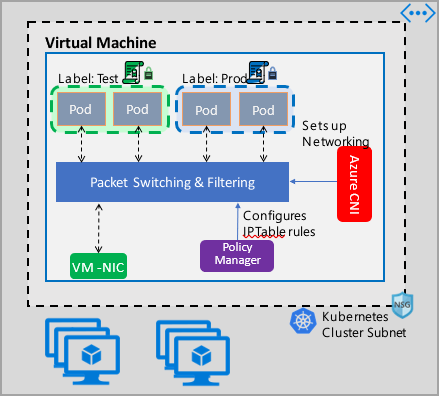
Azure 網路原則管理實作與 Azure CNI 搭配運作,而 Azure CNI 提供容器的虛擬網路整合。 Linux 和 Windows Server 支援網路原則管理員。 此實作會根據定義的原則,在 Linux IPTables 或 Windows Server 主機網路服務 (HNS) ACLPolicy 中設定允許和拒絕 IP 規則,以強制執行流量篩選。
規劃 Kubernetes 叢集的安全性
實作叢集的安全性時,請使用網路安全性群組 (NSG) 來篩選進出叢集子網路的流量 (南北向流量)。 使用 Azure 網路原則管理員,來管理叢集中 Pod 之間的流量 (東西向流量)。
使用 Azure 網路原則管理員
您可以透過下列方式使用 Azure 網路原則管理員,以提供 Pod 的微型分割。
Azure Kubernetes Service (AKS)
網路原則管理員可在 AKS 中以原生方式提供,而且可以在建立叢集時啟用。
如需詳細資訊,請參閱使用 Azure Kubernetes Service (AKS) 中的網路原則來保護 Pod 之間的流量。
在 Azure 中自助式 (DIY) 建立 Kubernetes 叢集
對於 DIY 叢集,請先安裝 CNI 外掛程式,並在叢集的每部虛擬機器上啟用它。 如需詳細指示,請參閱部署自行部署的 Kubernetes 叢集外掛程式。
部署叢集之後,請執行下列 kubectl 命令下載 Azure 網路原則管理員 daemonset,並將其套用至叢集。
針對 Linux:
kubectl apply -f https://raw.githubusercontent.com/Azure/azure-container-networking/master/npm/azure-npm.yaml
適用於 Windows:
kubectl apply -f https://raw.githubusercontent.com/Azure/azure-container-networking/master/npm/examples/windows/azure-npm.yaml
解決方案也是開放原始碼,而程式碼位於 Azure Container Networking repository (Azure 容器網路存放庫)。
使用 Azure NPM 監視和視覺化網路設定
Azure 網路原則管理員包含資訊豐富的 Prometheus 計量,可讓您監視及進一步了解您的設定。 它會在 Azure 入口網站或 Grafana Labs 中提供內建視覺效果。 您可使用 Azure 監視器或 Prometheus 伺服器開始收集這些計量。
Azure 網路原則管理員計量的優點
使用者之前只能透過在叢集節點內部執行的 iptables 和 ipset 命令來了解其網路設定,這會產生冗長且難以了解的輸出。
整體而言,計量會提供:
原則、ACL 規則、ipset、ipset 項目,和任何指定 ipset 中的項目計數
個別 OS 呼叫的執行時間,以及處理 kubernetes 資源事件的執行時間 (中位數、第 90 個百分位數和第 99 個百分位數)
處理 kubernetes 資源事件的失敗資訊 (當 OS 呼叫失敗時,這些資源事件會失敗)
範例計量使用案例
透過 Prometheus AlertManager 的警示
請參閱下方這些警示的設定。
當網路原則管理員出現 OS 呼叫失敗,或在轉譯網路原則時發出警示。
在套用建立事件變更的中位數時間超過 100 毫秒時發出警示。
透過我們的 Grafana 儀表板或 Azure 監視器活頁簿進行視覺化和偵錯
查看您的原則建立了多少個 IPTables 規則,(擁有大量 IPTables 規則可能會稍微增加延遲)。
將叢集計數 (例如 ACL) 與執行時間相互關聯。
取得指定 IPTables 規則中 ipset 的易記名稱 (例如,
azure-npm-487392代表podlabel-role:database)。
所有支援的計量
以下是支援計量的清單。 任何 quantile 標籤都具有可能的值 0.5、0.9 和 0.99。 任何 had_error 標籤都具有可能的值 false 和 true,表示作業成功或失敗。
| 標準名稱 | 描述 | Prometheus 計量類型 | 標籤 |
|---|---|---|---|
npm_num_policies |
網路原則數目 | 量測計 | - |
npm_num_iptables_rules |
IPTable 規則數目 | 量測計 | - |
npm_num_ipsets |
IPSet 數目 | 量測計 | - |
npm_num_ipset_entries |
所有 IPSet 中的 IP 位址項目數 | 量測計 | - |
npm_add_iptables_rule_exec_time |
新增 IPTable 規則的執行階段 | 摘要 | quantile |
npm_add_ipset_exec_time |
新增 IPSet 的執行階段 | 摘要 | quantile |
npm_ipset_counts (進階) |
每個個別 IPSet 中的項目數 | GaugeVec | set_name & set_hash |
npm_add_policy_exec_time |
新增網路原則的執行階段 | 摘要 | quantile & had_error |
npm_controller_policy_exec_time |
更新/刪除網路原則的執行階段 | 摘要 | quantile、had_error 和 operation (具有 update 或 delete 的值) |
npm_controller_namespace_exec_time |
用來建立/更新/刪除命名空間的執行階段 | 摘要 | quantile、had_error 和 operation (具有 create、update 或 delete 的值) |
npm_controller_pod_exec_time |
用來建立/更新/刪除 Pod 的執行階段 | 摘要 | quantile、had_error 和 operation (具有 create、update 或 delete 的值) |
且每個 "exec_time" 摘要計量還有 "exec_time_count" 和 "exec_time_sum" 計量。
您可以透過適用於容器的 Azure 監視器或透過 Prometheus 來抓取這些計量。
進行 Azure 監視器設定
第一個步驟是為您的 Kubernetes 叢集啟用適用於容器 Azure 監視器。 如需步驟說明,請參閱適用於容器的 Azure 監視器概觀。 啟用適用於容器的 Azure 監視器之後,請設定適用於容器 ConfigMap 的 Azure 監視器,以啟用網路原則管理員整合,並收集 Prometheus 網路原則管理員計量。
適用於容器 ConfigMap 的 Azure 監視器在 integrations 區段中,會設定為收集網路原則管理員計量。
這些設定在 ConfigMap 中預設為停用。 啟用基本設定 collect_basic_metrics = true,會收集基本網路原則管理員計量。 啟用進階設定 collect_advanced_metrics = true,則除了基本計量外,還會收集進階計量。
編輯 ConfigMap 之後,請將它儲存在本機,並將 ConfigMap 套用至您的叢集,如下所示。
kubectl apply -f container-azm-ms-agentconfig.yaml
以下是適用於容器 ConfigMap 的 Azure 監視器內容片段,其中顯示已啟用網路原則管理員整合與進階計量收集。
integrations: |-
    [integrations.azure_network_policy_manager]
        collect_basic_metrics = false
        collect_advanced_metrics = true
進階計量是選用功能,而啟用這些功能會自動開啟基本計量收集。 進階計量目前僅包含 Network Policy Manager_ipset_counts。
深入了解 ConfigMap 中適用於容器的 Azure 監視器收集設定。
Azure 監視器的視覺效果選項
啟用網路原則管理員計量收集之後,您就可以在 Azure 入口網站中使用「容器深入解析」或在 Grafana 中檢視計量。
在 Azure 入口網站中檢視叢集的深入解析內容
開啟 Azure 入口網站。 在叢集的深入解析中瀏覽至 [活頁簿],然後開啟 [網路原則管理員 (NPM) 設定]。
除了檢視活頁簿外,您也可以在深入解析區段下的 [記錄] 中直接查詢 Prometheus 計量。 例如,此查詢會傳回收集到的所有計量。
| where TimeGenerated > ago(5h)
| where Name contains "npm_"
您也可以直接查詢記錄分析以取得這些計量資料。 如需詳細資訊,請參閱開始使用 Log Analytics 查詢。
在 Grafana 儀表板中檢視
設定您的 Grafana 伺服器並設定記錄分析資料來源,如此處所述。 然後將 Grafana 儀表板與 Log Analytics 後端匯入您的 Grafana Labs。
儀表板的視覺效果與 Azure 活頁簿類似。 您可以將面板新增至圖表,並以視覺效果呈現 InsightsMetrics 資料表中的網路原則管理員計量。
設定 Prometheus 伺服器
有些使用者可能會選擇使用 Prometheus 伺服器來收集計量,而不是使用適用於容器的 Azure 監視器。 您只需要將兩個工作新增至抓取設定,即可收集網路原則管理員計量。
若要安裝 Prometheus 伺服器,請將此 helm 存放庫新增至您的叢集:
helm repo add stable https://kubernetes-charts.storage.googleapis.com
helm repo update
然後新增伺服器
helm install prometheus stable/prometheus -n monitoring \
--set pushgateway.enabled=false,alertmanager.enabled=false, \
--set-file extraScrapeConfigs=prometheus-server-scrape-config.yaml
其中 prometheus-server-scrape-config.yaml 包含:
- job_name: "azure-npm-node-metrics"
  metrics_path: /node-metrics
  kubernetes_sd_configs:
  - role: node
  relabel_configs:
  - source_labels: [__address__]
    action: replace
    regex: ([^:]+)(?::\d+)?
    replacement: "$1:10091"
    target_label: __address__
- job_name: "azure-npm-cluster-metrics"
  metrics_path: /cluster-metrics
  kubernetes_sd_configs:
  - role: service
  relabel_configs:
  - source_labels: [__meta_kubernetes_namespace]
    regex: kube-system
    action: keep
  - source_labels: [__meta_kubernetes_service_name]
    regex: npm-metrics-cluster-service
    action: keep
# Comment from here to the end to collect advanced metrics: number of entries for each IPSet
  metric_relabel_configs:
  - source_labels: [__name__]
    regex: npm_ipset_counts
    action: drop
您也可以使用下列內容來取代 azure-npm-node-metrics 工作,或將其納入 Kubernetes Pod 的預先存在工作:
- job_name: "azure-npm-node-metrics-from-pod-config"
  metrics_path: /node-metrics
  kubernetes_sd_configs:
  - role: pod
  relabel_configs:
  - source_labels: [__meta_kubernetes_namespace]
    regex: kube-system
    action: keep
  - source_labels: [__meta_kubernetes_pod_annotationpresent_azure_Network Policy Manager_scrapeable]
    action: keep
  - source_labels: [__address__]
    action: replace
    regex: ([^:]+)(?::\d+)?
    replacement: "$1:10091"
    target_label: __address__
設定 AlertManager 的警示
如果您使用 Prometheus 伺服器,您可以像這樣設定 AlertManager。 以下是先前所述的兩個警示規則範例設定:
groups:
- name: npm.rules
  rules:
  # fire when Network Policy Manager has a new failure with an OS call or when translating a Network Policy (suppose there's a scraping interval of 5m)
  - alert: AzureNetwork Policy ManagerFailureCreatePolicy
    # this expression says to grab the current count minus the count 5 minutes ago, or grab the current count if there was no data 5 minutes ago
    expr: (npm_add_policy_exec_time_count{had_error='true'} - (npm_add_policy_exec_time_count{had_error='true'} offset 5m)) or npm_add_policy_exec_time_count{had_error='true'}
    labels:
      severity: warning
      addon: azure-npm
    annotations:
      summary: "Azure Network Policy Manager failed to handle a policy create event"
      description: "Current failure count since Network Policy Manager started: {{ $value }}"
  # fire when the median time to apply changes for a pod create event is more than 100 milliseconds.
  - alert: AzurenpmHighControllerPodCreateTimeMedian
    expr: topk(1, npm_controller_pod_exec_time{operation="create",quantile="0.5",had_error="false"}) > 100.0
    labels:
      severity: warning
      addon: azure-Network Policy Manager
    annotations:
      summary: "Azure Network Policy Manager controller pod create time median > 100.0 ms"
      # could have a simpler description like the one for the alert above,
      # but this description includes the number of pod creates that were handled in the past 10 minutes,
      # which is the retention period for observations when calculating quantiles for a Prometheus Summary metric
      description: "value: [{{ $value }}] and observation count: [{{ printf `(npm_controller_pod_exec_time_count{operation='create',pod='%s',had_error='false'} - (npm_controller_pod_exec_time_count{operation='create',pod='%s',had_error='false'} offset 10m)) or npm_controller_pod_exec_time_count{operation='create',pod='%s',had_error='false'}` $labels.pod $labels.pod $labels.pod | query | first | value }}] for pod: [{{ $labels.pod }}]"
Prometheus 的視覺效果選項
當您使用 Prometheus 伺服器時,僅可運用 Grafana 儀表板。
請設定 Grafana 伺服器並設定 Prometheus 資料來源 (如果您還沒有這麼做)。 然後將 Grafana 儀表板與 Prometheus 後端匯入您的 Grafana Labs。
此儀表板視覺效果與具有容器深入解析/記錄分析後端的儀表板相同。
範例儀表板
以下是一些範例儀表板,適用於容器深入解析 (CI) 和 Grafana 中的網路原則管理員計量。
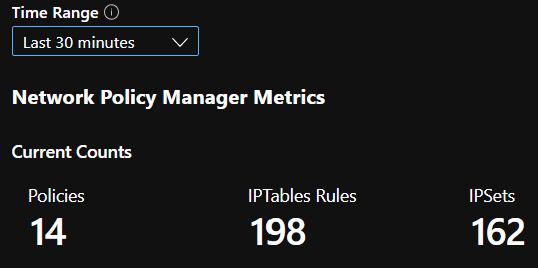
CI 摘要計數
一段時間的 CI 計數

CI IPSet 項目

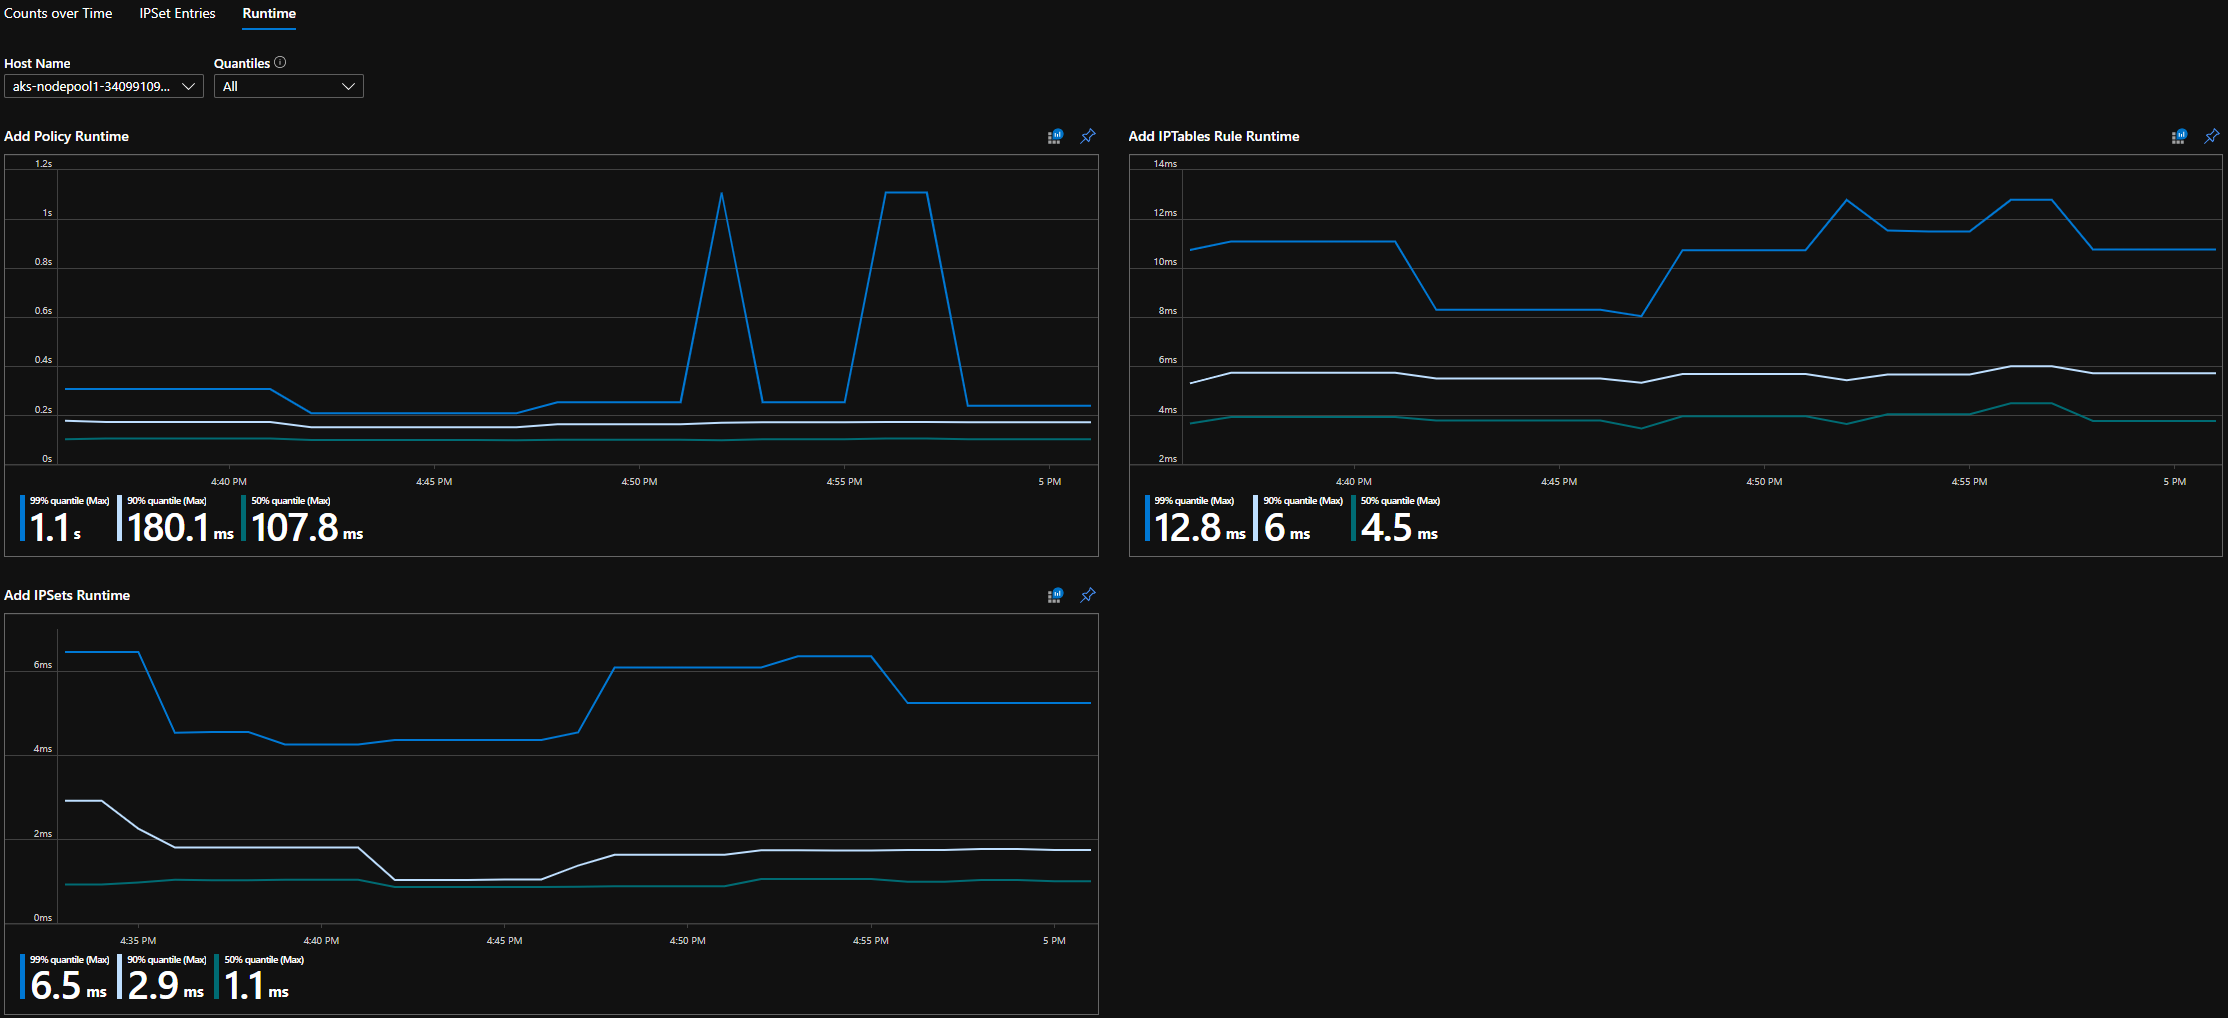
CI 執行階段分位數
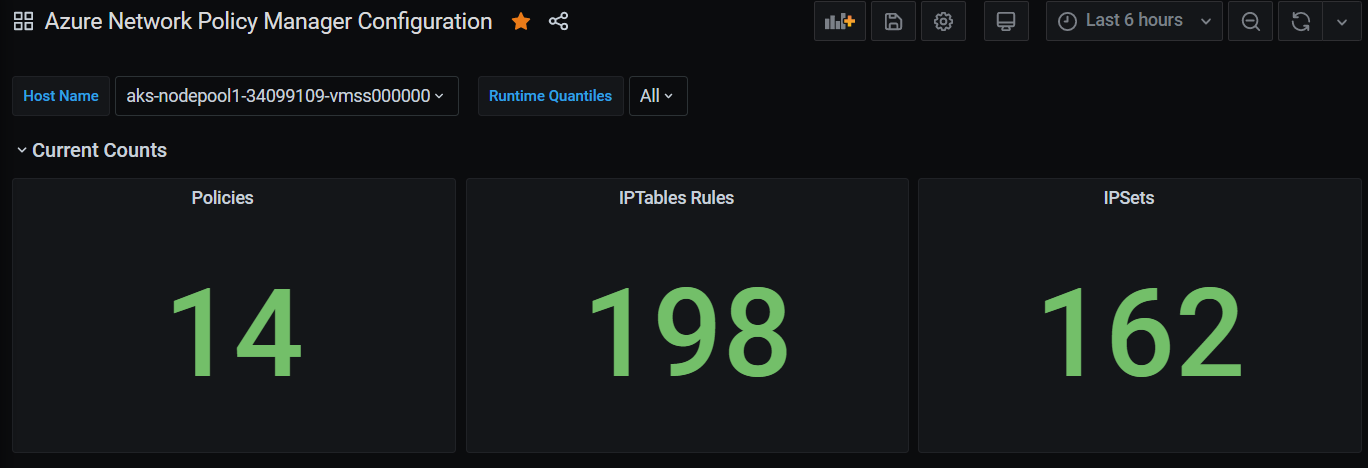
Grafana 儀表板摘要計數
Grafana 儀表板一段時間的計數

Grafana 儀表板 IPSet 項目

Grafana 儀表板執行階段分位數
