本文適用於:✔️ .NET 9.0 和更新版本
在本教學課程中,您將瞭解如何偵錯 ThreadPool 饑餓案例。 當集區沒有可用的線程可處理新的工作專案,而且通常會導致應用程式回應緩慢時,就會發生 ThreadPool 饑餓。 使用提供的 範例 ASP.NET Core Web 應用程式,您可以刻意造成 ThreadPool 饑餓,並瞭解如何診斷它。
在本教學課程中,您將:
- 調查正在緩慢回應要求的應用程式
- 使用 dotnet-counters 工具來識別線程集區饑餓可能發生
- 使用 dotnet-stack 和 dotnet-trace 工具來判斷哪些工作讓 ThreadPool 線程保持忙碌
先決條件
本教學課程使用:
- 用來建置和執行範例應用程式的 .NET 9 SDK
- 示範 ThreadPool 饑餓行為的範例 Web 應用程式
- 龐巴迪 為範例 Web 應用程式產生負載
- 觀察性能計數器的 dotnet-counters
- 用來檢查線程堆疊的工具dotnet-stack
- 用 dotnet-trace 收集等候事件
- 選擇性: PerfView 分析等候事件
執行範例應用程式
下載 範例應用程式的 程式代碼,並使用 .NET SDK 執行:
E:\demo\DiagnosticScenarios>dotnet run
Using launch settings from E:\demo\DiagnosticScenarios\Properties\launchSettings.json...
info: Microsoft.Hosting.Lifetime[14]
      Now listening on: https://localhost:5001
info: Microsoft.Hosting.Lifetime[14]
      Now listening on: http://localhost:5000
info: Microsoft.Hosting.Lifetime[0]
      Application started. Press Ctrl+C to shut down.
info: Microsoft.Hosting.Lifetime[0]
      Hosting environment: Development
info: Microsoft.Hosting.Lifetime[0]
      Content root path: E:\demo\DiagnosticScenarios
如果您使用網頁瀏覽器並將要求傳送至 https://localhost:5001/api/diagscenario/taskwait,您應該會看到大約 500 毫秒之後傳回的回應 success:taskwait 。 這會顯示網頁伺服器正在如預期般提供流量。
觀察到效能變慢
示範 Web 伺服器有數個端點,其模擬會執行資料庫要求,然後傳回回應給使用者。 每一個端點在一次提供要求時會有大約 500 毫秒的延遲,但當 Web 伺服器受到某些負載的影響時,效能會更糟。 下載 Bombardier 負載測試工具,並觀察將 125 個並行要求傳送至每個端點時的延遲差異。
bombardier-windows-amd64.exe https://localhost:5001/api/diagscenario/taskwait
Bombarding https://localhost:5001/api/diagscenario/taskwait for 10s using 125 connection(s)
[=============================================================================================] 10s
Done!
Statistics        Avg      Stdev        Max
  Reqs/sec        33.06     234.67    3313.54
  Latency         3.48s      1.39s     10.79s
  HTTP codes:
    1xx - 0, 2xx - 454, 3xx - 0, 4xx - 0, 5xx - 0
    others - 0
  Throughput:    75.37KB/s
第二個端點會使用程序代碼模式來執行更糟的情況:
bombardier-windows-amd64.exe https://localhost:5001/api/diagscenario/tasksleepwait
Bombarding https://localhost:5001/api/diagscenario/tasksleepwait for 10s using 125 connection(s)
[=============================================================================================] 10s
Done!
Statistics        Avg      Stdev        Max
  Reqs/sec         1.61      35.25     788.91
  Latency        15.42s      2.18s     18.30s
  HTTP codes:
    1xx - 0, 2xx - 140, 3xx - 0, 4xx - 0, 5xx - 0
    others - 0
  Throughput:    36.57KB/s
當負載高時,這兩個端點都明顯超過 500 毫秒的平均延遲(分別為 3.48 秒和 15.42 秒)。 如果您在舊版 .NET Core 上執行此範例,您可能會看到這兩個範例執行得同樣糟糕。 .NET 6 已更新 ThreadPool 啟發學習法,以減少第一個範例中使用的不良編碼模式效能影響。
偵測 ThreadPool 饑餓
如果您在真實世界服務上觀察到上述行為,您會知道其回應速度很慢,但您不知道原因。 dotnet-counters 是可顯示即時性能計數器的工具。 這些計數器可以提供某些問題的線索,而且通常很容易得到。 在生產環境中,您可能會有遠端監視工具和 Web 儀錶板所提供的類似計數器。 安裝 dotnet-counters 並開始監視 Web 服務:
dotnet-counters monitor -n DiagnosticScenarios
Press p to pause, r to resume, q to quit.
    Status: Running

Name                                                            Current Value
[System.Runtime]
    dotnet.assembly.count ({assembly})                               115
    dotnet.gc.collections ({collection})
        gc.heap.generation
        ------------------
        gen0                                                           2
        gen1                                                           1
        gen2                                                           1
    dotnet.gc.heap.total_allocated (By)                       64,329,632
    dotnet.gc.last_collection.heap.fragmentation.size (By)
        gc.heap.generation
        ------------------
        gen0                                                     199,920
        gen1                                                      29,208
        gen2                                                           0
        loh                                                           32
        poh                                                            0
    dotnet.gc.last_collection.heap.size (By)
        gc.heap.generation
        ------------------
        gen0                                                     208,712
        gen1                                                   3,456,000
        gen2                                                   5,065,600
        loh                                                       98,384
        poh                                                    3,147,488
    dotnet.gc.last_collection.memory.committed_size (By)      31,096,832
    dotnet.gc.pause.time (s)                                           0.024
    dotnet.jit.compilation.time (s)                                    1.285
    dotnet.jit.compiled_il.size (By)                             565,249
    dotnet.jit.compiled_methods ({method})                         5,831
    dotnet.monitor.lock_contentions ({contention})                   148
    dotnet.process.cpu.count ({cpu})                                  16
    dotnet.process.cpu.time (s)
        cpu.mode
        --------
        system                                                         2.156
        user                                                           2.734
    dotnet.process.memory.working_set (By)                             1.3217e+08
    dotnet.thread_pool.queue.length ({work_item})                      0
    dotnet.thread_pool.thread.count ({thread})                         0
    dotnet.thread_pool.work_item.count ({work_item})              32,267
    dotnet.timer.count ({timer})                                       0
如果您的應用程式執行的 .NET 版本早於 .NET 9,則 dotnet-counters 的輸出 UI 看起來會稍有不同;如需詳細資訊,請參閱 dotnet-counters 。
上述計數器是網頁伺服器未提供任何要求的範例。 啟動龐巴迪,使用 api/diagscenario/tasksleepwait 端點並持續負載 2 分鐘,這樣可以有足夠的時間觀察性能計數器的變化。
bombardier-windows-amd64.exe https://localhost:5001/api/diagscenario/tasksleepwait -d 120s
當沒有可用線程可處理佇列工作專案,且運行時間會藉由增加 ThreadPool 線程數目來回應時,就會發生 ThreadPool 饑餓。 此值 dotnet.thread_pool.thread.count 會快速增加至機器上處理器核心數目的 2-3 倍,然後進一步線程每秒新增 1-2,直到穩定在高於 125 的某個位置為止。 ThreadPool 資源不足是目前效能瓶頸的指標是 ThreadPool 執行緒緩慢而穩定地增長,CPU 使用率遠低於 100%。 線程數增加將會繼續,直到集區達到線程數目的上限、已建立足夠的線程來滿足所有傳入的工作項目,或 CPU 已飽和為止。 ThreadPool 的耗盡通常會呈現 dotnet.thread_pool.queue.length 值大而 dotnet.thread_pool.work_item.count 值低,這表示有大量的待處理工作,但完成的工作很少。 以下是線程計數仍在上升時的計數器範例:
[System.Runtime]
    dotnet.assembly.count ({assembly})                               115
    dotnet.gc.collections ({collection})
        gc.heap.generation
        ------------------
        gen0                                                           5
        gen1                                                           1
        gen2                                                           1
    dotnet.gc.heap.total_allocated (By)                       1.6947e+08
    dotnet.gc.last_collection.heap.fragmentation.size (By)
        gc.heap.generation
        ------------------
        gen0                                                           0
        gen1                                                     348,248
        gen2                                                           0
        loh                                                           32
        poh                                                            0
    dotnet.gc.last_collection.heap.size (By)
        gc.heap.generation
        ------------------
        gen0                                                           0
        gen1                                                  18,010,920
        gen2                                                   5,065,600
        loh                                                       98,384
        poh                                                    3,407,048
    dotnet.gc.last_collection.memory.committed_size (By)      66,842,624
    dotnet.gc.pause.time (s)                                           0.05
    dotnet.jit.compilation.time (s)                                    1.317
    dotnet.jit.compiled_il.size (By)                             574,886
    dotnet.jit.compiled_methods ({method})                         6,008
    dotnet.monitor.lock_contentions ({contention})                   194
    dotnet.process.cpu.count ({cpu})                                  16
    dotnet.process.cpu.time (s)
        cpu.mode
        --------
        system                                                         4.953
        user                                                           6.266
    dotnet.process.memory.working_set (By)                             1.3217e+08
    dotnet.thread_pool.queue.length ({work_item})                      0
    dotnet.thread_pool.thread.count ({thread})                       133
    dotnet.thread_pool.work_item.count ({work_item})              71,188
    dotnet.timer.count ({timer})                                     124
一旦線程池的線程數量穩定下來,該池就不會再資源不足了。 但是,如果它穩定在高值(處理器核心數目大約三倍以上),這通常表示應用程式程式代碼封鎖了某些 ThreadPool 線程,而 ThreadPool 會藉由執行更多線程來補償。 在高線程數量下穩定運行不一定會對請求延遲造成很大影響,但如果負載隨著時間而大幅變化,或應用程式將定期重新啟動,則每次 ThreadPool 可能會進入一段資源匱乏期間,此期間線程緩慢增加,並導致不佳的請求延遲。 每個線程也會耗用記憶體,因此減少所需的線程總數可提供另一個優點。
從 .NET 6 開始,ThreadPool 的啟發式方法已被修改,以更快速地增加 ThreadPool 線程數目,以因應特定的封鎖 Task API。 線程集區饑餓仍可透過這些 API 發生,但持續時間比舊版 .NET 版本短得多,因為運行時間回應更快。 再次使用 api/diagscenario/taskwait 端點執行 Bombardier:
bombardier-windows-amd64.exe https://localhost:5001/api/diagscenario/taskwait -d 120s
在 .NET 6 上,您應該觀察到集區的線程數量會比以前增加得更快,然後穩定在一個較高的線程數之上。 線程池在線程數目攀升時發生資源飢餓。
解決 ThreadPool 資源不足
要消除 ThreadPool 耗盡,ThreadPool 執行緒必須保持不被阻塞,才能處理傳入的工作專案。 有多種方式可判斷每個線程正在執行的動作。 如果問題只是偶爾發生,則使用 dotnet-trace 收集追蹤的最佳方式是記錄一段時間內的應用程式行為。 如果問題持續發生,您可以使用 dotnet-stack 工具,或擷取 dotnet-dump 傾印,以便可在 Visual Studio 中檢視。 dotnet-stack 可以更快,因為它會在控制臺上立即顯示線程堆棧。 但 Visual Studio 傾印調試提供較佳的視覺化效果,可以將框架對應至源代碼。「只限於我的程式碼」可以篩選掉運行時實作框架,而平行堆疊功能可以協助分組大量具有類似堆疊的線程。 本教學課程示範 dotnet-stack 和 dotnet-trace 選項。 若要查看使用 Visual Studio 調查執行緒堆疊的範例,請參閱診斷線程池飢餓的教學影片。
使用 dotnet-stack 診斷連續問題
重新執行 Bombardier 以對網頁伺服器進行負載測試:
bombardier-windows-amd64.exe https://localhost:5001/api/diagscenario/taskwait -d 120s
然後執行 dotnet-stack 以查看線程堆疊追蹤:
dotnet-stack report -n DiagnosticScenarios
您應該會看到包含大量堆疊的長輸出,其中許多看起來如下:
Thread (0x25968):
  [Native Frames]
  System.Private.CoreLib.il!System.Threading.ManualResetEventSlim.Wait(int32,value class System.Threading.CancellationToken)
  System.Private.CoreLib.il!System.Threading.Tasks.Task.SpinThenBlockingWait(int32,value class System.Threading.CancellationToken)
  System.Private.CoreLib.il!System.Threading.Tasks.Task.InternalWaitCore(int32,value class System.Threading.CancellationToken)
  System.Private.CoreLib.il!System.Threading.Tasks.Task`1[System.__Canon].GetResultCore(bool)
  DiagnosticScenarios!testwebapi.Controllers.DiagScenarioController.TaskWait()
  Anonymously Hosted DynamicMethods Assembly!dynamicClass.lambda_method1(pMT: 00007FF7A8CBF658,class System.Object,class System.Object[])
  Microsoft.AspNetCore.Mvc.Core.il!Microsoft.AspNetCore.Mvc.Infrastructure.ActionMethodExecutor+SyncObjectResultExecutor.Execute(class Microsoft.AspNetCore.Mvc.Infrastructure.IActionResultTypeMapper,class Microsoft.Extensions.Internal.ObjectMethodExecutor,class System.Object,class System.Object[])
  Microsoft.AspNetCore.Mvc.Core.il!Microsoft.AspNetCore.Mvc.Infrastructure.ControllerActionInvoker.InvokeActionMethodAsync()
  Microsoft.AspNetCore.Mvc.Core.il!Microsoft.AspNetCore.Mvc.Infrastructure.ControllerActionInvoker.Next(value class State&,value class Scope&,class System.Object&,bool&)
  Microsoft.AspNetCore.Mvc.Core.il!Microsoft.AspNetCore.Mvc.Infrastructure.ControllerActionInvoker.InvokeNextActionFilterAsync()
  Microsoft.AspNetCore.Mvc.Core.il!Microsoft.AspNetCore.Mvc.Infrastructure.ControllerActionInvoker.Next(value class State&,value class Scope&,class System.Object&,bool&)
  Microsoft.AspNetCore.Mvc.Core.il!Microsoft.AspNetCore.Mvc.Infrastructure.ControllerActionInvoker.InvokeNextActionFilterAsync()
  Microsoft.AspNetCore.Mvc.Core.il!Microsoft.AspNetCore.Mvc.Infrastructure.ControllerActionInvoker.Next(value class State&,value class Scope&,class System.Object&,bool&)
  Microsoft.AspNetCore.Mvc.Core.il!Microsoft.AspNetCore.Mvc.Infrastructure.ControllerActionInvoker.InvokeInnerFilterAsync()
  Microsoft.AspNetCore.Mvc.Core.il!Microsoft.AspNetCore.Mvc.Infrastructure.ResourceInvoker.Next(value class State&,value class Scope&,class System.Object&,bool&)
  Microsoft.AspNetCore.Mvc.Core.il!Microsoft.AspNetCore.Mvc.Infrastructure.ResourceInvoker.InvokeFilterPipelineAsync()
  Microsoft.AspNetCore.Mvc.Core.il!Microsoft.AspNetCore.Mvc.Infrastructure.ResourceInvoker.InvokeAsync()
  Microsoft.AspNetCore.Mvc.Core.il!Microsoft.AspNetCore.Mvc.Routing.ControllerRequestDelegateFactory+<>c__DisplayClass10_0.<CreateRequestDelegate>b__0(class Microsoft.AspNetCore.Http.HttpContext)
  Microsoft.AspNetCore.Routing.il!Microsoft.AspNetCore.Routing.EndpointMiddleware.Invoke(class Microsoft.AspNetCore.Http.HttpContext)
  Microsoft.AspNetCore.Authorization.Policy.il!Microsoft.AspNetCore.Authorization.AuthorizationMiddleware+<Invoke>d__6.MoveNext()
  System.Private.CoreLib.il!System.Runtime.CompilerServices.AsyncMethodBuilderCore.Start(!!0&)
  Microsoft.AspNetCore.Authorization.Policy.il!Microsoft.AspNetCore.Authorization.AuthorizationMiddleware.Invoke(class Microsoft.AspNetCore.Http.HttpContext)
  Microsoft.AspNetCore.HttpsPolicy.il!Microsoft.AspNetCore.HttpsPolicy.HttpsRedirectionMiddleware.Invoke(class Microsoft.AspNetCore.Http.HttpContext)
  Microsoft.AspNetCore.HttpsPolicy.il!Microsoft.AspNetCore.HttpsPolicy.HstsMiddleware.Invoke(class Microsoft.AspNetCore.Http.HttpContext)
  Microsoft.AspNetCore.HostFiltering.il!Microsoft.AspNetCore.HostFiltering.HostFilteringMiddleware.Invoke(class Microsoft.AspNetCore.Http.HttpContext)
  Microsoft.AspNetCore.Server.Kestrel.Core.il!Microsoft.AspNetCore.Server.Kestrel.Core.Internal.Http.HttpProtocol+<ProcessRequests>d__223`1[System.__Canon].MoveNext()
  System.Private.CoreLib.il!System.Threading.ExecutionContext.RunInternal(class System.Threading.ExecutionContext,class System.Threading.ContextCallback,class System.Object)
  System.Private.CoreLib.il!System.Runtime.CompilerServices.AsyncTaskMethodBuilder`1+AsyncStateMachineBox`1[System.Threading.Tasks.VoidTaskResult,Microsoft.AspNetCore.Server.Kestrel.Core.Internal.Http.HttpProtocol+<ProcessRequests>d__223`1[System.__Canon]].MoveNext(class System.Threading.Thread)
  System.Private.CoreLib.il!System.Threading.Tasks.AwaitTaskContinuation.RunOrScheduleAction(class System.Runtime.CompilerServices.IAsyncStateMachineBox,bool)
  System.Private.CoreLib.il!System.Threading.Tasks.Task.RunContinuations(class System.Object)
  System.IO.Pipelines.il!System.IO.Pipelines.StreamPipeReader+<<ReadAsync>g__Core|36_0>d.MoveNext()
  System.Private.CoreLib.il!System.Threading.ExecutionContext.RunInternal(class System.Threading.ExecutionContext,class System.Threading.ContextCallback,class System.Object)
  System.Private.CoreLib.il!System.Runtime.CompilerServices.AsyncTaskMethodBuilder`1+AsyncStateMachineBox`1[System.IO.Pipelines.ReadResult,System.IO.Pipelines.StreamPipeReader+<<ReadAsync>g__Core|36_0>d].MoveNext(class System.Threading.Thread)
  System.Private.CoreLib.il!System.Threading.Tasks.AwaitTaskContinuation.RunOrScheduleAction(class System.Runtime.CompilerServices.IAsyncStateMachineBox,bool)
  System.Private.CoreLib.il!System.Threading.Tasks.Task.RunContinuations(class System.Object)
  System.Private.CoreLib.il!System.Runtime.CompilerServices.AsyncTaskMethodBuilder`1[System.Int32].SetExistingTaskResult(class System.Threading.Tasks.Task`1<!0>,!0)
  System.Net.Security.il!System.Net.Security.SslStream+<ReadAsyncInternal>d__186`1[System.Net.Security.AsyncReadWriteAdapter].MoveNext()
  System.Private.CoreLib.il!System.Threading.ExecutionContext.RunInternal(class System.Threading.ExecutionContext,class System.Threading.ContextCallback,class System.Object)
  System.Private.CoreLib.il!System.Runtime.CompilerServices.AsyncTaskMethodBuilder`1+AsyncStateMachineBox`1[System.Int32,System.Net.Security.SslStream+<ReadAsyncInternal>d__186`1[System.Net.Security.AsyncReadWriteAdapter]].MoveNext(class System.Threading.Thread)
  Microsoft.AspNetCore.Server.Kestrel.Core.il!Microsoft.AspNetCore.Server.Kestrel.Core.Internal.DuplexPipeStream+<ReadAsyncInternal>d__27.MoveNext()
  System.Private.CoreLib.il!System.Threading.ExecutionContext.RunInternal(class System.Threading.ExecutionContext,class System.Threading.ContextCallback,class System.Object)
  System.Private.CoreLib.il!System.Threading.ThreadPoolWorkQueue.Dispatch()
  System.Private.CoreLib.il!System.Threading.PortableThreadPool+WorkerThread.WorkerThreadStart()
這些堆疊底部的框架表示這些線程是 ThreadPool 線程:
  System.Private.CoreLib.il!System.Threading.ThreadPoolWorkQueue.Dispatch()
  System.Private.CoreLib.il!System.Threading.PortableThreadPool+WorkerThread.WorkerThreadStart()
頂端附近的畫面顯示線程在從 DiagnosticScenarioController.TaskWait() 函式呼叫 GetResultCore(bool) 時遭到封鎖:
Thread (0x25968):
  [Native Frames]
  System.Private.CoreLib.il!System.Threading.ManualResetEventSlim.Wait(int32,value class System.Threading.CancellationToken)
  System.Private.CoreLib.il!System.Threading.Tasks.Task.SpinThenBlockingWait(int32,value class System.Threading.CancellationToken)
  System.Private.CoreLib.il!System.Threading.Tasks.Task.InternalWaitCore(int32,value class System.Threading.CancellationToken)
  System.Private.CoreLib.il!System.Threading.Tasks.Task`1[System.__Canon].GetResultCore(bool)
  DiagnosticScenarios!testwebapi.Controllers.DiagScenarioController.TaskWait()
診斷 dotnet-trace 中的間歇性問題
dotnet-stack 方法僅有效於在每次請求中發生的明顯且一致的封鎖作業。 在某些情況下,僅每隔幾分鐘才會發生封鎖,使得 dotnet-stack 對診斷問題不太有用。 在此情況下,您可以使用 dotnet-trace 來收集一段時間的事件,並將其儲存在稍後可分析的 nettrace 檔案中。
有一個特定事件可協助診斷線程集區饑餓:在 .NET 9 中引進的 WaitHandleWait 事件。 當線程因操作而被阻塞時,例如同步處理異步呼叫(如 Task.Result、Task.Wait 和 Task.GetAwaiter().GetResult())或其他鎖定作業(如 lock、Monitor.Enter、ManualResetEventSlim.Wait 和 SemaphoreSlim.Wait),就會發出。
重新執行 Bombardier 以對網頁伺服器進行負載測試:
bombardier-windows-amd64.exe https://localhost:5001/api/diagscenario/taskwait -d 120s
然後執行 dotnet-trace 以收集等候事件:
dotnet trace collect -n DiagnosticScenarios --clrevents waithandle --clreventlevel verbose --duration 00:00:30
這應該會產生名為 DiagnosticScenarios.exe_yyyyddMM_hhmmss.nettrace 的檔案,其中包含事件。 您可以使用兩種不同的工具來分析此 nettrace:
- PerfView:僅限 windows Microsoft 開發的效能分析工具。
- .NET 事件查看器:社群開發的 nettrace 分析 Blazor Web 工具。
下列各節說明如何使用每個工具來讀取 nettrace 檔案。
使用 Perfview 分析該 nettrace
下載 PerfView 並加以執行。
開啟 nettrace 檔案的方法是按兩下它。
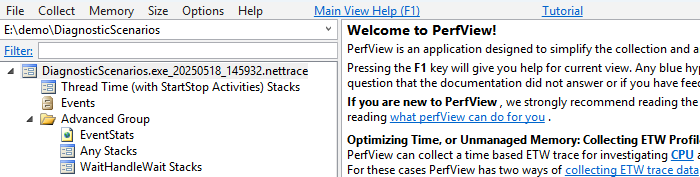
按兩下 [ 進階群組>任何堆疊]。 新的視窗隨即開啟。
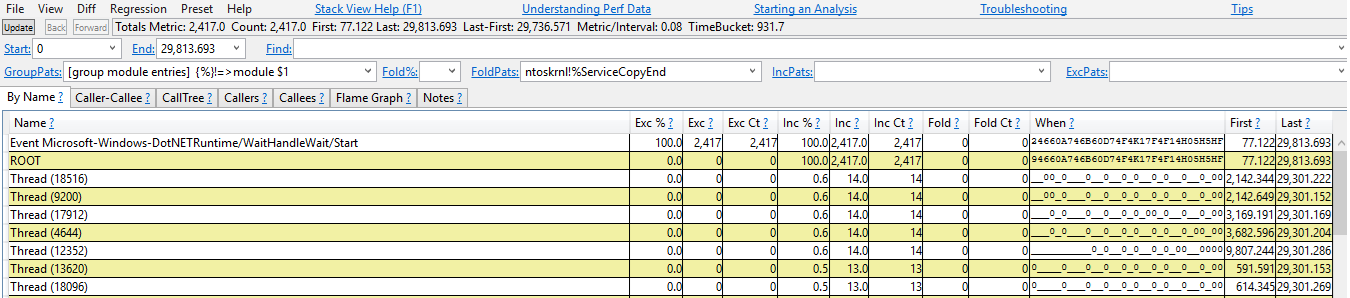
按兩下 「Event Microsoft-Windows-DotNETRuntime/WaitHandleWait/Start」 這一行。
現在,您應該會看到 WaitHandleWait 事件被發出的堆疊追蹤。 它們會依 「WaitSource」 進行分割。 目前有兩個來源:
MonitorWait針對透過 Monitor.Wait 發出的事件,以及Unknown所有其他來源。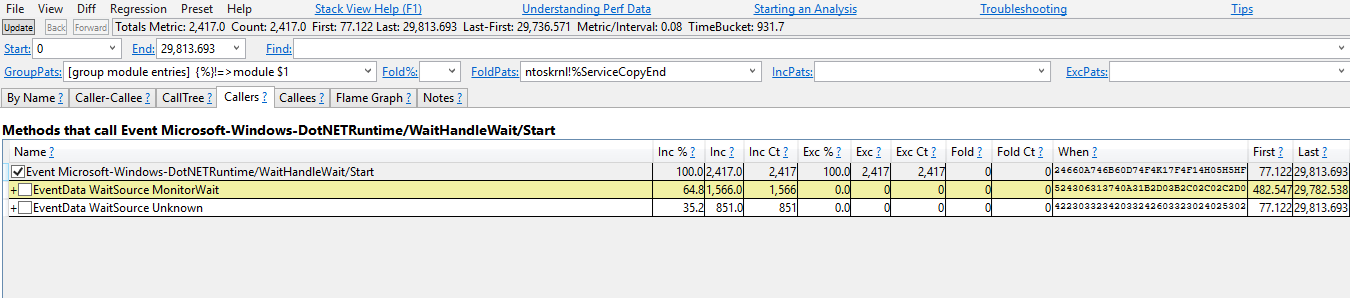
從 MonitorWait 開始,因為它代表事件的 64.8%。 您可以勾選複選框,以展開負責發出此事件的堆疊追蹤。
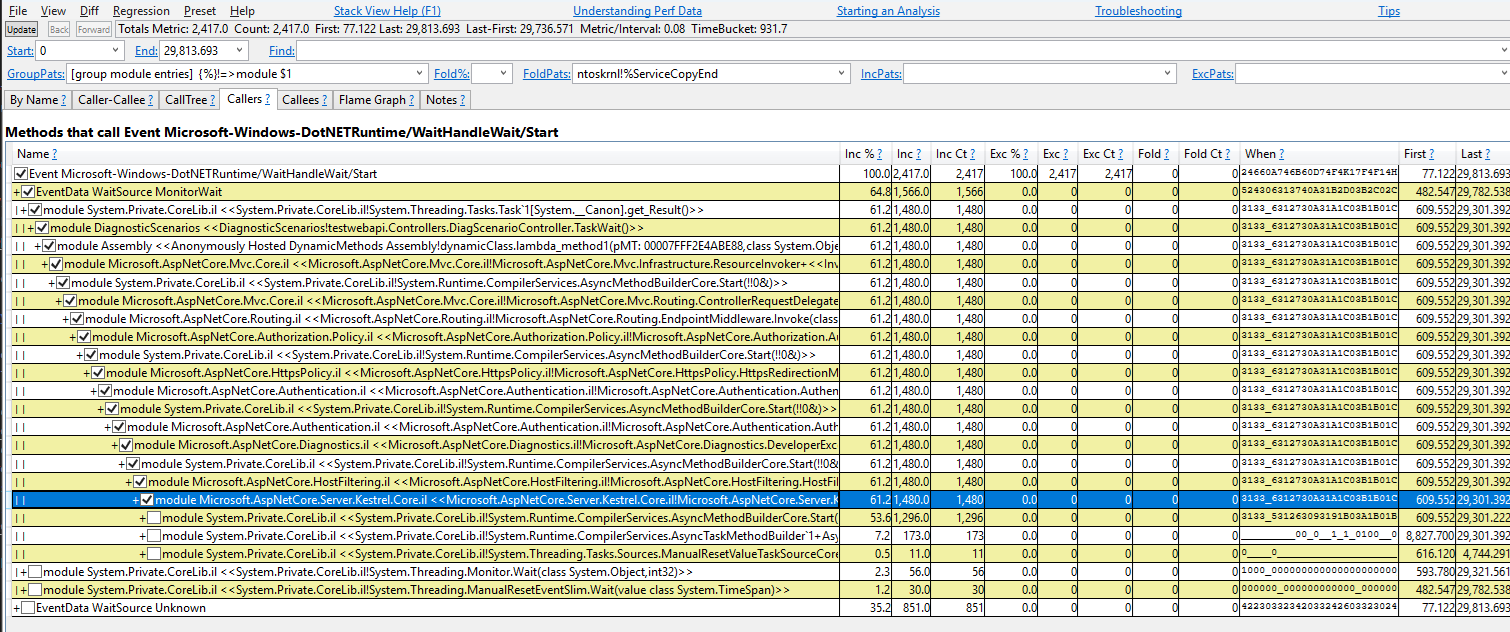
此堆棧追蹤可以讀取為:
Task<T>.Result使用 WaitSource MonitorWait 發出 WaitHandleWait 事件(Task<T>.Result用來Monitor.Wait執行等候)。 它是由 所呼叫DiagScenarioController.TaskWait,這是由某些 Lambda 所呼叫,而某些 ASP.NET 程式代碼會呼叫它


使用 .NET 事件查看器分析 nettrace 檔案
拖放 nettrace 檔案。
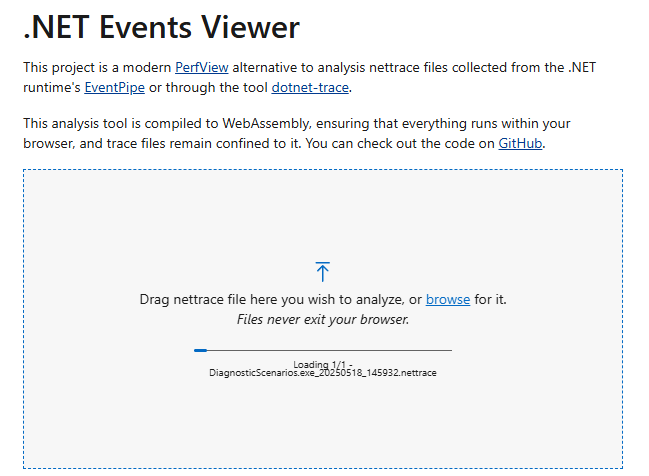
移至 事件樹 頁面,選取事件「WaitHandleWaitStart」,然後選取 執行查詢。
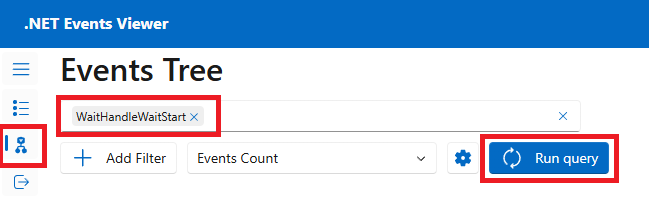
您應該會看到 WaitHandleWait 事件被觸發時的堆疊追蹤。 點擊箭頭以展開用於發出此事件的堆疊追蹤。
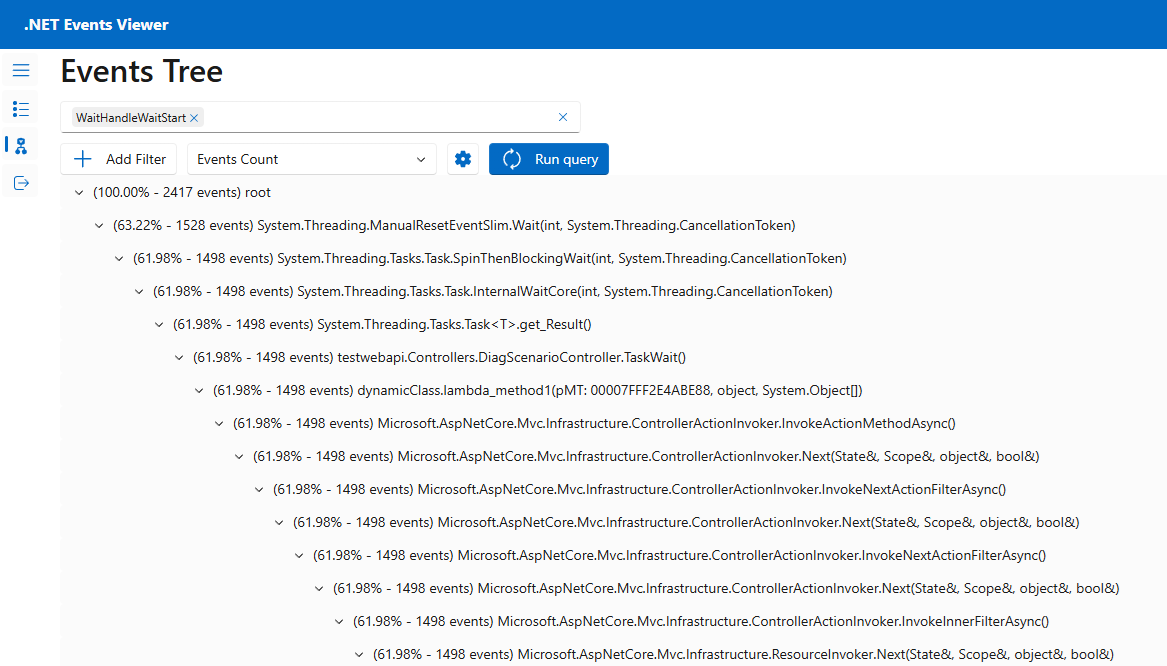
此堆疊追蹤可以讀取為:
ManualResetEventSlim.Wait發出 WaitHandleWait 事件。 它是由Task.SpinThenBlockWait呼叫的,而Task.InternalWaitCore又是由Task<T>.Result呼叫的,而Task<T>.Result又是由呼叫的,而又是由某個 lambda 呼叫的,而該 lambda 是由某些 ASP.NET 程式代碼所呼叫。

在真實世界的情境中,您可能會發現許多等待事件是從線程池外部的線程發出的。 在這裡,您正在調查 執行緒池 耗盡困境,因此執行緒池外部專用執行緒上的所有等待都不相關。 您可以藉由檢視方法的開頭部分來判斷堆疊追蹤是否來自執行緒集區,這應該包含執行緒集區的提及(例如 WorkerThread.WorkerThreadStart 或 ThreadPoolWorkQueue)。

程序代碼修正
現在,您可以在範例應用程式的 Controllers/DiagnosticScenarios.cs 檔案中瀏覽至此控制器的程式代碼,以查看它呼叫異步 API 而不使用 await。 這是 同步跨異步 代碼模式,已知會封鎖執行緒,而且是執行緒池資源匱乏最常見的原因。
public ActionResult<string> TaskWait()
{
    // ...
    Customer c = PretendQueryCustomerFromDbAsync("Dana").Result;
    return "success:taskwait";
}
在此情況下,程式代碼可以輕易變更為改用 async/await,如端點所示 TaskAsyncWait() 。 使用 await 可讓目前線程在資料庫查詢進行時服務其他工作專案。 資料庫查閱完成時,ThreadPool 線程將會繼續執行。 如此一來,每個請求期間,程式碼中就不會封鎖任何線程。
public async Task<ActionResult<string>> TaskAsyncWait()
{
    // ...
    Customer c = await PretendQueryCustomerFromDbAsync("Dana");
    return "success:taskasyncwait";
}
執行 Bombadier 以將負載傳送至 api/diagscenario/taskasyncwait 端點時,會顯示 ThreadPool 線程計數會保持低得多,而使用 async/await 方法時,平均延遲會維持在 500 毫秒附近:
>bombardier-windows-amd64.exe https://localhost:5001/api/diagscenario/taskasyncwait
Bombarding https://localhost:5001/api/diagscenario/taskasyncwait for 10s using 125 connection(s)
[=============================================================================================] 10s
Done!
Statistics        Avg      Stdev        Max
  Reqs/sec       227.92     274.27    1263.48
  Latency      532.58ms    58.64ms      1.14s
  HTTP codes:
    1xx - 0, 2xx - 2390, 3xx - 0, 4xx - 0, 5xx - 0
    others - 0
  Throughput:    98.81KB/s