Jupyter Notebook 讓建立和共用 Power BI 報表變得簡單。 使用 Jupyter Notebook,您可以快速內嵌或建立報表。
powerbiclient Python 套件可讓您輕鬆地在 Jupyter 筆記本中內嵌 Power BI 報表。 您可以從 Power BI 報表中的視覺效果將數據匯出至 Jupyter Notebook,以進行深入的數據探索。 您也可以篩選報表以進行快速分析,或使用書籤來套用已儲存的檢視。
安裝 Power BI 用戶端套件
PyPI上可以找到 powerbiclient 套件。 它也開放原始碼 GitHub。
若要安裝套件,您可以使用 pip。
如果您使用 Jupyter Notebook:
pip install powerbiclient如果您使用 JupyterLab:
pip install powerbiclient
jupyter labextension install @jupyter-widgets/jupyterlab-manager
如果您使用 Jupyter Notebook 5.2 或更早版本,您可能也需要啟用 nbextension:
jupyter nbextension enable --py [--sys-prefix|--user|--system] powerbiclient
在 Jupyter 筆記本中內嵌 Power BI 報表
如需詳細的使用方式資訊,請參閱 GitHub wiki。
內嵌報表
此範例示範如何使用套件內嵌Power BI報表。
從封裝匯入報表類別和模型:
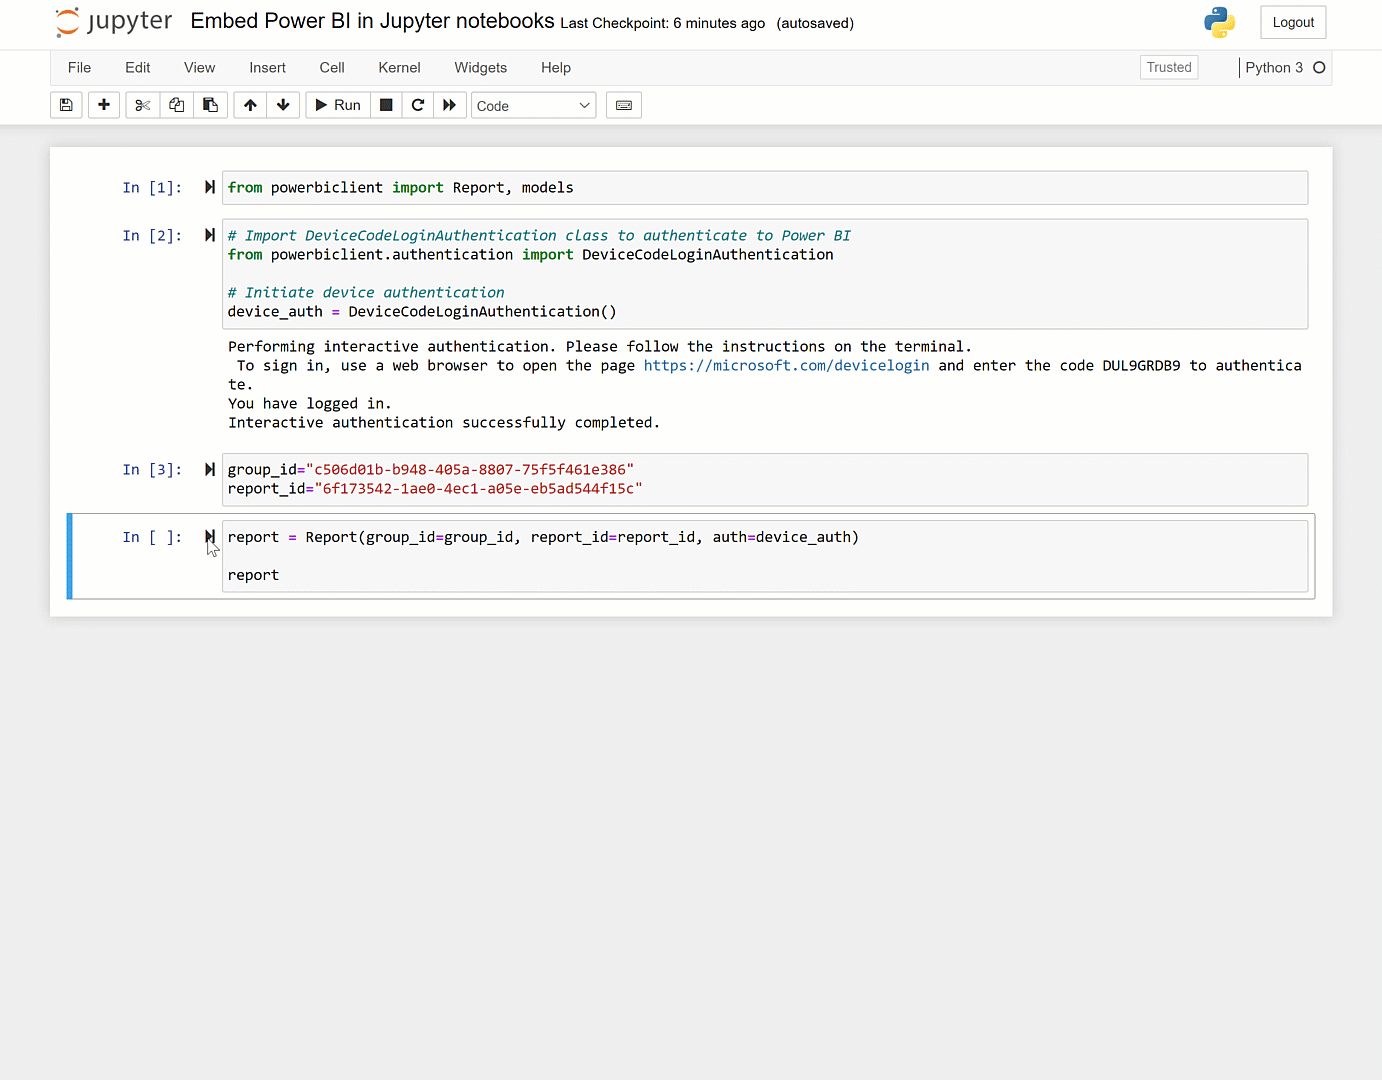
from powerbiclient import Report, models使用 Azure AD 對 Power BI 進行驗證:
# Import the DeviceCodeLoginAuthentication class to authenticate against Power BI
from powerbiclient.authentication import DeviceCodeLoginAuthentication

# Initiate device authentication
device_auth = DeviceCodeLoginAuthentication()
設定您要內嵌的工作區識別碼和報表識別碼:
group_id="Workspace ID"
report_id="Report ID"
建立 Power BI 報表的實例,並將報表載入至輸出資料格:
report = Report(group_id=group_id, report_id=report_id, auth=device_auth)

report
執行示範
GitHub 存放庫包含內嵌使用者報表的 示範 Jupyter 筆記本。 它示範內嵌與 Power BI 報表互動的完整流程,包括:
- 報表事件處理程式
- 取得頁面清單
- 取得視覺效果清單
- 匯出和視覺效果數據
- 套用篩選
若要執行示範:
請確定您有下列必要條件:
- 熊貓
- matplotlib
執行下列命令:
cd demo
jupyter notebook
執行
demo.ipynb。
快速建立報表
您也可以只需幾個步驟,輕鬆地從數據產生Power BI 快速報表。 使用筆記本中的任何 DataFrame,將它快速轉換成深入解析的視覺效果。」 如有需要,請儲存報表,並以任何其他報表的形式加以使用。
如需詳細描述,請參閱 使用 Jupyter Notebook快速建立報表。 如需示範 Jupyter Notebook,請參閱 GitHub 存放庫。